Article
1
Quantitative Structure-Activity Analysis of Triazines
2
Immune Recognition Based on Immunoassay Data
3
for polyclonal and Monoclonal Antibodies
4
Andrey A. Buglak1,2*, Anatoly V. Zherdev1, Hong-Tao Lei3, Boris B. Dzantiev1
5
1 A. N. Bach Institute of Biochemistry, Research Center of Biotechnology of the Russian Academy of Sciences,
6
33 Leninsky Prospect, Moscow 119071, Russia
7
2 St. Petersburg State University, 7/9 Universitetskaya emb., St. Petersburg 199034 Russia
8
3 Guangdong Provincial Key Laboratory of Food Quality and Safety, South China Agricultural University
9
Guangzhou 510642, China
10
* Correspondence: [email protected]; Tel.: +7 (495) 954-27-32
11
12
Abstract: A common task in the immunodetection of structurally close compounds is to analyze the
13
selectivity of immune recognition: it is required to understand the regularities of immune
14
recognition and to elucidate the basic structural elements which provide it. Triazines are
15
compounds of particular interest for such a research due to their high variability and the necessity
16
of their monitoring to provide safety of agricultural products and foodstuffs. We evaluated the
17
binding of 20 triazines with polyclonal (pAb) and monoclonal (mAb) antibodies obtained using
18
atrazine as the immunogenic hapten. A total of > 3000 descriptors was used in QSAR analysis of
19
binding activities (pIC50). Comparison of the two enzyme immunoassay systems showed that the
20
system with pAb is much easier to describe using 2D QSAR methodology, while the system with
21
mAb can be described using the 3D QSAR COMFA. Thus, for the 3D QSAR model of the polyclonal
22
antibodies, the main statistical parameter q2 (‘leave-many-out’) is equal 0.498, and for monoclonal
23
antibodies q2 is equal 0.566. Obviously, in the case of pAb, we deal with several targets, while in the
24
case of mAb the target is one, and therefore it is easier to describe it using specific fields of molecular
25
interactions distributed in space.
26
Keywords: Monoclonal antibodies; Polyclonal antibodies; Triazines; Enzyme immunoassay;
27
Quantitative structure-activity relationship analysis; 3D-QSAR; Atrazine.
28
29
1. Introduction
30
Triazines are herbicides which are widely used in agriculture and may accumulate in soil, as
31
well as in food products [1]. Atrazines are bound in soil to solid as well as to dissolved fractions
32
of humic and fulvic acids which leads not only to their accumulation in soil but also to
33
contamination of surface and ground waters [2] since they are water soluble.
34
Triazines may undergo chemical transformations of both biotic and abiotic nature. The parent
35
compound atrazine is subjected to oxidation of the alkyl substituents, oxidative dealkylation,
36
hydroxylation, and, also to ring cleavage [3-5]. The derivatives of atrazine may be toxic to a greater
37
or lesser extent. Triazines may induce different physiological disorders of humans and animals
38
like immunity suppression [6] and birth defects [7]. Thus, contamination of the environment by
39
triazine herbicides is a significant risk factor. For this reason it is necessary to monitor the triazine
40
levels in soil, water, agricultural products and foods.
41
The methods of triazines detection like NMR, HPLC, mass-spectrometry and others are time
42
and labour-consuming. The immunoassay determination of triazines is much easier, less
43
expensive, highly sensitive and rapid. Due to its selectivity and simplicity the immunoassay has
44
been used to detect a wide variety of environmental pollutants including triazines [8-10].
45
However, siginificant variety of triazines and their derivatives causes necessity in detailed
46
analysis of regulations of their immune recognition.
47
Quantitative structure-activity relationship (QSAR) is widely used studying the immune
48
recognition of diffferent classes of toxic food contaminants, veterinary drugs, including pesticides,
49
etc [11-14]. The work by Yuan and co-authors reported about an immunoassay analysis of
50
triazines, yet on a small set of 11 compounds [9]. QSAR is used for the analysis of immunoassays
51
on quinolones and fluoroquinolones [15-19], organophosphorus pesticides [20-21], phenylurea
52
herbicides [22], sulfonamides [23]. In this study we used molecular modeling to study triazine
53
recognition by monoclonal and polyclonal antibodies. Twenty triazines along with 2D and
3D-54
QSAR methodology were used to study the relationship between antigen and antibody.
55
Experimental data of microplate immunoenzyme assays with broad specificity for triazines was
56
used from a classical work by A. Dankwardt and co-authors [24]. Comparative immunoassay of
57
polyclonal and monoclonal antibodies used 4-arylamino-6-amino-1,3,5-triazines (Scheme 1).
58
Antibodies were grown using atrazine as an immunizing hapten.
59
60
Scheme 1. Molecular structure of arylamino-s-triazines (based on Danckwardt et al., 1996).
61
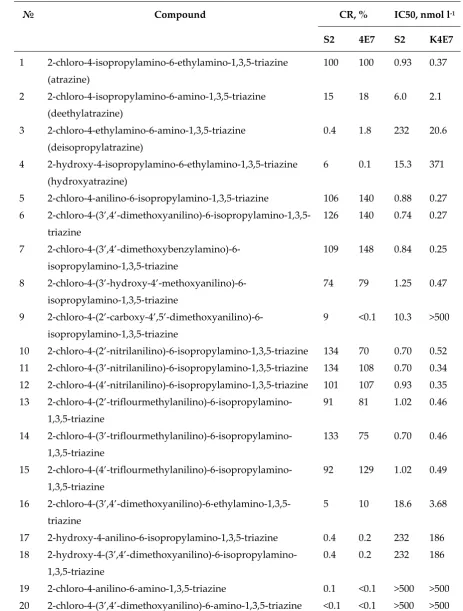
The antibody-binding activity of triazines from Table 1, presented in the logarithmic form
62
(pIC50), was used as the dependent variable y during QSAR calculations. In Table 1 S2 stands for
63
polyclonal sheep antibodies, while K4E7 stands for monoclonal antibodies.
Table 1. Cross-reactivity (CR) and concentration of 50% inhibition for the interaction of triazines with
65
polyclonal (S2) and monoclonal antibodies (K4E7), according to Danckwardt, et al., 1996.
66
№ Compound CR, % IC50, nmol l-1
S2 4E7 S2 K4E7 1 2-chloro-4-isopropylamino-6-ethylamino-1,3,5-triazine
(atrazine)
100 100 0.93 0.37
2 2-chloro-4-isopropylamino-6-amino-1,3,5-triazine
(deethylatrazine)
15 18 6.0 2.1
3 2-chloro-4-ethylamino-6-amino-1,3,5-triazine
(deisopropylatrazine)
0.4 1.8 232 20.6
4 2-hydroxy-4-isopropylamino-6-ethylamino-1,3,5-triazine
(hydroxyatrazine)
6 0.1 15.3 371
5 2-chloro-4-anilino-6-isopropylamino-1,3,5-triazine 106 140 0.88 0.27
6
2-chloro-4-(3’,4’-dimethoxyanilino)-6-isopropylamino-1,3,5-triazine
126 140 0.74 0.27
7
2-chloro-4-(3’,4’-dimethoxybenzylamino)-6-isopropylamino-1,3,5-triazine
109 148 0.84 0.25
8
2-chloro-4-(3’-hydroxy-4’-methoxyanilino)-6-isopropylamino-1,3,5-triazine
74 79 1.25 0.47
9
2-chloro-4-(2’-carboxy-4’,5’-dimethoxyanilino)-6-isopropylamino-1,3,5-triazine
9 <0.1 10.3 >500
10 2-chloro-4-(2’-nitrilanilino)-6-isopropylamino-1,3,5-triazine 134 70 0.70 0.52
11 2-chloro-4-(3’-nitrilanilino)-6-isopropylamino-1,3,5-triazine 134 108 0.70 0.34
12 2-chloro-4-(4’-nitrilanilino)-6-isopropylamino-1,3,5-triazine 101 107 0.93 0.35
13
2-chloro-4-(2’-triflourmethylanilino)-6-isopropylamino-1,3,5-triazine
91 81 1.02 0.46
14
2-chloro-4-(3’-triflourmethylanilino)-6-isopropylamino-1,3,5-triazine
133 75 0.70 0.46
15
2-chloro-4-(4’-triflourmethylanilino)-6-isopropylamino-1,3,5-triazine
92 129 1.02 0.49
16
2-chloro-4-(3’,4’-dimethoxyanilino)-6-ethylamino-1,3,5-triazine
5 10 18.6 3.68
17 2-hydroxy-4-anilino-6-isopropylamino-1,3,5-triazine 0.4 0.2 232 186
18
2-hydroxy-4-(3’,4’-dimethoxyanilino)-6-isopropylamino-1,3,5-triazine
0.4 0.2 232 186
19 2-chloro-4-anilino-6-amino-1,3,5-triazine 0.1 <0.1 >500 >500
2. Results
67
2.1. 2D QSAR
68
2.1.1. S2 system analysis (polyclonal antibodies)
69
For S2 system a series of multiple linear regression models was obtained:
70
Model 1
71
pIC50 = 23.68 + 0.985 * ES_Count_sssCH − 64.66 * Mulliken_Charge_C4 + 0.056 * Solvation_E
72
Model 2
73
pIC50 = 12.43 + 4.393 * ES_Sum_sssCH − 107.3 * Jurs_FPSA_3
74
Model 3
75
pIC50 = 11.92 − 0.910 * CHI_2 + 1.932 * CHI_V_2 − 100.3 * Jurs_FPSA_3
76
Model 4
77
pIC50 = 8.807 + 5.366 * ES_Sum_sssCH + 0.828 * IC2 – 104.0 * Jurs_FPSA_3
78
Model 5
79
pIC50 = 6.302 + 6.182 * ES_Sum_sssCH + 0.946 * IC2 + 0.062 * Solvation_E
80
It is believed that QSAR is predictive if the following conditions are satisfied: R2 > 0.6, q2 >
81
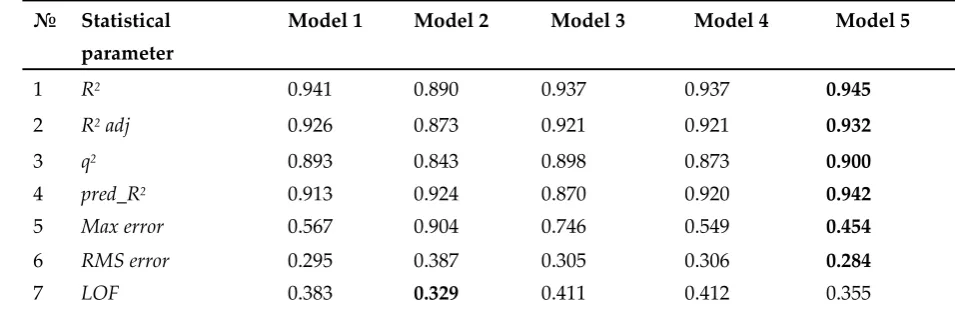
0.5 and pred_R2 > 0.5. Table 2 shows that all the presented models are statistically reliable and possess
82
predictive ability. Model 5 has the highest statistical parameters among the five models.
83
Table 2. Statistical parameters of the models for S2 system.
84
№ Statistical parameter
Model 1 Model 2 Model 3 Model 4 Model 5
1 R2 0.941 0.890 0.937 0.937 0.945
2 R2 adj 0.926 0.873 0.921 0.921 0.932
3 4 5 q2 pred_R2 Max error 0.893 0.913 0.567 0.843 0.924 0.904 0.898 0.870 0.746 0.873 0.920 0.549 0.900 0.942 0.454 6 7 RMS error LOF 0.295 0.383 0.387 0.329 0.305 0.411 0.306 0.412 0.284 0.355
85
Let us consider the descriptors involved in Model 5. Solvation_E (relative contribution, α =
86
66.8%) is the solvation energy calculated with AM1 method. Compound 18 has the highest solvation
87
energy value (-20.27 kJ mol-1), while compound 13 has the lowest one (-71.22 kJ mol-1) (Table S1). The
88
lower the solvation energy the higher the solubility. However, the energy of solvation has a negative
89
value, and therefore compounds that are less soluble in water (i.e., more hydrophobic) have higher
90
pIC50 values.
91
ES_Sum_sssCH (26.1%) is the electrotopological index of methanthriyl groups [25]. The
92
ES_Sum_sssCH value is directly proportional to the activity of the molecule (1, 2 and similar
93
compounds). ES_Sum_sssCH is equal zero for the compounds without >CH-groups. Obviously, the
94
presence of the ES_Sum_sssCH descriptor in Model 5 indicates the participation of >CH-groups of
95
triazine compounds in van der Waals interactions with hydrophobic regions of antibodies.
96
IC2 (7.1%) is the information content index (neighborhood symmetry of 2-order). This
descriptor makes possible to estimate the degree of heterogeneity of the molecular structure.
98
Compound 1 has the lowest value of IC2 (3.431), and compound 9 has, on the contrary, the highest
99
value of this descriptor (4.426). IC2 can be considered as a measure of the complexity of the triazine
100
topology. IC2 has a minor contribution to the model (α = 7.1%)) and, apparently, acts as a correction
101
term in the linear regression equation.
102
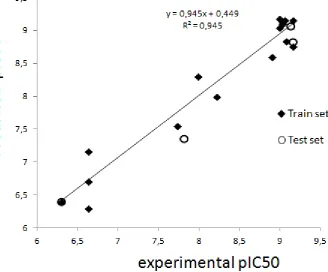
Experimental and predicted pIC50 values for triazine interactions with polyclonal antibodies
103
(S2) based on Model 5 are presented on Figure 1.
104
105
Figure 1. Comparison of experimental pIC50 values for triazine interactions with polyclonal
106
antibodies (S2) and predicted activity based on Model 5; compounds 4, 6, 14 and 19 were used as a
107
test set.
108
2.1.2 K4E7 system analysis (monoclonal antibodies)
109
For K4E7 system a series of multiple linear regression models was obtained:
110
Model 6
111
pIC50 = 7.142 − 9.584 * Mor21v − 0.561 * NPlusO_Count + 33.83 * R6m+
112
Model 7
113
pIC50 = 5.859 − 0.018 * Jurs_TPSA − 7.118 * Mor21v + 27.20 * R6m+
114
Model 8
115
pIC50 = -3.941 + 1.291 * ES_Count_sssCH + 5.271 * IC2 − 0.216 * Jurs_DPSA_3
116
Model 9
117
pIC50 = 7.173 − 8.061 * Mor21v − 0.0385 * TPSA_NO + 34.56 * R6m+
118
Model 10
119
pIC50 = 7.369 + 1.637 * ES_Count_sssCH + 0.287 * ES_Sum_sCl − 0.791 * Num_H_Donors_Lipinski
120
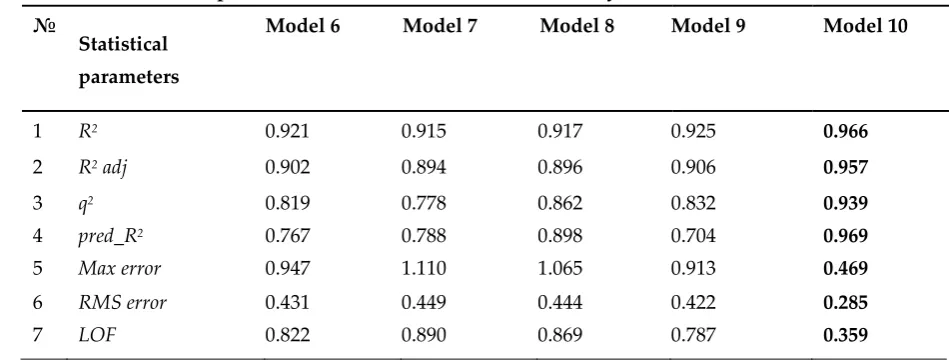
Model 10 has a high predictive ability, its statistical parameters are higher than for the models
6-9 (Table 3).
122
Table 3. Statistical parameters of 2D QSAR models for K4E7 system.
123
№
Statistical parameters
Model 6 Model 7 Model 8 Model 9 Model 10
1 R2 0.921 0.915 0.917 0.925 0.966
2 R2 adj 0.902 0.894 0.896 0.906 0.957
3
4 5
q2
pred_R2
Max error
0.819
0.767 0.947
0.778
0.788 1.110
0.862
0.898 1.065
0.832
0.704 0.913
0.939 0.969 0.469 6
7
RMS error LOF
0.431 0.822
0.449 0.890
0.444 0.869
0.422 0.787
0.285 0.359
124
Num_H_Donors_Lipinski (α = -37.9%) is the number of hydrogen bond donors (Table S2).
125
The value of the descriptor is inversely correlated with the activity: the greater the number of
126
hydrogen bond donors the lower the activity. Apparently, the presence of amine groups (NH and
-127
NH2) negatively affects the activity.
128
ES_Sum_sCl (34.6%) is the electrotopological index of chlorine atoms.35 The ES_Sum_sCl
129
value is directly proportional to the activity of the molecule. Apparently, the chlorine atom, as an
130
electron-acceptor substituent, participates in electrostatic interactions.
131
ES_Count_sssCH (27.4%) - the number of methantriyl groups. Obviously, the presence of
132
the ES_Count_sssCH descriptor in Model 10 indicates the participation of hydrophobic substituents
133
in the triazine compounds in van der Waals interactions with hydrophobic regions of antibodies.
134
Experimental and predicted pIC50 values for triazine interactions with monoclonal
135
antibodies (K4E7) based on Model 10 are presented on Figure 2.
137
Figure 2. Comparison of experimental pIC50 values for triazine interactions with monoclonal
138
antibodies (K4E7) and predicted activity based on Model 10; compounds 6, 10, 16 and 20 were used
139
as a test set.
140
2.2 3D QSAR
141
2.2.1 S2 system study
142
3D QSAR analysis was carried out for all 20 compounds without splitting the sample into the
143
training and test sets. The interaction energy of the "probe" (carbon atom with charge +1) with the
144
target molecule was calculated at each point of the regular 3D lattice. The dimensions of the 3D cubic
145
grid were 26 × 18 × 22 Å. The lattice spacing was 2 Å.
146
Three models were built consisting of 1, 2 and 3 principal components (PC). One can
147
consider Table 4 to compare the accuracy of the activity prediction for individual molecules within
148
each model including the optimal amount of PC for predicting the activity of each compound.
149
Table 4. Experimental and predicted values of triazine cross-reactivity logarithm (pIC50) in S2
150
system.
151
№ Experiment PC 1 PC 2 PC 3 Optimal number of PC
1 9.032 8.741 8.725 9.056 3
2 8.222 8.369 8.210 8.405 2
3 6.635 7.384 6.709 6.846 2
4 7.815 7.314 7.238 7.297 1
6 9.131 8.755 8.793 8.763 2
7 9.076 9.344 9.205 9.393 2
8 8.903 7.772 8.630 8.713 3
9 7.987 8.829 8.408 7.878 3
10 9.155 9.419 9.472 9.492 1
11 9.155 8.985 9.507 9.276 3
12 9.032 9.738 9.062 8.811 2
13 8.991 8.640 8.730 9.147 3
14 9.155 8.576 9.158 9.108 2
15 8.991 8.913 9.061 9.016 3
16 7.731 7.210 7.226 7.406 3
17 6.635 7.137 7.274 7.039 3
18 6.635 6.611 7.232 6.950 1
19 6.301 7.053 6.512 6.529 2
20 6.301 6.843 6.192 6.170 2
152
Van der Waals interactions make the main contribution to the interactions between triazine
153
and antibody in the S2 system in all three models (Table S3).
154
To estimate the predictive ability of the 3D-QSAR models obtained the following statistical
155
parameters were used: the coefficient of determination (R2), the mean-square error of the model
156
(SDEC), the F-statistic value, the correlation coefficient of the LOO method (q2(LOO)), the correlation
157
coefficient of the LMO method (q2(LMO)), the mean-square error of prediction (SDEP). The model with
158
3 principal components showed satisfactory statistical results (Table 5).
Table 5. Statistical parameters of COMFA models for S2 system.
160
№ PC R2 SDEC F-test q2(LOO) SDEP(LOO) q2(LMO) SDEP(LMO)
1 1 0.736 0.554 50.18 0.260 0.927 0.185 0.968
2 2 0.896 0.347 73.57 0.602 0.680 0.439 0.800
3 3 0.938 0.269 80.39 0.680 0.610 0.498 0.754
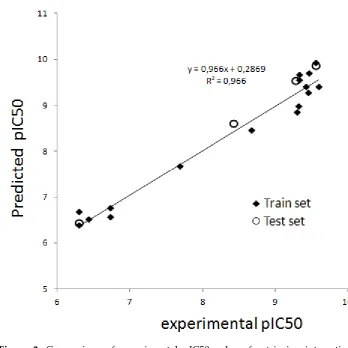
As can be seen from Table 5, the model with three principal components has the highest
161
predictive ability. High coefficients of determination (R2 = 0.938) and LOO cross-validation (q2 = 0.68)
162
indicate the statistical significance of the model obtained. High correlation between predicted and
163
experimental values of the model with three PC can be seen on Figure 3.
164
165
Figure 3. Experimental vs. predicted values of triazines cross-reactivity in S2 system according to the
166
COMFA method (3D QSAR).
167
MIF contour maps were obtained to visualize the information about the 3D-QSAR models.
168
Contour maps are presented in Figure 4. The steric fields presented by green contours are favorable
169
for bulk substituents and have a positive effect on cross-reactivity (Figure 4, a), while the yellow
170
contours represent the areas where the presence of bulk substituents is unfavorable for high activity
171
(Figure 4, b). The electrostatic fields are represented by blue and red contours. The blue contour
172
reflects the areas where negatively charged atoms have a positive effect on activity (Figure 4, c), while
173
the red contours reflect the regions in which the presence of negatively charged atoms is unfavorable
174
for high activity (Figure 4, d).
176
Figure 4. The MIF contour maps for the system S2 and compound 7: (a) favorable steric interactions;
177
(b) unfavorable steric interactions; (c) favorable electrostatic interactions; (d) unfavorable electrostatic
178
interactions.
179
2.2.2 K4E7 system study
180
3D QSAR analysis was carried out for all 20 compounds without splitting the sample into the
181
training and test parts. The same alignment was used as for the S2 system.
182
The predicted values of triazine activity are shown in Table 6: the calculated values of the
183
model consisting of 3 principal components have the best match with the experimental data. The
184
level of correlation between the activities predicted by the COMFA model and the experimental
185
values is also shown on Figure 5.
186
Table 6. Experimental and predicted values of triazines cross reactivity in the K4E7 system.
187
№ Experiment PC 1 PC 2 PC 3 Optimal number of PC
1 9.432 9.208 8.784 9.120 1
2 8.678 9.050 8.538 8.786 3
3 7.686 8.187 7.487 7.746 3
4 6.431 7.330 6.371 6.429 3
5 9.569 9.147 9.191 9.031 2
6 9.569 8.573 9.279 9.361 3
7 9.602 10.651 10.054 9.397 3
8 9.328 8.253 8.757 8.894 3
10 9.284 9.399 9.533 9.455 1
11 9.469 9.134 9.502 9.462 3
12 9.456 9.400 9.595 9.871 1
13 9.337 8.744 8.763 9.212 3
14 9.337 9.287 9.809 9.776 1
15 9.310 9.212 9.704 9.527 1
16 8.434 7.852 8.203 8.497 3
17 6.731 7.493 7.023 6.721 3
18 6.731 6.256 6.404 6.362 2
19 6.301 7.279 6.947 6.931 3
20 6.301 5.971 6.199 6.266 3
188
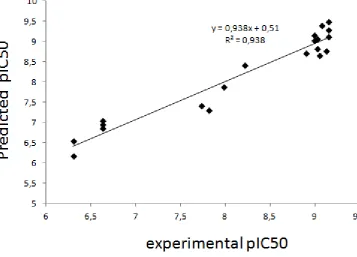
Figure 5. K4E7 system experimental and predicted pIC50 triazine values based on the COMFA
189
method (3D QSAR).
190
Table 7. Statistical parameters of 3D QSAR models for K4E7 system.
191
№ PC R2 SDEC F-test q2(LOO) SDEP(LOO) q2(LMO) SDEP(LMO)
1 1 0.780 0.620 63.90 0.382 1.039 0.320 1.081
2 2 0.903 0.413 78.70 0.591 0.846 0.517 0.908
3 3 0.952 0.291 105.0 0.637 0.796 0.566 0.861
Table 7 shows that the model with three PC has the highest values of the determination
192
coefficient (R2 = 0.952) and LOO cross-validation parameter (q2 = 0.637), which indicates the statistical
193
significance of the model obtained. The contour maps of the molecular interaction for this model are
194
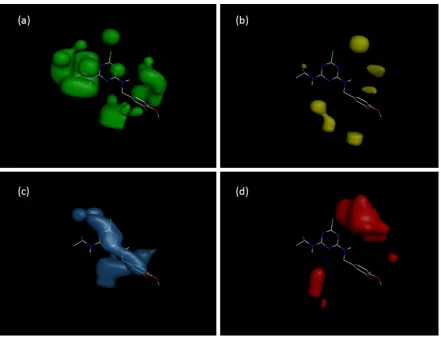
presented in Figure 6.
196
Figure 6. MIF contour maps for the K4E7 system: (a) favorable steric interactions and (b) unfavorable
197
steric interactions for compound 11; (c) favorable electrostatic interactions and (d) unfavorable
198
electrostatic interactions for compound 12.
199
The contributions of van der Waals and electrostatic interactions to the model with three
200
principal components are approximately equal: 51% and 49%, respectively (Table S4).
201
3. Discussion
202
It seems reasonable to compare the most similar compounds with each other and find out
203
which descriptors play a key role in their recognition.
204
Atrazine in the S2 system (polyclonal antibodies) exhibits significantly higher activity (CR
205
100%) than its metabolites - compounds 2, 3 and 4 (CR 15%, 0.4% and 6%, respectively). Atrazine has
206
the highest value of the Solvation_E descriptor (see Table S1) and the lowest value of FPSA_3 among
207
these four compounds. FPSA_3 is the partial polar surface area of the molecule. The value of this
208
descriptor is inversely proportional to pIC50. FPSA_3 reflects the ability of molecules to form
209
hydrogen bonds. The lower the proportion of the polar surface area of the molecule (N, O atoms and
210
associated hydrogen) the lower the activity. For compounds 1-4 FPSA_3 is equal to 0.037, 0.048, 0.054
211
and 0.054, respectively. In general, this is consistent with our observation that the polarity of atrazines
212
is unfavorable for the interaction with the antibodies.
213
For the K4E7 system (monoclonal antibodies) pIC50 values of 1-4 compounds are highly
214
correlated with the Jurs_TPSA descriptor (the total area of the polar surface): 29.44, 41.45, 43.08 and
215
90.88, respectively. Jurs_TPSA is the analogue of FPSA_3 descriptor, and just like FPSA_3 it indicates
that hydrophobic interactions play an important role in the recognition of triazine by the antibodies.
217
Polar atoms (primarily nitrogen and oxygen) on the surface of the molecule, on the contrary, are
218
unfavorable for the binding with the antibody.
219
For system S2, in the series of compounds 6-9 (CR 126%, 109%, 74% and 9%, respectively), the
220
decrease in pIC50 is inversely correlated with the growth of FPSA_3: 0.043, 0.043, 0.048 and 0.049,
221
respectively.
222
It is more difficult to interpret the COMFA contour maps than 2D descriptors, however, in the
223
case of the K4E7 system and 6-9 compounds we should regard them. The radical at the C6 position
224
does not differ in these compounds, and the variation of the substituent in the C4 position obviously
225
plays the main role. Geometry of compound 7 is the most advantageous for the interaction with the
226
antibody, and geometry 9 is the least advantageous (Figure 2). The contour map of electrostatic
227
charges (Figure 8d) indicates that the presence of a negatively charged carboxyl group at position 2'
228
(compound 9) is unfavorable for the binding with the antibody. The contour map of electrostatic
229
charges on Figure 8c, on the contrary, shows how the presence of negatively charged oxygen atoms
230
of the methoxy groups of compound 7 has a positive effect on the activity. The contour map on Figure
231
8a shows that the aniline residue at the C4 position (namely, the benzene ring) generally has a positive
232
effect on the activity of atrazines; The contour map of van der Waals interactions on Figure 8b shows
233
that the bulky substituents localized at meta position of the aniline have a negative effect on the
234
activity: the methoxy substituents of compound 9 are located in these areas.
235
Compounds 10, 11 and 12 differ have ortho-, meta- and para-positions of the nitrile of the aniline
236
substituent, respectively (Figure 2). The activity of these compounds in the system S2 is determined
237
by the contour maps of electrostatic interactions (Figures 6c, 6d).
238
Let us regard compounds 13, 14 and 15 which possess trifluoromethyl radical (-CF3) in the
239
ortho-, para- and meta- positions, respectively. In the S2 system, the molecule 14 is more active than
240
13 and 15 (Table 1). In order to answer the question why these compounds exhibit different activities,
241
it is required to consider the FPSA_3 descriptor involved in 2D QSAR models 2, 3 and 4. This
242
descriptor reflects the fractional polar surface area of the molecule, and is inversely correlated with
243
pIC50. For compounds 13, 14 and 15, FPSA_3 is equal 0.033, 0.032 and 0.033, respectively. Obviously,
244
the smaller the fraction of the positively charged surface of the molecule, the lower the activity. In
245
general, this is consistent with our observations that hydrophobicity of atrazines facilitates their
246
recognition by the antibodies.
247
Obviously, the low activity of compounds 16, 19 and 20 in both systems (S2 and K4E7) is due
248
to the absence of the isopropylamino radical at the C6 position. This is confirmed both by the 2D
249
descriptors ES_Count_sssCH, ES_Sum_sssCH, and by the contour maps of van der Waals
250
interactions (Figures 6a and 8a). Also, it is quite obvious that compounds 18, 19 have low pIC50
251
values due to the presence of the -OH group in the C2 position instead of chlorine.
252
If we compare the 2D QSAR models for monoclonal antibodies (mAb) and polyclonal
253
antibodies (pAb) one can see that both models (Model 4 for mAb and Model 7 for pAb) contain polar
254
surface area parameter: Jurs_FPSA_3 and Jurs_TPSA, respectively. The polar surface area is inversely
255
correlated with the activity, it means that the polarity of atrazines is unfavorable for the interaction
256
with both monoclonal and polyclonal antibodies. Both mAb and pAb are affected by the amount of
257
methantryil groups (ES_Sum_sssCH and ES_Count_sssCH parameters, respectively), which means
258
that in both cases bulk substituents are favorable for higher activity. The latter statement is supported
by 3D molecular interaction field contour maps (Figures 6a and 8a). We may see that both mAb and
260
pAb systems have very much in common.
261
4. Materials and Methods
262
4.1 Conformational analysis and geometry optimization
263
Preparation of molecular geometries for 2D and 3D QSAR analysis was carried out in
264
Spartan v.16 program. A series of conformers for each of the 20 compounds was obtained by the
265
systematic search method using the MMFF force field [26]. Optimization of the geometry for each
266
conformer was carried out using the semi-empirical AM1 method [27]. In order to confirm the
267
correspondence between the obtained geometry and the minimum surface of the potential energy for
268
each conformer, the Hessian was calculated. The conformers with the lowest total energy were used
269
for 2D QSAR analysis.
270
4.2 2D QSAR
271
Using a random number generation triazines were divided into 2 samples: training set (80%)
272
and test set (20%). The requirements for the maximum and minimum values in the test sample were
273
as follows: 1) the maximum value of pIC50 should be less than or equal to the maximum value of
274
pIC50 in the training sample; 2) the minimum value of pIC50 must be greater than or equal to the
275
minimum value of pIC50 in the training sample.
276
The required linear regression equation should have the following form:
277
y = a1*x1+ … an*xn+ c
278
where y is the dependent variable (pIC50); a1 and an are regression coefficients; x1 and xn are
279
independent variables (descriptors); c is a regression constant.
280
We estimated the contribution of a descriptor to the model using following equation:
281
𝛼(𝑥 ) = 𝑅 (𝑥 , 𝑥 , 𝑥 ) − 𝑅 (𝑥 , 𝑥 )
3 × 𝑅 (𝑥 , 𝑥 , 𝑥 ) − 𝑅 (𝑥 , 𝑥 ) − 𝑅 (𝑥 , 𝑥 ) − 𝑅 (𝑥 , 𝑥 ) × 100%
282
where α(x1) - is the relative contribution of the descriptor x1 to the model with three
283
descriptors; 𝑅 (𝑥 , 𝑥 , 𝑥 ) is the determination coefficient of the model with all three
284
descriptors; 𝑅 (𝑥 , 𝑥 ) is the determination coefficient of the model with two descriptors: x2 and x3.
285
During the 2D QSAR analysis, different types of descriptors were used: constitutional (number
286
of hydrogen bond donors, number of hydrogen bond acceptors, number of rings, number of chains,
287
number of CH3 groups, number of OH groups, etc.), electrostatic descriptors (maximum positive
288
charge, maximum negative charge, the number of positively charged atoms, the number of negatively
289
charged atoms, etc.), topological descriptors (kappa-indices describing the shape of the molecule, the
290
indices of molecular bonds of Kier and Hall, etc.), 3D descriptors (volume, surface area, length and
291
area of the projection on the coordinate axis, etc.), physico-chemical (lipophilicity (LogP), molecular
292
refraction, polarizability, solubility in water, etc.), quantum-chemical descriptors (energy of frontier
293
molecular orbitals, electrostatic charges of atoms, the population of atoms according to Mulliken, etc.)
294
– a total of more than 3000 descriptors. The values of the descriptors were calculated using program
295
packages Spartan v. 16 and E-Dragon 1.0.
296
For QSAR model obtained the cross-validation was performed. Also, the models were tested
297
for their predictive power using an external test set of compounds. The following statistical indicators
298
were used:
• r2 - coefficient of determination for the training sample;
300
• the determination coefficient R2adj, corrected for the number of descriptors involved in the
301
model;
302
• q2 - r2 from the results of internal cross-validation of the training sample using the
leave-one-303
out (LOO) method;
304
• LOF - error of Friedman approximation (Friedman Lack of Fit);
305
• RMSE - root-mean-square error;
306
• Max Error - the maximum prediction error for all the compounds in the test and training set;
307
• pred_r2 - r2, which estimates the predictive ability of the model relative to the test set.
308
4.3 3D QSAR
309
4.3.1 Spatial alignment of molecules
310
Alignment of molecules plays a key role in 3D-QSAR. As a rule, the most energetically
311
favorable conformation of the most active compound or the geometry corresponding directly to the
312
interaction of the ligand and target (antibody), obtained on the basis of X-ray diffraction analysis or
313
docking data, is chosen as the template for the alignment [28]. In our case, the most active
314
conformation is unknown, and a number of the most active compounds (10, 14) have a large number
315
of conformers, which makes it difficult to analyze them correctly using quantum-chemical methods
316
of required accuracy. Compounds 5, 11 and 12 are also highly active, but with a small number of
317
conformers compared to other triazines in the sample. All conformers of compounds 5 (12
318
conformers), 11 (23 conformers) and 12 (12 conformers) were optimized using the Hartree-Fock
319
method and 6-31G(d) basis set (Figure 7). It was found that the most energetically favorable
320
conformers of these compounds are identical, and therefore it can be assumed that this particular
321
conformation is the most active and corresponds to the interaction with the antibody.
322
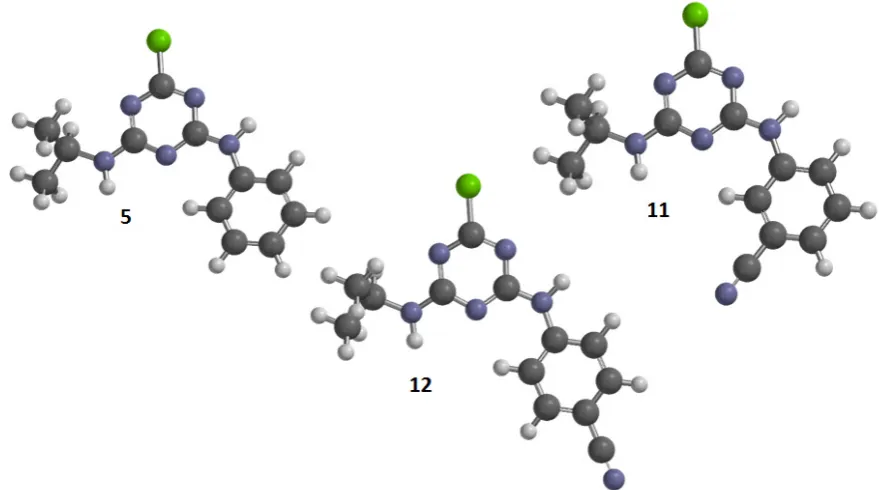
323
Figure 7. The most energetically favorable conformations of compounds 5, 11 and 12 according to the
324
calculation by HF/6-31G(d) method.
Triazine molecules in various conformations, optimized with AM1 method, were
326
superimposed on the template (compounds 5 and/or 11) using the algorithm presented in the
327
open3DALIGN program [29]. Conformations corresponding to the largest overlap with the atoms of
328
compounds 5 and 11 were selected (Figure 8).
329
330
331
Figure 8. Optimized with AM1 method triazine geometries (hydrogen atoms are represented only in
332
-OH groups).
The aligned geometries (Figure S1) were used to create and analyze the fields of molecular
334
interactions using the open3DQSAR program [30]. Visualization of 3D structures and contour maps
335
of the force fields was carried out in the PyMol program.
336
4.3.2 Building of molecular interaction fields (MIF)
337
Molecular interaction fields (MIF) were calculated to analyze the pIC50 values of triazines
338
and to create COMFA models for S2 and K4E7 systems.
339
Two potentials were used to create the fields of molecular interaction: the steric potential in
340
the form of the Lennard-Jones function 6-12 between the atoms of the molecule and the sp3 carbon
341
atom:
342
E = ∑ − ;
343
The electrostatic field was calculated by summing the Coulomb interactions between the test atom
344
with charge +1 and triazine molecules:
345
𝐸 = 𝑘 𝑞
𝑟
346
4.3.3 MIF preprocessing
347
The force field data was preliminarily processed to remove non-informative x variables:
348
1) equated to zero the values of the variables less than 0.05 kcal mol-1;
349
2) cut off values above 30 kcal mol-1 and below -30 kcal mol-1;
350
3) deleted x variables with a standard deviation value below <0.1;
351
4) removed variables that have 4 or less nonzero values within the sample.
352
4.3.4 Building of regression models
353
After all the preliminary operations were completed, we proceeded to construct the models
354
using Partial Least Squares (PLS) method [31], based on the NIPALS algorithm (Non-linear Iterative
355
PArtial Least Squares) [32]. The predictive power of the models was evaluated using “leave-one-out”
356
(LOO) cross-validation method:
357
𝑞 = 1 −∑(∑( )) ;
358
Also, we used “leave-many-out” cross-validation method: a sample of 20 compounds was
359
randomly broken into the training (75%) and test (25%) parts. The q2 parameter was calculated for
360
the test part. The partition procedure was repeated 50 times, and the average of the 50 partitioning
361
variants was given the value q2 (LMO).
362
To estimate the internal stability and predictive power of the 3D models, the standard
363
prediction error (SDEP) parameter was calculated:
364
𝑆𝐷𝐸𝑃 = ∑( ) ;
where 𝑦 is the experimental value; 𝑦 is the predicted value; 𝑦 – mean value; N is the
366
number of molecules in the sample.
367
Procedures for selecting variables and methods for creating clusters of variables with
368
common characteristics were used in order to increase the predictive ability of models:
369
− The SRD (Smart Region Definition) method[33] groups variables based on their localization in
370
three-dimensional space. This procedure reduces the number of descriptors bearing the same
371
information;
372
− Fractional Factorial Design (FFD)[34,35] allows the selection of variables that have the greatest
373
impact on the predictive ability of models. The FFD selection was conducted based on the
leave-374
many-out cross analysis, using the SRD of the variable group.
375
5. Conclusions
376
In this study we evaluated the efficiency of the interaction of 20 triazines with polyclonal and
377
monoclonal antibodies grown using atrazine as the immunizing hapten.
378
Comparison of the two immunoassay systems showed that the system with the polyclonal
379
antibodies (S2) is much easier to describe using 2D QSAR methodology, and the system with
380
monoclonal antibodies can be described using the 3D QSAR COMFA method. Thus, for the 3D QSAR
381
model of the S2 system, the main statistical parameter q2 (LMO) is equal 0.498, and for K4E7 q2 (LMO)
382
= 0.566. Apparently, this is explained by the fact that in the case of polyclonal antibodies, we deal
383
with several targets, while in interaction with monoclonal antibodies the target is one, and therefore
384
it is easier to describe it using specific fields of molecular interactions distributed in space.
385
There is an interesting fact that while for the S2 system the main contribution (72%) is made by
386
hydrophobic interactions (Table S3), for K4E7 the fraction of van der Waals and electrostatic
387
interactions is equal (Table S4).
388
Based on our analysis, we conclude that the effectiveness of the interaction with polyclonal
389
antibodies significantly depends on the presence of the isopropylamino group in the C6 position of
390
triazine, the presence of chlorine at the C2 position, and also the aniline radical in the C4 position,
391
which substituents, in turn, participate in electrostatic interactions and hydrogen bonding.
392
The obtained data as well as earlier published results of QSAR techniques application for
393
immune recognition demonstrate the efficiency of this technique in identification of key structures
394
responsible for distinguishing of structurally close antigens by antibodies. This information allows
395
theoretical formulation of criteria to molecules that could be recognized by the same antibodies (thus
396
extending selectivity of one immunoassay) or needs in different antibodies for detection (thus
397
realizing assays with mixtures or arrays of immunoreactants).
398
399
Supplementary Materials: The supplementary materials are available online.
400
Author Contributions: writing—original draft preparation, Andre A. Buglak; writing—review and editing,
401
Anatoly V. Zherdev and Hong-Tao Lei; supervision, Boris B. Dzantiev.
402
Funding: The work was financially supported by the Russian Science Foundation (Project No. 14-16-00149).
403
Conflicts of Interest: The authors declare no conflict of interest
References
406
1. Li, Y.; Sun, Y.; Beier, R.C.; Lei, H.; Gee, S.; Hammock, B.D.; Wang, H.; Wang, Z.; Sun, X.; Shen, Y.; Yang, J.;
407
Xu, Z. Trends Anal. Chem., 2017, 88: 25-40.
408
2. Bottoni, P.; Grenni, P.; Lucentini, L.; Barra Caracciolo, A. Microchem. J., 2013, 107: 136–142.
409
3. Cheney, M.A.; Y.Shin, J.; Crowley, D.E.; Alvey, S.; Malengreau, N.; Sposito, G. Colloids Surf. A, 1998, 137,
410
267-273.
411
4. Shin, J.Y.; Cheney, M.A. Environ Toxicol Chem.2005, 24, 1353-1360.
412
5. Tian, Y.; Shen, W.; Jia, F.; Ai, Z.; Zhang, L. Chem. Eng. J., 2017, 330, 1075-1081.
413
6. Rowe, A.M.; Brundage, K.M.; Barnett, J.B. Basic Clin. Pharmacol. Toxicol., 2008, 102, 139-145.
414
7. Agopian, A.J.; Langlois, P.H.; Cai, Y.; Canfield, M.A.; Lupo, P.J. Matern. Child. Health J., 2013, 17, 1768-1775.
415
8. Xu, Z.L.; Shen, Y.D.; Zheng, W.X.; Beier, R.C.; Xie, G.M.; Dong, J.X.; Yang, J.Y.; Wang, H.; Lei, H.T.; She,
416
Z.G.; Sun, Y.M. Anal. Chem., 2010, 82, 9314-9321.
417
9. Yuan, M.; Na, Y.; Li, L.; Liu, B.; Sheng, W.; Lu, X.; Kennedy, I.; Crossan, A.; Wang, S. J. Agric. Food. Chem.,
418
2012, 60, 10486-10493.
419
10. Liu, C.; Dou, X.; Zhang, L.; Kong, W.; Wu, L.; Duan, Y.; Yang, M. Anal. Chim. Acta., 2018, 1012, 90-99.
420
11. Bitencourt, M.; Freitas, M.P. Pest Manag. Sci., 2008, 64, 800-807.
421
12. Zuo, Y.; Wu, Q.; Su, S.W.; Niu, C.W.; Xi, Z.; Yang, G.F. J. Agric. Food Chem., 2016, 64, 552-562.
422
13. Funar-Timofei, S.; Borota, A.; Crisan, L. Mol. Divers., 2017, 21, 437-454.
423
14. Xie, Y.; Peng, W.; Ding, F.; Liu, S.J.; Ma, H.J.; Liu, C.L. Pest Manag. Sci., 2018, 74, 189-199.
424
15. Wang, Z.; Zhu, Y.; Ding, S.; He, F.; Beier, R.C.; Li, J.; Jiang, H.; Feng, C.; Wan, Y.; Zhang, S.; Kai, Z.; Yang,
425
X.; Shen, J. Anal. Chem., 2007, 79, 4471-4483.
426
16. Mu, H.; Wang, B.; Xu, Z.; Sun, Y.; Huang, X.; Shen, Y.; Eremin, S.A.; Zherdev, A.V.; Dzantiev, B.B.; Lei, H.
427
Analyst, 2015, 140, 1037-1045.
428
17. Chen, J.; Lu, N.; Shen, X.; Tang, Q.; Zhang, C.; Xu, J.; Sun, Y.; Huang, X.A.; Xu, Z.; Lei, H. J. Agric. Food
429
Chem., 2016, 64, 2772-2779.
430
18. Chen, J.; Wang, L.; Lu, L.; Shen, X.; Huang, X.A.; Liu, Y.; Sun, X.; Wang, Z.; Eremin, S.A.; Sun, Y.; Xu, Z.;
431
Lei, H. Anal. Chem., 2017, 89, 6740-6748.
432
19. Mu, H.; Xu, Z.; Liu, Y.; Sun, Y.; Wang, B.; Sun, X.; Wang, Z.; Eremin, S.; Zherdev, A.V.; Dzantiev, B.B.; Lei,
433
H. Spectrochim. Acta A Mol. Biomol. Spectrosc., 2018, 194, 83-91.
434
20. Xu ZL, Xie GM, Li YX, Wang BF, Beier RC, Lei HT, Wang H, Shen YD, Sun YM. Anal. Chim. Acta, 2009, 647,
435
90-96.
436
21. Xu, Z.L.; Shen, Y.D.; Zheng, W.X.; Beier, R.C.; Xie, G.M.; Dong, J.X.; Yang, J.Y.; Wang, H.; Lei, H.T.; She,
437
Z.G.; Sun, Y.M. Anal. Chem., 2010, 82, 9314-9321.
438
22. Yuan, M.; Liu, B.; Liu, E.; Sheng, W.; Zhang, Y.; Crossan, A.; Kennedy, I.; Wang, S. Anal. Chem., 2011, 83,
439
4767-4774.
440
23. Wang, Z.; Kai, Z.; Beier, R.C.; Shen, J.; Yang, X. Int. J. Mol. Sci., 2012, 13, 6334-6351.
441
24. Dankwardt, A.; Hock, B.; Simon, R.; Freitag, D.; Kettrup, A. Environ. Sci. Technol., 1996, 30, 3493–3500.
442
25. Hall, L.H.; Mohney, B.; Kier, L.B. J. Chem. Inf. Comput. Sci., 1991, 31, 76-82.
443
26. Halgren, T.A. J. Comp. Chem., 1996, 17, 490–519.
444
27. Dewar, M.J.S.; Zoebisch, E.G.; Healy, E.F.; Stewart, J.J.P. J. Am. Chem. Soc., 1985, 107, 3902-3909.
445
28. Sliwoski, G.; Kothiwale, S.; Meiler, J.; Lowe, E.W. Jr. Pharmacol. Rev., 2013, 66, 334-395.
446
29. Tosco, P.; Balle, T.; Shiri, F.J. Comput. Aided Mol. Des., 2011, 25, 777-783.
447
30. Tosco, P.; Balle, T. J. Mol. Model., 2011, 17, 201-208.
31. Stahle, L.; Wold, S. J. Chemom., 1987, 1, 185-196.
449
32. Wold, S.; Sjöström, M.; Eriksson, L. ChemometricsIntell. Lab. Syst., 2001, 58, 109-130.
450
33. Pastor, M.; Cruciani, G.; Clementi, S. J. Med. Chem., 1997, 40, 1455-1464.
451
34. Baroni, M.; Clementi, S.; Cruciani, G.; Costantino, G.; Riganelli, D.J. Chemometr., 1992, 6, 347-356
452
35. Baroni, M.; Costantino, G.; Cruciani, G.; Riganelli, D.; Valigi, R.; Clementi, S. Quant. Struct-Act. Relat., 1993,
453
12, 9-20.
454
455
Sample Availability: Samples of the compounds listed in the main text of the manuscript are available from the
456
authors.