warwick.ac.uk/lib-publications
Original citation:
Kang, Lei, Feeney, Andrew, Su, Riliang, Lines, David, Jäger, Axel, Wang, Han, Arnaudov, Yavor
Emilov, Ramadas, Sivaram Nishal , Kupnik, Mario and Dixon, Steve M. (2017)
Two-dimensional flexural ultrasonic phased array for flow measurement. In: 2017 IEEE
International Ultrasonics Symposium (IUS), Washington, DC, USA, 6-9 Sep 2017. Published
in: 2017 IEEE International : Ultrasonics Symposium (IUS) ISSN 1948-5727.
doi:10.1109/ULTSYM.2017.8092220
Permanent WRAP URL:
http://wrap.warwick.ac.uk/99206
Copyright and reuse:
The Warwick Research Archive Portal (WRAP) makes this work by researchers of the
University of Warwick available open access under the following conditions. Copyright ©
and all moral rights to the version of the paper presented here belong to the individual
author(s) and/or other copyright owners. To the extent reasonable and practicable the
material made available in WRAP has been checked for eligibility before being made
available.
Copies of full items can be used for personal research or study, educational, or not-for profit
purposes without prior permission or charge. Provided that the authors, title and full
bibliographic details are credited, a hyperlink and/or URL is given for the original metadata
page and the content is not changed in any way.
Publisher’s statement:
“© 2017 IEEE. Personal use of this material is permitted. Permission from IEEE must be
obtained for all other uses, in any current or future media, including reprinting
/republishing this material for advertising or promotional purposes, creating new collective
works, for resale or redistribution to servers or lists, or reuse of any copyrighted component
of this work in other works.”
A note on versions:
The version presented here may differ from the published version or, version of record, if
you wish to cite this item you are advised to consult the publisher’s version. Please see the
‘permanent WRAP URL’ above for details on accessing the published version and note that
access may require a subscription.
Two-Dimensional Flexural Ultrasonic Phased
Array for Flow Measurement
Lei Kang
1, Andrew Feeney
1, Riliang Su
2, David Lines
2, Axel Jäger
3,
Han Wang
3, Yavor Arnaudov
1, Sivaram Nishal Ramadas
4, Mario Kupnik
3, Steve Dixon
11University of Warwick, United Kingdom
2Diagnostic Sonar Limited, United Kingdom
3Technische Universität Darmstadt, Germany
4Honeywell, United Kingdom
Email: [email protected]; [email protected]
Abstract– The arrival time detection probability and the measurement range of transit-time ultrasonic flow meters are undermined by the sound drift effect. One solution to this problem is utilizing a phased-array beam steering technique to compensate the bend of the ultrasonic beams. The design, the fabrication and the characterization of two-dimensional flexural ultrasonic phased arrays is investigated in this paper. A meter body with an inner diameter of 146 mm is machined to accommodate the arrays, and flow tests are carried out at different flow rates ranging from 0 to 2500 m3/h. Experimental results indicate that,
with the increase of flow rate, the optimum steering angle of
arrays increases from 30˚ to 40.5˚ when ultrasonic beams travel upstream and decreases from 30˚ to 22.5˚ when
ultrasonic beams travel downstream. This proof-of-concept design demonstrates the potential of the flexural ultrasonic phased array as an accurate, economic, efficient, and robust solution for gas flow measurement.
Keywords — flexural ultrasonic transducer, phased array, flow measurement, transit-time flow meter.
I. INTRODUCTION
Transit-time ultrasonic flow meters, measuring the time difference between upstream and downstream propagation of ultrasonic beams, have been widely utilized to obtain the average velocity of flow in many applications including natural gas flow rate measurement. The signal-to-noise ratio (SNR) of the ultrasonic signals frequently suffers from the sound drift effect, and thus, the detection probability of the time of arrival
(ToA) and the range of the measurement are reduced [1].
Moreover, installation-induced errors of the transducers further degrade the measurement accuracy.
One possible solution to these problems is to use phased arrays instead of single transducers in the flow measurement. With a phased array, the bend of ultrasonic beams can be electronically and dynamically compensated using beam steering technique, and thus, the optimum SNR and a broader range of measurement can be achieved. In addition, multiple ultrasonic paths can be realized with an array so that the measurement accuracy can be further improved.
Flexural ultrasonic transducers, using bending modes of an elastic plate, can generate and receive ultrasound in low acoustic impedance fluids like air and water with high transduction efficiency, robustness and low cost. Combining flexural ultrasonic transducers with phased array technology, flexural ultrasonic phased arrays are a potentially economic, low-power and robust solution for flow measurement. This paper investigates the design, the fabrication and the characterization of two-dimensional flexural ultrasonic phased arrays, and studies their performance in flow tests.
II. DESIGN AND FABRICATION OF FLEXURAL ULTRASONIC
PHASED ARRAYS
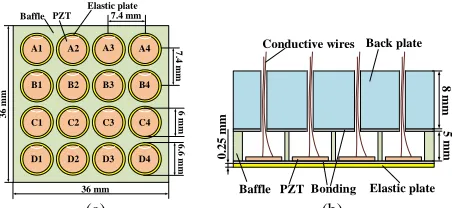
The structure of a two-dimensional flexural ultrasonic phased array is shown in figure 1[2]. The array consists of a 36×36×0.25 mm3elastic titanium plate, 16 piezoelectric ceramic discs, each with a diameter of 6 mm and a thickness of 0.25 mm, a steel baffle with 16 holes in a 4×4 configuration, and a 36×36×8 mm3 steel backplate. The baffle is bonded to the titanium plate, and the holes with a diameter of 6.6 mm and a pitch of 7.4 mm define the boundary conditions of the individual array elements. The piezoelectric discs are bonded to the 4×4 flexural elements, and conductive wires are soldered to the leads of the array (not shown in figure 1) via the holes in the backplate. The backplate is bonded to the baffle with adhesive to form an enclosed cavity to protect the piezoelectric discs and conductive wires and
enhance the arrays’ immunity to the surrounding
electromagnetic interference. Moreover, with a backplate, the vibration performance of the array elements, in terms of amplitude, mode purity and mechanical crosstalk, can be significantly improved, which is discussed later.
6 mm PZT Baffle
Elastic plate
A1 A2 A3 A4
B1 B2 B3 B4
C1 C2 C3 C4
D1 D2 D3 D4
7
.4
m
m
7.4 mm
6
.6
m
m
6
m
m
3
6
m
m
36 mm Baffle PZT Bonding Elastic plate
Back plate Conductive wires
8
m
m
5
m
m
0
.2
5
m
m
[image:3.595.332.534.52.133.2](a) (b)
Fig. 1. Schematic diagram of a 4×4 flexural ultrasonic phased array prototype. Top view (the back plate is hidden for clarity) of array (a), and the cross-section view of the array (b).
Ten arrays have been assembled in the form shown in figure 1. All parts of the arrays are bonded by a two-component epoxy (Araldite 2014). To ensure the bonding quality and the consistency of array elements, a pressure jig has been designed, which is illustrated in figure 2. The membrane (elastic plate) is temporarily fixed to the rigid flat platform A using glue, and the two-component epoxy is evenly spread onto the membrane with K hand coater (RK PrintCoat Instruments Ltd.). The baffle is placed onto the membrane and fixed by the primary and the secondary baffle holders. PZT discs are placed into the 16 holes of the baffle on the membrane and compressed by 16 rigid pillars (not shown in figure 2) each of which is a flat surface at one end in contact with the discs and a spring to allow gradual pressure adjustment, by the control of the distance between platforms A and B. The position of the baffle, the membrane and the PZT discs are fixed by the baffle holders, the pillars and the PZT and pillar holder. The PZT and pillar holder and the two platforms are made of stainless steel machined by computer numerical control (CNC) milling machines, and the primary and the secondary baffle holders are made by a 3D printer. The distance between platforms A and B is adjusted by four pairs of bolts and nuts. Constant pressure is applied between the platforms during the curing process of the epoxy, and a torque wrench is utilized to tighten the bolts diagonally so that the pressure is uniformly and consistently distributed. After bonding the baffle and the PZT discs to the membrane, conductive wires are soldered to the electrodes of the discs, and the backplate is bonded to the baffle. Assembled arrays are shown in figure 3, where figure 3(a) shows a partly assembled array with baffle, membrane, PZT discs and conductive wires, and figure 3 (b) shows two fabricated arrays in 3D-printed housings.
(a) (b)
Fig. 2. Pressure jig for fabrication of flexural ultrasonic phased arrays, showing exploded view (a), and pressure jig tightened by bolts and nuts (b).
[image:3.595.39.265.55.159.2](a) (b)
Fig. 3. Assembled flexural ultrasonic phased arrays, showing a partly assembled array (a), and two fully assembled arrays (b).
III. CHARACTERIZATION OF FLEXURAL ULTRASONIC PHASED
ARRAYS
[image:3.595.312.555.529.610.2]The electrical impedance of array elements is measured by an impedance analyser (Agilent 4294A). Figure 4 (a) shows typical impedance and phase spectra as functions of frequency of an array element before the backplate is bonded to the baffle, whilst figure 4 (b) shows these plots after the backplate is bonded. We observe that the centre frequency of the array element exhibits a minor change, from 48.23 kHz to 48.46 kHz, when the backplate is introduced. However, the mode purity and the transduction efficiency of the array element have both been significantly improved. This is most likely because the baffle alone is not sufficient to provide an ideal clamped-edge boundary condition for an array element, and several vibration modes coexist at the same time. Finite element simulation analysis, based on a 3D axisymmetric model[2], indicates that the vibration of the array element also induces vibration in the baffle, and causes a series of additional vibration modes near the centre frequency. However, when a heavy and rigid backplate is applied, the vibration in the baffle is greatly suppressed, and the energy of the additional vibration modes is shifted to the fundamental (0,0) mode, resulting in a higher transduction efficiency. Moreover, as the vibration in the baffle is largely damped, the vibration energy penetrating through the walls of the baffle to the neighbouring elements is also significantly suppressed, which leads to a reduction of mechanical cross talk between array elements. Centre frequencies of array elements of a typical array are shown in table 1, where the frequencies range from approximately 47 kHz to 50 kHz, with a typical -6 dB bandwidth of 1.5 kHz.
Frequency (kHz)
10 20 40 60 80 100
1 10
-50
-90
Im
p
e
d
a
n
c
e
(k
Ω
)
P
h
a
se
(
o)
Frequency (kHz) 10 20 40 60 80 100 1
10
-50
-90
Im
p
ed
a
n
ce
(k
Ω
)
P
h
a
se
(
o)
0
[image:3.595.38.289.591.668.2](a) (b)
Fig. 4. Impedance and phase spectra as functions of frequency without backplate (a), and with backplate (b).
array elements. The mode shapes of array elements shown in figure 5 (a) indicates that the array elements vibrate in the (0,0) mode, and no obvious debonding or weak bonding between the baffle and the backplate is observed. This suggests that an excellent bond quality has been achieved during the fabrication process. The amplitude distribution of the array for only one element being driven is shown in figure 5 (b), showing that the amplitude of the passive elements is lower than 12% of the amplitude of the active element, demonstrating the crosstalk between neighbouring elements will not severely affect the performance of the array.
Table 1: Centre frequency of elements of a typical array measured by impedance analysis (unit: kHz)
Column 1 Column 2 Column 3 Column 4
Row A 50.44 49.53 49.71 49.90
Row B 49.00 49.88 50.08 49.18
Row C 48.64 48.46 49.14 48.28
Row D 47.03 47.37 47.47 47.29
1
0 Amplitude (normalized)
(a) (b)
Fig. 5. Phased array normalized vibration amplitude distribution, for all array elements driven simultaneously (a), and one element driven only (b).
IV. EXPERIMENTS
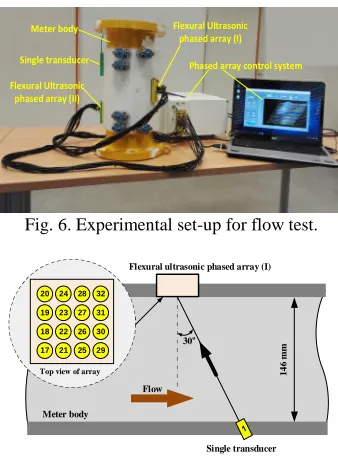
To study the performance of the flexural ultrasonic phased arrays, a nylon meter body is fabricated to accommodate the
arrays with a commercial single ultrasonic transducer
(PROWAVE 500MB120) included, as shown in figure 6. The inner diameter of the meter body is 146 mm, and there is a flange at each end of the meter body for the connection with flow loops. Three 60 mm × 60 mm ports are machined in the meter body, and adapters are designed to ensure the single
transducer faces array (I) at a 30˚ angle, as shown in figure 7.
Another array, array (II) in figure 6, is also included in the meter body to perform measurement through reflected ultrasonic paths, which is not presented here. A 32-channel phased array control system (FIToolbox, Diagnostic Sonar, Livingston, United Kingdom) is used to control the arrays and the single transducer and acquire ultrasonic data. Channel 1 connects with the single transducer, channels 2 to 16 connect with array (II) and channels 17 to 32 connect with array (I). Each channel can operate in both transmitting mode and receiving mode.
Flow experiments have been conducted with a commercial flow rig at Honeywell Process Solutions, Mainz, Germany. The rig comprises a compressor (HVM 80-125 GR, Venti Oelde, Oelde, Germany) as a flow source and a calibrated mechanical flow meter (TRZ G1600 DN200, Elster Instromet, Mainz,
Germany) as a reference meter. All experiments are conducted at constant room temperature in an open flow loop using air as the flowing medium. To efficiently acquire ultrasonic data, the full raw data (FRD) technique is utilized in the experiments. With this technique, each channel operates in a transmitting mode in turn, and meanwhile, all channels operate in a receiving mode so that the acquisition of data of all possible ultrasonic paths can be achieved.
Single transducer
Flexural Ultrasonic phased array (I)
Flexural Ultrasonic phased array (II)
Phased array control system Meter body
Fig. 6. Experimental set-up for flow test.
30o
Single transducer
20
19
18
17 24
23
22
21 28
27
26
25 32
31
30
29
Top view of array 14
6
m
m
Flexural ultrasonic phased array (I)
Meter body
Flow
Fig. 7. Cross-section view of meter body.
Ultrasonic signals are recorded at different flow rates ranging from 0 to 2500 m3/h with a step of 100 m3/h. Typical variations of amplitude of ultrasonic signal of two ultrasonic paths with the increase of flow rates are shown in figure 8, where Tx1 indicates that channel 1 is operating in the transmitting mode and Rx 27 denotes that channel 27 is operating in the receiving mode, and thus Tx1-Rx27 represents the ultrasound beam travelling downstream. Note that the main lobe of the single transducer (channel 1) faces to the centre of the array, the array element connected with channel 27 is near the centre of the array whereas the array element connected with channel 18 is further away from the centre. Thus, the amplitude of the signal increases with the increase of the flow rates when the ultrasonic beam travels from channel 18 to channel 1 and the amplitude decreases for the other three cases, primarily due to the sound drift effect. For a pair of single transducers used in the conventional transit-time flow measurement, the decrease of amplitude of signals due to the sound drift effect significantly limits the accuracy and the range of the measurement. With a phased array transducer, time delays can be applied to different channels either in the transmitting process or in the receiving (including post-processing) process, so that all received signals from different paths can be superposed in phase and thus sufficient signal-to-noise ratio is achieved at high flow rates.
[image:4.595.48.278.208.395.2]variation of time of arrivals of signals when ultrasonic beams travel upstream is shown in figure 9 (a), where channel 1 operates in the transmitting mode and channels 17 to 32 operate in the receiving mode. The ToAs of the signals when the ultrasonic beams travel downstream are shown in figure 9 (b), where channel 1 operates in the receiving mode and channels 17 to 32 operate in the transmitting mode. As expected, ToAs increase with the increase of flow rate when the ultrasound
beams travel upstream and decrease when travelling
downstream.
[image:5.595.354.513.110.217.2](a) (b)
Fig. 8. Variations of signal amplitude with the increase of flow rate for ultrasonic beams travelling upstream and downstream along two typical paths, showing the ultrasonic path between channel 1 and channel 27 (a), and between channel 1 and channel 18 (b).
0 500 1000 1500 2000 2500
Flow rates (m3/h)
470 480 490 500 510 520 530 540 550 560 T o A s o f u lt ra so n ic si g n a l (µ s)
Tx1 - Rx (17~20)
Tx1 - Rx (21~24)
Tx1 - Rx (25~28) Tx1 - Rx (29~32)
0 500 1000 1500 2000 2500
Flow rates (m3/h)
450 460 470 480 490 500 510 520 T o A s o f u lt ra so n ic si g n a l (µ s)
Tx1 - Rx (17~20)
Tx1 - Rx (21~24) Rx1 - Tx (17~20)
Rx1 - Tx (21~24)
Rx1 - Tx (25~28)
Rx1 - Tx (29~32)
(a) (b)
Fig. 9. Variation of the ToAs of ultrasonic signals with the increase of flow rate, for ultrasonic beams travelling upstream (a), and travelling downstream (b).
The difference of the ToAs of signals between neighbouring columns of array elements becomes greater with the increase of flow rate when ultrasonic beams travel upstream and becomes smaller when travelling downstream. The difference of the ToAs corresponds to the optimum steering angle of the array
operating in a beam steering mode. Assumingdis the pitch of
the array element,cis the sound velocity,α is the steering angle
and Δt is the difference of ToAs of signals between
neighbouring array elements, the steering angle is given by:
α = arcsin (c× Δt /d) (1)
The variation of the optimum steering angle with the increase of flow rates is then calculated based on equation (1), as shown in figure 10. It can be demonstrated that when ultrasonic beams
travel upstream, the optimum steering angle increases from 30˚ at no flow to approximately 40.5˚ at 2500 m3/h. When ultrasonic beams travel downstream, the optimum steering
angle decreases from 30˚ to approximately 22.5˚ with the
increase of flow rate. The variation of the optimum steering angle shown in figure 10 suggests what steering angle should be chosen for the array to obtain the ultrasonic signals with optimal SNR, and also establishes a link between the flow rate
and the steering angles so that the actual flow rate can be estimated based on a given optimum steering angle, which is in practice commonly measured by continuously sweeping the angle until the optimal SNR is achieved.
40 38 36 34 32 30 28 26 24 22
0 500 1000 1500 2000 2500 Flow rates (m3/h)
[image:5.595.35.285.181.270.2]S te e ri n g a n g le ( o)
Fig. 10. Variation of optimum steering angles with the increase of flow rate.
V. CONCLUSIONS
The design, the fabrication and the characterization of two-dimensional flexural ultrasonic phased arrays for flow measurement are presented in this paper. The arrays consist of a titanium plate, a steel baffle, a steel backplate and PZT discs. The backplate both enhances mechanical robustness of the arrays, and also effectively improves the performance of the arrays in terms of their transduction efficiency, mode purity and mechanical crosstalk. A meter body with an inner diameter of 146 mm is machined to accommodate the arrays. Flow tests are performed at different flow rates increasing from 0 to 2500 m3/h, and suggests that the optimum steering angle of the arrays
increases from 30˚ to 40.5˚ when ultrasonic beams travel upstream and decreases from 30˚ to 22.5˚ when ultrasonic
beams travel downstream. By electronically adjusting the steering angle, the signal-to-noise ratio of ultrasonic signals can
be effectively improved. This proof-of-concept design
demonstrates the potential of flexural ultrasonic phased array as an economic, efficient, and robust solution for gas flow measurement. Future research will focus on the measurement of flow rates with multiple ultrasonic beam paths, with systems based on two-dimensional arrays, to further improve the accuracy of flow measurement.
ACKNOWLEDGMENT
The authors would like to acknowledge the European Union’s SACUT project (Ref. No. 612118) under the Marie Curie Industry-Academia Pathways & Partnership (IAPP) action, for funding the research.
REFERENCES
[1] M. Kupnik, A. Schroder, M. Groschl. “Adaptive asymmetric double-path ultrasonic transit-time gas flowmeter”, 2006 IEEE Ultrasonics Symposium, Vancouver, BC, pp. 2429-2432, 2006.
[2] L. Kang, T. Eriksson, S.N. Ramadas, et al. “Design of flexural ultrasonic phased array for fluid-coupled applications”, 2016 IEEE Ultrasonics Symposium, Tours, France, pp. 1-4, 2016.
[image:5.595.37.286.328.408.2]