Eye and Brain
Dove
press
R E V I E W
open access to scientific and medical research
Open Access Full Text Article
Retinal, visual, and refractive development
in retinopathy of prematurity
Anne Moskowitz
Ronald M Hansen
Anne B Fulton
Department of Ophthalmology, Boston Children’s Hospital and Harvard Medical School, Boston, MA, USA
Correspondence: Anne Moskowitz Department of Ophthalmology, Boston Children’s Hospital, 300 Longwood Avenue, Boston, MA 02115, USA Tel +1 617 355 5122
Fax +1 617 507 7999
Email anne.moskowitz@childrens. harvard.edu
Abstract: The pivotal role of the neurosensory retina in retinopathy of prematurity (ROP) disease processes has been amply demonstrated in rat models. We have hypothesized that analogous cellular processes are operative in human ROP and have evaluated these presumptions in a series on non-invasive investigations of the photoreceptor and post-receptor peripheral and central retina in infants and children. Key results are slowed kinetics of phototransduction and deficits in photoreceptor sensitivity that persist years after ROP has completely resolved based on clinical criteria. On the other hand, deficits in post-receptor sensitivity are present in infancy regardless of the severity of the ROP but are not present in older children if the ROP was so mild that it never required treatment and resolved without a clinical trace. Accompanying the persistent deficits in photoreceptor sensitivity, there is increased receptive field size and thick-ening of the post-receptor retinal laminae in the peripheral retina of ROP subjects. In the late maturing central retina, which mediates visual acuity, attenuation of multifocal electroretinogram activity in the post-receptor retina led us to the discovery of a shallow foveal pit and significant thickening of the post-receptor retinal laminae in the macular region; this is most likely due to failure of the normal centrifugal movement of the post-receptor cells during foveal development. As for refractive development, myopia, at times high, is more common in ROP subjects than in control subjects, in accord with refractive findings in other populations of former preterms. This information about the neurosensory retina enhances understanding of vision in patients with a history of ROP, and taken as a whole, raises the possibility that the neurosensory retina is a target for therapeutic intervention.
Keywords: electroretinogram, psychophysics, retinal imaging, photoreceptors, neural retina, refraction
Introduction
Retinopathy of prematurity (ROP) is among the common retinal neovascular conditions
that include diabetic retinopathy, age-related macular degeneration, and central vein
occlusion.
1ROP is distinguished from these conditions because it occurs in immature
retina. Although the disease is mild and resolves spontaneously in the majority of cases,
ROP remains a leading cause of avoidable blindness worldwide.
2,3ROP has its onset at preterm ages
4when the retinal vasculature
5–8and the
neuro-sensory retina
9are immature (Figure 1). The rod photoreceptors, which are
∼
20 times
more numerous than the cones, are the last retinal cells to mature, with the exception
of the relatively small number of foveal cones.
10,11Even the small vessels in the
inter-plexiform layers normally mature earlier than the rods.
6As shown in Figure 1, the onset of ROP
4is coincident with the rapid increase
in the rhodopsin content of the developing retina. ROP resolves in early post-term
Eye and Brain downloaded from https://www.dovepress.com/ by 118.70.13.36 on 22-Aug-2020
For personal use only.
Number of times this article has been viewed
This article was published in the following Dove Press journal: Eye and Brain
Dovepress
Moskowitz et al
weeks
12,13when rod outer segment development tails off.
Thus, although we are all well aware that the accepted clinical
hallmark of ROP is abnormal retinal vasculature, we
can-not ignore the involvement of the neural retina in the ROP
disease process and the burgeoning metabolic demands of
the rapidly developing rods.
We have found evidence that the neurosensory retina is
very much involved in the ROP disease process by studying
children and rat models of ROP. The escalating metabolic
needs of the oxygen-greedy rods are poised to be an
insti-gating factor for ROP. In rat models, rod photoreceptor
dys-function is detectable before retinal vascular abnormalities
manifest.
14Our longitudinal study of rat models shows that
early rod dysfunction predicts the vascular outcome, and not
vice versa.
15–18We have shown that 1) recovery of the ROP
rat’s post-receptor retinal sensitivity and retinal vasculature
is under the cooperative control of growth factors, which in
other neural tissues mediate neural–vascular crosstalk
19and
2) pharmacological lessening of the developing rod’s
meta-bolic needs improves the vascular outcome.
20In children,
there are significant effects on retinal and visual function
and eye growth long after the clinical resolution of ROP;
key results are presented below. In short, rods are involved
before, during, and after active ROP.
The subjects in our studies met the criteria for ROP
screening
21and underwent serial examinations in the neonatal
intensive care unit, the frequency of which was based on
the program of examinations in the multicenter ROP trials
(CRYO-ROP and ETROP).
22,23We categorized the subjects
as having had severe ROP, mild ROP, or no ROP, as shown
in Table 1. This categorization was based on the International
Committee for the Classification of Retinopathy of
Prema-turity (ICROP) system
24whereby the site of the disease is
specified by zone (I–III from central to peripheral), the extent
within the zone by number of affected clock hours (1–12),
and disease severity by stage (1–5 from mild to complete
retinal detachment).
Through a series of non-invasive studies of the
neuro-sensory retina in human ROP subjects, we have found
per-sistent effects on rod photoreceptor function and evidence
of intralaminar re-organization of post-receptor retina.
These studies have employed electroretinogram (ERG),
25psychophysical,
26,27and retinal imaging procedures.
28,29We
have also found significant departures from normal in eye
growth
30and refractive development.
31,32Peripheral retina in ROP
In our ERG studies, we recorded and analyzed rod
photore-ceptor activity represented in the a-wave and the rod-driven
post-receptor activity represented in the b-wave (Figure 2)
using procedures described previously.
33–36In infants with
a history of ROP (median age 10 weeks post-term), both
rod and rod-driven post-receptor sensitivity were low.
25In
children (median age 10 years), post-receptor sensitivity
normalizes but the deficits in rod photoreceptor sensitivity
persist even if the ROP had been mild.
25These ERG data are
evidence that after clinical healing (judged by inspection of
the retinal vasculature), the post-receptor neural circuitry
undergoes intralaminar reorganization.
37–42This is
accom-panied by effects on rod-mediated visual sensitivity that are
demonstrated by our psychophysical studies.
26,27We tested rod-mediated vision to evaluate spatial and
temporal summation in older children with a history of ROP
and in control subjects.
26,27The underlying concept of spatial
0
−20 Term
Age (weeks)20 40 60
0 50 100
50
Percent adult rhodopsin content
Percent coverage of retinal surfac
e
100
Vessels
Rhodopsin
ROP onset
Figure 1 The developmental increase in rhodopsin content of the retina and temporal retinal coverage by large vessels.
Notes: As rod photoreceptor development proceeds, the rod outer segments elongate and rhodopsin content increases. These measures of rhodopsin extracted from whole retinae are companions for the full-field electroretinography that is used to evaluate rod activity. The red arrow indicates the onset of prethreshold ROP as described by Palmer et al.4 Copyright © 1999. Association for Research in Vision and
Ophthalmology. Adapted from Fulton AB, Dodge J, Hansen RM, Williams TP. The rhodopsin content of human eyes. Invest Ophthalmol Vis Sci. 1999;40(8):1878–1883.74
Data for vessel coverage values from Provis JM. Development of the primate retinal vasculature. Prog Retin Eye Res. 2001;20:799–821.6
Abbreviation: ROP, retinopathy of prematurity.
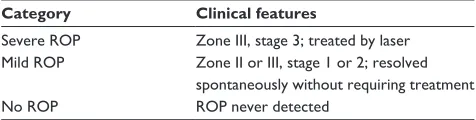
Table 1 Classification of subjects in our ROP studies
Category Clinical features
Severe ROP Zone III, stage 3; treated by laser Mild ROP Zone II or III, stage 1 or 2; resolved
spontaneously without requiring treatment
No ROP ROP never detected
Abbreviation: ROP, retinopathy of prematurity.
Eye and Brain downloaded from https://www.dovepress.com/ by 118.70.13.36 on 22-Aug-2020
Dovepress Visual development in ROP
−1.5
−400
0 10 20
ms ms
ms
30 40 0 10 20 30 40 −2 1 2 3
0 2
−200
µ
V
Log b-wave amplitude
(
µ
V)
0 200
SROD =3.5 isoms−ts−t
Infant
Infant
Log σ
Vmax Adult
Adult RROD =167 µV
td =3.2 ms
S =11.22 isoms−ts−t
RROD =462 µV
td =3.2 ms −1.2
−0.6 0 +0.6 +1.2
Log (scot td s)
Log (scot td s)
+1.8 +2.4 +3.0 +3.6
A
B C
Mild ROP
a-wave parameters b-wave parameters
10-week old infants Adult
Term-born
0 40 80 120 160 0 40 100 µVolts
200 µVolts
80 120 160 0 40 80 120
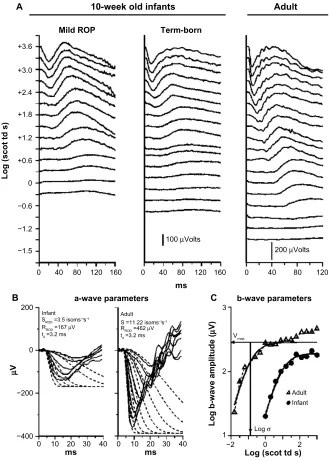
Figure 2 Sample rod-mediated ERG responses to full-field stimuli.
Notes: (A) Responses from an infant with a history of mild ROP and a healthy term-born 10-week-old infant, both tested at 10 weeks post-term, and from an adult. For all three sets of records, the vertical axis indicates the strength of the stimulus flash in log scotopic trolands and the horizontal axis indicates time in milliseconds. For both infant and adult, the amplitude of the response increases with increasing stimulus strength. At lower intensities, b-waves, but no a-waves, are seen. At higher strengths, the downward going a-wave appears. In these test conditions, the a-wave represents the molecular events involved in the activation of phototransduction in the rod outer segments. The b-wave represents post-receptor activity, including that in the rod-driven bipolar cells. (B) A-wave model fits. An expanded view of the a-waves of term-born infant and adult subject is shown. The solid lines are the ERG traces. The dashed lines show the fit of the mathematical Lamb and Pugh model of rod phototransduction, as modified by Hood and Birch, to the a-waves.75–77 The model parameters obtained by this calculation are shown on each panel. Rod sensitivity, S
ROD, is lower in the infant than in the adult. In the
normally developing eye, SROD is scaled by the rhodopsin content of the retina. (C) Log–log plot of b-wave stimulus/response functions of term-born infant (circles) and adult
(triangles). The b-wave amplitude is shown as a function of stimulus strength. The smooth curve fit to the data of each subject represents the function V/VMAX= I/(I+σ).78 The
saturated amplitude, VMAX, and the stimulus (I) that produces a half maximum amplitude response, log σ, are indicated for the adult subject. Log σ is an index of rod-mediated
post-receptor retinal sensitivity.
Abbreviations: ERG, electroretinogram; ROP, retinopathy of prematurity.
summation is that a large number of rods in a given retinal
region connect to a neuron; the receptive field is the restricted
post-receptor region onto which this group of photoreceptors
converge. In our spatial summation test,
27the diameter of
a test spot was varied; the dark adapted threshold for the
detection of the test spot was measured for eight different spot
diameters, ranging from 0.4
°
(tiny) to 10
°
(big – about the
diameter of a soft ball at arm’s length). The results (Figure 3)
show that the critical diameter is larger in subjects with
a history of ROP than in preterm subjects who never had
Eye and Brain downloaded from https://www.dovepress.com/ by 118.70.13.36 on 22-Aug-2020
Dovepress
Moskowitz et al
0.5 1.0 1.5 2.0 2.5 3.0
DCRIT
(degrees)
A
ROP Severe
Mild None
−1.00 −4.0 −3.0
−0.50 0.00 0.50 1.00
Severe ROP
N=7 ControlN=7 Log area (deg2)
No ROP N=16 Mild ROP
N=17
Log threshold (scot td s)
B
Figure 3 Rod-mediated spatial summation.
Notes: (A) DCRIT values in severe ROP, mild ROP, no ROP, and term-born control groups are plotted. Each point represents an individual subject; the number of subjects in
each group is indicated. The horizontal bars indicate the mean DCRIT value for each group. (B) The log–log plot demonstrates that reciprocity held. In every subject group, for
the smaller spots, threshold became lower (more sensitive) with increasing stimulus area. For larger diameter spots, the threshold did not change; summation was complete. (A) Copyright © 2014. Association for Research in Vision and Ophthalmology. Adapted from Hansen RM, Tavormina JL, Moskowitz A, Fulton AB. Effect of retinopathy of prematurity on scotopic spatial summation. Invest Ophthalmol Vis Sci. 2014;55(5):3311–3313.27
Abbreviations: DCRIT, critical diameter; ROP, retinopathy of prematurity.
60 −4.5
−4.0 −3.5
Log threshold (scot td s)
−3.0 −2.5
ROP Severe
Mild
tCRIT
None
Severe ROP N=7
Control
N=5 10 Log duration (ms)100 1,000
No ROP N=15 Mild ROP
N=23 80
100 120 140
tCRIT
(ms)
160 180 200
A
B
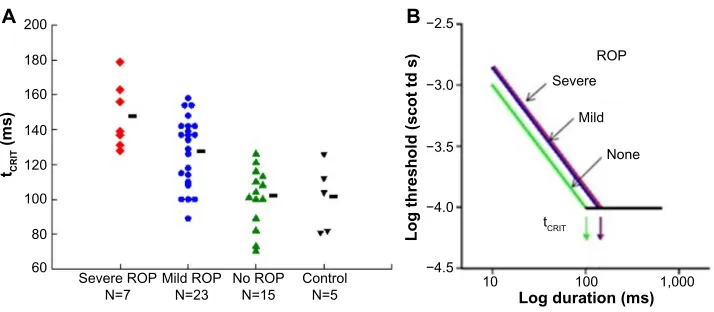
Figure 4 Rod-mediated temporal summation.
Notes: (A)tCRIT values in former preterm subjects with a history of severe ROP, mild ROP, and no ROP and in term-born controls are plotted. Each point represents individual
subjects; the number of subjects in each group is indicated. The horizontal bars indicate the mean tCRIT value for each group. (B) As shown in the log–log plot, reciprocity held.
In every subject group, for the brief duration stimuli, threshold became lower (more sensitive) with increasing stimulus duration. For longer duration stimuli, the threshold did not change; summation was complete. (A) Copyright © 2015. Association for Research in Vision and Ophthalmology. Adapted from Hansen RM, Moskowitz A, Tavormina JL, Bush JN, Soni G, Fulton AB. Temporal summation in children with a history of retinopathy of prematurity. Invest Ophthalmol Vis Sci. 2015;56(2):914–917.26
Abbreviations: tCRIT, critical duration; ROP, retinopathy of prematurity.
ROP and term-born controls. In other words, visual signals
are integrated over a larger area (larger receptive field)
in ROP subjects; the larger receptive field benefits visual
sensitivity. This is further evidence of intralaminar
re-orga-nization of the post-receptor ROP retina.
Temporal summation is an indicator of the kinetics of
phototransduction in the photoreceptors. In our rod-mediated
temporal summation test,
26the duration of a constant diameter
test spot (10
°
) was varied and the dark adapted threshold for
the detection of the test spot was measured for eight different
durations, ranging from brief (10 ms) to long (640 ms). The
results (Figure 4) show that the critical duration is longer in
subjects with a history of ROP than in preterm subjects who
never had ROP and term-born controls. This is a consequence
of the slow kinetics of activation of rod phototransduction in
ROP, in accord with the ERG a-wave results.
5For both spatial and temporal summation, reciprocity
prevailed.
26,27That is, as indicated by the diagonal lines
with slope
−
1 on the log–log plots shown in the right panels
in Figures 3 and 4, the subjects could detect a light ten
times dimmer if the stimulus was ten times bigger or ten
times longer. Once a critical large size or long duration
was reached, the threshold remained about the same as the
stimulus size or duration increased.
In an adaptive optical coherence tomography (OCT) study
of the retinal laminae at 18 degrees temporal eccentricity, we
found a higher ratio of post-receptor to photoreceptor
thick-ness in ROP subjects than in term-born control subjects.
43In
Eye and Brain downloaded from https://www.dovepress.com/ by 118.70.13.36 on 22-Aug-2020
Dovepress Visual development in ROP
retinal degenerative disorders, thickened inner retinal laminae
are reported in those retinal regions where the photoreceptors
are disturbed or lost
44and are postulated to be the retina’s
compensation for altered photoreceptor inputs to the
post-receptor retina.
Central retina in ROP
This region includes the fovea and the macula. Both cones
and rods are found in ROP zone 1 (Figure 5).
24The most
com-monly measured visual function, visual acuity, is mediated by
the foveal cones. Acuity deficits in ROP patients are common,
even if the ROP had been successfully treated or was mild and,
by clinical criteria, resolved completely. Most of the 15-year
alumni of the CRYO-ROP study
45and two-thirds of the 6-year
alumni of the ETROP study
46had acuity poorer than 20/40.
The central retina matures relatively late. For instance, the
outer segments of the rods central to the ring undergo later
developmental elongation than those peripheral to the ring.
There is a functional parallel. In healthy infants, dark adapted
visual thresholds central to the ring mature more slowly than
those peripheral to the ring.
47,48We hypothesized that this late maturing central region is
particularly vulnerable to ROP. Through a series of non-invasive
studies of the central retina in subjects with a history of mild
ROP, we found 1) delayed maturation of rod-mediated retinal
sensitivity using psychophysical procedures,
492) deficits in
cone-driven post-receptor activity using the multifocal ERG
(mfERG),
50and 3) persistent abnormalities of the intraretinal
vasculature using adaptive optics retinal imaging.
28Zone 2
Zone 1
Zone 3
Fovea
Disc Rod ring
Figure 5 Diagram of the International Classification of Retinopathy of Prematurity zones24 with a superimposed fundus photograph on which the optic disc and fovea
are indicated.
Notes: The green circle indicates the region of retina viewed through a 28 diopter lens used with the indirect ophthalmoscope. The band delineated by the yellow lines represents the location of the anatomical “rod ring”,9 which is an annular region in
which there is a high density of rods. The ring is concentric with the fovea and passes just nasal to the optic disc and approximately 18° temporal to the fovea.
In our longitudinal psychophysical study of infants with a
history of mild ROP,
49we found that, even though the clinical
disease had resolved spontaneously and completely by term,
dark adapted visual thresholds showed a protracted course
of development that continued until 18 months post-term,
whereas in term-born controls, the thresholds were mature
by age 6 months.
The mfERG provides topographical information about
the central retina.
51Cone-driven bipolar cells (post-receptor
retina) are the main contributors to mfERG responses.
52We found that mfERG responses were significantly smaller
in subjects with a history of mild ROP than in control
subjects (Figure 6, color 3-D plots).
50This result led us to
hypothesize that bipolar cell density differs between ROP
and control subjects. Using adaptive optics retinal imaging
(Figure 6),
28we found that the foveal pit in mild ROP eyes
was significantly shallower than in control eyes and that the
inner retinal laminae of foveal and extrafoveal regions were
significantly thicker in ROP eyes than in control eyes. This
is evidence of failure of centrifugal movement of the bipolar
cells during foveal development in ROP, as others have also
concluded.
53What leads to abnormal foveal structure
28and function
50in ROP? What goes wrong in the neurovascular development
of the central retina in prematurely born subjects? These
important issues remain under investigation. The absence of
foveal avascular zone and hypoperfusion of this important
retinal region during development have been discussed as
contributing factors
54There is also OCT evidence of cystoid
macular edema in ROP infants.
55Refractive development
Numerous studies have shown a high incidence of refractive
errors, particularly myopia, in infants born prematurely.
31,56–62Although these findings suggest a disturbance in the normal
regulation of ocular growth, the mechanisms have yet to be
specified. It seems unlikely that the mechanisms that are
operational in experimental myopia
63–65are applicable to
ROP. Interestingly, we have noted that in ROP infants, low
rod photoreceptor sensitivity, as determined by analysis of
the scotopic ERG a-wave, predicted later myopia.
32Deficits
in cone ERG responses have been reported in chicks with
form deprivation myopia.
66We have developed a model of normal eye growth and
applied it to the growth of ROP eyes.
30Through analysis of
extant magnetic resonance images (MRI), we found that the
growth of the ROP eye is slow and results in eyes that are
shorter and have steeper corneas and thicker lenses compared
Eye and Brain downloaded from https://www.dovepress.com/ by 118.70.13.36 on 22-Aug-2020
Dovepress
Moskowitz et al
Control
mfERG mfERG
OCT
En face OCT
E
A F
G
H
I
J
t
100 µm 100 µm 100 µm
n
t t n
n
ILM NFL GCL IPL INL OPL ONL ELM CC RPE C
B
C
D
E Subject 1 OS
Subject 2 OS
Subject 3 OS
Subject 4 OS
Subject 5 OS Subject 10 OS Subject 9 OD Subject 8 OS Subject 7 OS Subject 6 OD
G
En face OCT Mild ROP
Figure 6 Adaptive optics OCT images of ROP and control subjects.
Notes: A subset of the ROP subjects (n=5) who had participated in our mfERG study50 also participated in the imaging study.28 In the center panels, OCT images of controls
(left) and ROP subjects (right) are shown. The slices were taken through the fovea. On each image, the subject number and eye are indicated. The main findings were significantly shallower pits and significantly thicker post-receptor laminae in the ROP subjects than in the control subjects. En face images of the outer plexiform layer show a clear foveal avascular zone in the controls, but the ROP subjects had abnormal vessels that traversed the foveal region. OCT images Copyright © 2008. Association for Research in Vision and Ophthalmology. Reproduced from Hammer DX, Iftimia NV, Ferguson RD, et al. Foveal fine structure in retinopathy of prematurity: an adaptive optics Fourier domain optical coherence tomography study. Invest Ophthalmol Vis Sci. 2008;49(5):2061–2070.28 Color-coded 3-D topographical mfERG response density maps are
shown for a control subject (upper left) and for a subject with a history of mild ROP (upper right).
Abbreviations: mfERG, multifocal ERG; OCT, optical coherence tomography; OD, right; OS, left; ROP, retinopathy of prematurity; ILM, inner limiting membrane; NFL, nerve fiber layer; GCL, ganglion cell layer; IPL, inner plexiform layer; INL, inner nuclear layer; OPL, outer plexiform layer; ONL, outer nuclear layer; ELM, external limiting membrane; CC, connecting cilium; RPE, retinal pigment epithelium; C, choroid.
−25
1 10
Age (months) 100
−20
No ROP Mild ROP Severe ROP
−15 −10
Spherical equivalent (diopters)
−5 0 5 10
Figure 7 Spherical equivalent refraction (diopters) as a function of age (months).
Notes: Data are shown for 1,027 refractions of the right eye in 279 prematurely born subjects. One to 19 (median =2) refractions were performed on an individual; all refractions are shown. Green diamonds: 158 refractions from 78 subjects who never developed ROP; blue circles: 568 refractions from 154 subjects who had mild ROP; red triangles: 301 refractions from 47 subjects who had severe ROP.
Abbreviations: ROP, retinopathy of prematurity; PL, prediction limit.
Eye and Brain downloaded from https://www.dovepress.com/ by 118.70.13.36 on 22-Aug-2020
Dovepress Visual development in ROP
with those in preterm eyes without a history of ROP and in
term-born eyes. Refractive development has also been studied
in a rat model of ROP;
67,68more work is needed to translate
these findings to the human ROP eye.
Figure 7 shows the results of refractions performed on
279 of our ROP subjects. These data are in reasonable accord
with refractions in other populations of former preterms.
Compared with the prediction limits for normal refractive
development,
69,70myopia was more frequent in subjects with
ROP than in preterm born subjects who never developed ROP
and term-born control subjects. In the preterm subjects who
never had ROP, myopia seldom occurred, whereas hyperopia
was quite common. Previously reported data showed that, in
ROP subjects with myopia, the magnitude of myopia typically
increased with age.
31We are attempting to unravel the
mecha-nisms that underlie refractive development in ROP by
analyz-ing animal models of ROP,
67,68and have developed a human
model eye to facilitate studies in infants and children.
30Conclusion
Non-invasive investigation of former preterms, conceived
within a framework of molecular and cellular processes
known to occur in normal developing human retina and
rat models of ROP,
6,19,71–73yields a numeric description of
retinal, visual and refractive development in these infants
and children. Taken as a whole, these data derived from
electroretinographic, psychophysical and retinal imaging
studies link the children’s results to the molecular and cellular
processes. From a practical perspective, this body of
informa-tion contributes to the understanding of vision in children
with a history of ROP. Recognition that the neurosensory
retina has a role in ROP opens the possibility of future novel
therapeutic approaches to ROP.
Acknowledgment
Supported by National Eye Institute Grant R01
EY-010597.
Disclosure
The authors report no conflicts of interest in this work.
References
1. Al-Shabrawey M, Elsherbiny M, Nussbaum J, Othman A, Megyerdi S, Tawfik A. Targeting neovascularization in ischemic retinopathy: recent advances. Expert Rev Ophthalmol. 2013;8(3):267–286.
2. World Health Organization. Vision2020 Report: Global Initiative for the Elimination of Avoidable Blindness, Action Plan 2006–2011. Geneva: World Health Organization; 2007.
3. Steinkuller PG, Du L, Gilbert C, Foster A, Collins ML, Coats DK. Child-hood blindness. J Aapos. 1999;3(1):26–32.
4. Palmer EA, Flynn JT, Hardy RJ, et al. Incidence and early course of retinopathy of prematurity. The Cryotherapy for Retinopathy of Prematurity Cooperative Group. Ophthalmology. 1991;98(11): 1628–1640.
5. Fulton AB, Hansen RM, Moskowitz A, Akula JD. The neurovascular retina in retinopathy of prematurity. Prog Retin Eye Res. 2009;28(6): 452–482.
6. Provis JM. Development of the primate retinal vasculature. Prog Retin Eye Res. 2001;20(6):799–821.
7. Provis JM, Hendrickson AE. The foveal avascular region of developing human retina. Arch Ophthalmol. 2008;126(4):507–511.
8. Provis JM, Leech J, Diaz CM, Penfold PL, Stone J, Keshet E. Development of the human retinal vasculature: cellular relations and VEGF expression. Exp Eye Res. 1997;65(4):555–568.
9. Hendrickson AE. The morphologic development of human and monkey retina. In: Albert DM, Jakobiec FA, eds. Principles and Practice of Ophthalmology: Basic Sciences. Philadelphia: WB Saunders; 1994: 561–577.
10. Curcio CA, Sloan KR, Kalina RE, Hendrickson AE. Human photoreceptor topography. J Comp Neurol. 1990;292(4):497–523. 11. Osterberg G. Topography of the layer of rods and cones in the human
retina. Acta Ophthal Suppl. 1935;6:1–103.
12. Ni YQ, Huang X, Xue K, et al. Natural involution of acute retinopathy of prematurity not requiring treatment: factors associated with the time course of involution. Invest Ophthalmol Vis Sci. 2014;55(5): 3165–3170. 13. Repka MX, Palmer EA, Tung B. Involution of retinopathy of prematurity.
Cryotherapy for Retinopathy of Prematurity Cooperative Group. Arch Ophthalmol. 2000;118(5):645–649.
14. Reynaud X, Hansen RM, Fulton AB. Effect of prior oxygen exposure on the electroretinographic responses of infant rats. Invest Ophthalmol Vis Sci. 1995;36(10):2071–2079.
15. Akula JD, Hansen RM, Martinez-Perez ME, Fulton AB. Rod photoreceptor function predicts blood vessel abnormality in retinopathy of prematurity. Invest Ophthalmol Vis Sci. 2007;48(9):4351–4359. 16. Akula JD, Mocko JA, Moskowitz A, Hansen RM, Fulton AB. The
oscillatory potentials of the dark-adapted electroretinogram in retinopathy of prematurity. Invest Ophthalmol Vis Sci. 2007;48(12): 5788–5797.
17. Liu K, Akula JD, Falk C, Hansen RM, Fulton AB. The retinal vasculature and function of the neural retina in a rat model of retinopathy of pre-maturity. Invest Ophthalmol Vis Sci. 2006;47(6):2639–2647. 18. Liu K, Akula JD, Hansen RM, Moskowitz A, Kleinman MS, Fulton AB.
Development of the electroretinographic oscillatory potentials in normal and ROP rats. Invest Ophthalmol Vis Sci. 2006;47(12): 5447–5452.
19. Akula JD, Mocko JA, Benador IY, et al. The neurovascular relation in oxygen-induced retinopathy. Mol Vis. 2008;14:2499–2508.
20. Akula JD, Hansen RM, Tzekov R, et al. Visual cycle modulation in neurovascular retinopathy. Exp Eye Res. 2010;91(2):153–161. 21. Fierson WM. American Academy of Pediatrics Section on
Oph-thalmology, American Academy of OphOph-thalmology, American Association for Pediatric Ophthalmology and Strabismus, American Association of Certified Orthoptists. Screening examination of pre-mature infants for retinopathy of prematurity. Pediatrics. 2013;131(1): 189–195.
22. Cryotherapy for Retinopathy of Prematurity Cooperative Group. Multicenter trial of cryotherapy for retinopathy of prematurity cooperative group. Arch Ophthalmol. 1988;106(4):471–479. 23. Early Treatment for Retinopathy of Prematurity Cooperative Group.
Revised indications for the treatment of retinopathy of prematurity: results of the early treatment for retinopathy of prematurity randomized trial. Arch Ophthalmol. 2003;121(12):1684–1694.
24. International Committee for the Classification of Retinopathy of Prematurity. The international classification of retinopathy of prematurity revisited. Arch Ophthalmol. 2005;123(7):991–999. 25. Harris ME, Moskowitz A, Fulton AB, Hansen RM. Long-term effects
of retinopathy of prematurity (ROP) on rod and rod-driven function. Doc Ophthalmol. 2011;122(1):19–27.
Eye and Brain downloaded from https://www.dovepress.com/ by 118.70.13.36 on 22-Aug-2020
Dovepress
Moskowitz et al
26. Hansen RM, Moskowitz A, Tavormina JL, Bush JN, Soni G, Fulton AB. Temporal summation in children with a history of retinopathy of prematurity. Invest Ophthalmol Vis Sci. 2015;56(2):914–917. 27. Hansen RM, Tavormina JL, Moskowitz A, Fulton AB. Effect of
retinopathy of prematurity on scotopic spatial summation. Invest Ophthalmol Vis Sci. 2014;55(5):3311–3313.
28. Hammer DX, Iftimia NV, Ferguson RD, et al. Foveal fine structure in retinopathy of prematurity: an adaptive optics Fourier domain optical coherence tomography study. Invest Ophthalmol Vis Sci. 2008;49(5): 2061–2070.
29. Ramamirtham R, Garima S, Akula JD, et al. Extrafoveal cone packing density and geometry in retinopathy of prematurity (ROP). Invest Ophthalmol Vis Sci. 2015;56:ARVO E-Abstract 4933.
30. Munro RJ, Fulton AB, Chui TY, et al. Eye growth in term- and preterm-born eyes modeled from magnetic resonance images. Invest Ophthalmol Vis Sci. 2015;56(5):3121–3131.
31. Lue CL, Hansen RM, Reisner DS, Findl O, Petersen RA, Fulton AB. The course of myopia in children with mild retinopathy of prematurity. Vision Res. 1995;35(9):1329–1335.
32. Moskowitz A, Hansen RM, Fulton AB. Early ametropia and rod photoreceptor function in retinopathy of prematurity. Optom Vis Sci. 2005;82(4):307–317.
33. Fulton AB, Hansen RM. Electroretinogram responses and refractive errors in patients with a history of retinopathy prematurity. Doc Ophthalmol. 1995;91(2):87–100.
34. Fulton AB, Hansen RM. The development of scotopic sensitivity. Invest Ophthalmol Vis Sci. 2000;41(6):1588–1596.
35. Fulton AB, Hansen RM, Petersen RA, Vanderveen DK. The rod photoreceptors in retinopathy of prematurity: an electroretinographic study. Arch Ophthalmol. 2001;119(4):499–505.
36. Fulton AB, Hansen RM, Moskowitz A. The cone electroretinogram in retino-pathy of prematurity. Invest Ophthalmol Vis Sci. 2008;49(2): 814–819. 37. Jones BW, Kondo M, Terasaki H, Lin Y, McCall M, Marc RE. Retinal
remodeling. Jpn J Ophthalmol. 2012;56(4):289–306.
38. Marc RE, Jones BW, Anderson JR, et al. Neural reprogramming in retinal degeneration. Invest Ophthalmol Vis Sci. 2007;48(7):3364–3371. 39. Marc RE, Jones BW, Watt CB, Vazquez-Chona F, Vaughan DK,
Organisciak DT. Extreme retinal remodeling triggered by light damage: implications for age related macular degeneration. Mol Vis. 2008;14:782–806.
40. Xu HP, Tian N. Pathway-specific maturation, visual deprivation, and development of retinal pathway. Neuroscientist. 2004;10(4):337–346. 41. Xu HP, Tian N. Retinal ganglion cell dendrites undergo a visual
activity-dependent redistribution after eye opening. J Comp Neurol. 2007;503(2):244–259.
42. Xu HP, Tian N. Glycine receptor-mediated synaptic transmission regulates the maturation of ganglion cell synaptic connectivity. J Comp Neurol. 2008;509(1):53–71.
43. Akula JD, Mocofanescu A, Ferguson RD, et al. Retinal remodeling in retinopathy of prematurity. Invest Ophthalmol Vis Sci. 2014;54:ARVO E-Abstract 3505.
44. Huang WC, Cideciyan AV, Roman AJ, et al. Inner and outer retinal changes in retinal degenerations associated with ABCA4 mutations. Invest Ophthalmol Vis Sci. 2014;55(3):1810–1822.
45. Palmer EA, Hardy RJ, Dobson V, et al. 15-year outcomes following threshold retinopathy of prematurity: final results from the multicenter trial of cryotherapy for retinopathy of prematurity. Arch Ophthalmol. 2005;123(3):311–318.
46. Early Treatment for Retinopathy of Prematurity Cooperative G, Dobson V, Quinn GE, et al. Grating visual acuity results in the early treatment for retinopathy of prematurity study. Arch Ophthalmol. 2011;129(7):840–846.
47. Hansen RM, Fulton AB. Dark-adapted thresholds at 10- and 30-deg eccentricities in 10-week-old infants. Vis Neurosci. 1995;12(3): 509–512.
48. Hansen RM, Fulton AB. The course of maturation of rod-mediated visual thresholds in infants. Invest Ophthalmol Vis Sci. 1999;40(8): 1883–1886.
49. Barnaby AM, Hansen RM, Moskowitz A, Fulton AB. Development of scotopic visual thresholds in retinopathy of prematurity. Invest Oph-thalmol Vis Sci. 2007;48(10):4854–4860.
50. Fulton AB, Hansen RM, Moskowitz A, Barnaby AM. Multifocal ERG in subjects with a history of retinopathy of prematurity. Documenta ophthalmologica. Advances in ophthalmology. 2005;111(1):7–13. 51. Sutter EE, Tran D. The field topography of ERG components in man – I.
The photopic luminance response. Vision Res. 1992;32(3):433–446. 52. Hood DC, Frishman LJ, Saszik S, Viswanathan S. Retinal origins of the
primate multifocal ERG: implications for the human response. Invest Ophthalmol Vis Sci. 2002;43(5):1673–1685.
53. Yanni SE, Wang J, Chan M, et al. Foveal avascular zone and foveal pit formation after preterm birth. Br J Ophthalmol. 2012;96(7):961–966. 54. Lepore D, Molle F, Pagliara MM, et al. Atlas of fluorescein angiographic
findings in eyes undergoing laser for retinopathy of prematurity. Ophthalmology. 2011;118(1):168–175.
55. Maldonado RS, O’Connell R, Ascher SB, et al. Spectral-domain optical coherence tomographic assessment of severity of cystoid macular edema in retinopathy of prematurity. Arch Ophthalmol. 2012;130(5): 569–578.
56. Fledelius HC. Pre-term delivery and subsequent ocular development. A 7–10 year follow-up of children screened 1982–84 for ROP. 3) Refraction. Myopia of prematurity. Acta Ophthalmol Scand. 1996;74(3): 297–300.
57. Fielder AR, Quinn GE. Myopia of prematurity: nature, nurture, or disease? Br J Ophthalmol. 1997;81(1):2–3.
58. O’Connor AR, Stephenson T, Johnson A, et al. Long-term ophthalmic outcome of low birth weight children with and without retinopathy of prematurity. Pediatrics. 2002;109(1):12–18.
59. Larsson EK, Rydberg AC, Holmstrom GE. A population-based study of the refractive outcome in 10-year-old preterm and full-term children. Arch Ophthalmol. 2003;121(10):1430–1436.
60. O’Connor AR, Stephenson TJ, Johnson A, Tobin MJ, Ratib S, Fielder AR. Change of refractive state and eye size in children of birth weight less than 1701 g. Br J Ophthalmol. 2006;90(4):456–460.
61. Quinn GE, Dobson V, Davitt BV, et al. Progression of myopia and high myopia in the early treatment for retinopathy of prematurity study: findings to 3 years of age. Ophthalmology. 2008;115(6):1058–1064. 62. Quinn GE, Dobson V, Davitt BV, et al. Progression of myopia and
high myopia in the early treatment for retinopathy of prematurity study: findings at 4 to 6 years of age. J AAPOS. 2013;17(2):124–128. 63. Troilo D. Neonatal eye growth and emmetropisation – a literature review.
Eye. 1992;6(Pt 2):154–160.
64. Troilo D, Wallman J. The regulation of eye growth and refractive state: an experimental study of emmetropization. Vision Res. 1991; 31(7–8):1237–1250.
65. Wallman J. Retinal control of eye growth and refraction. Prog Retin Res. 1993;12:133–153.
66. Westbrook AM, Crewther DP, Crewther SG. Cone receptor sensitivity is altered in form deprivation myopia in the chicken. Optom Vis Sci. 1999;76(5):326–338.
67. Chui TY, Bissig D, Berkowitz BA, Akula JD. Refractive Development in the “ROP Rat”. J Ophthalmol. 2012;2012:Article ID 956705. 68. Zhang N, Favazza TL, Baglieri AM, et al. The rat with oxygen-induced
retinopathy is myopic with low retinal dopamine. Invest Ophthalmol Vis Sci. 2013;54(13):8275–8284.
69. Mayer DL, Hansen RM, Moore BD, Kim S, Fulton AB. Cycloplegic refractions in healthy children aged 1 through 48 months. Arch Ophthalmol. 2001;119(11):1625–1628.
70. Zadnik K, Manny RE, Yu JA, et al. Ocular component data in school-children as a function of age and gender. Optom Vis Sci. 2003;80(3): 226–236.
71. Hartnett ME. Pathophysiology and mechanisms of severe retinopathy of prematurity. Ophthalmology. 2015;122(1):200–210.
72. Hendrickson A, Troilo D, Djajadi H, Possin D, Springer A. Expression of synaptic and phototransduction markers during photoreceptor devel-opment in the marmoset monkey Callithrix jacchus. J Comp Neurol. 2009;512(2):218–231.
Eye and Brain downloaded from https://www.dovepress.com/ by 118.70.13.36 on 22-Aug-2020
Eye and Brain
Publish your work in this journal
Submit your manuscript here: http://www.dovepress.com/eye-and-brain-journal
Eye and Brain is an international, peer-reviewed, open access journal focusing on clinical and experimental research in the field of neuro- ophthalmology. All aspects of patient care are addressed within the jour nal as well as basic research. Papers covering original research, basic science, clinical and epidemiological studies, reviews and evaluations,
guidelines, expert opinion and commentary, case reports and extended reports are welcome. The manuscript management system is completely online and includes a very quick and fair peer-review system, which is all easy to use. Visit http://www.dovepress.com/testimonials.php to read real quotes from published authors.
Dovepress
Dove
press
Dove
press
Visual development in ROP
73. Hendrickson AE. Primate foveal development: a microcosm of current questions in neurobiology. Invest Ophthalmol Vis Sci. 1994;35(8): 3129–3133.
74. Fulton AB, Dodge J, Hansen RM, Williams TP. The rhodopsin content of human eyes. Invest Ophthalmol Vis Sci. 1999;40(8):1878–1883. 75. Hood DC, Birch DG. Rod phototransduction in retinitis pigmentosa:
estimation and interpretation of parameters derived from the rod a-wave. Invest Ophthalmol Vis Sci. 1994;35(7):2948–2961.
76. Lamb TD, Pugh EN Jr. A quantitative account of the activation steps involved in phototransduction in amphibian photoreceptors. J Physiol. 1992;449:719–758.
77. Pugh EN Jr., Lamb TD. Amplification and kinetics of the activation steps in phototransduction. Biochim Biophys Acta. 1993;1141(2–3):111–149. 78. Fulton AB, Rushton WA. The human rod ERG: correlation with
psychophysical responses in light and dark adaptation. Vision Res. 1978;18(7):793–800.
Eye and Brain downloaded from https://www.dovepress.com/ by 118.70.13.36 on 22-Aug-2020