Western University Western University
Scholarship@Western
Scholarship@Western
Electronic Thesis and Dissertation Repository
3-27-2013 12:00 AM
UTIL-DSS: Utilization-Based Dynamic Strategy Switching for
UTIL-DSS: Utilization-Based Dynamic Strategy Switching for
Improvement in Data Centre Operation
Improvement in Data Centre Operation
Graham Foster
The University of Western Ontario
Supervisor Hanan Lutfiyya
The University of Western Ontario Graduate Program in Computer Science
A thesis submitted in partial fulfillment of the requirements for the degree in Master of Science © Graham Foster 2013
Follow this and additional works at: https://ir.lib.uwo.ca/etd Part of the Other Computer Sciences Commons
Recommended Citation Recommended Citation
Foster, Graham, "UTIL-DSS: Utilization-Based Dynamic Strategy Switching for Improvement in Data Centre Operation" (2013). Electronic Thesis and Dissertation Repository. 1264.
https://ir.lib.uwo.ca/etd/1264
This Dissertation/Thesis is brought to you for free and open access by Scholarship@Western. It has been accepted for inclusion in Electronic Thesis and Dissertation Repository by an authorized administrator of
UTIL-DSS: UTILIZATION-BASED DYNAMIC STRATEGY SWITCHING FOR IMPROVEMENT IN DATA CENTRE OPERATION
(Thesis format: Monograph)
by
Graham Foster
Graduate Program in Computer Science
A thesis submitted in partial fulfillment of the requirements for the degree of
Master of Science
The School of Graduate and Postdoctoral Studies The University of Western Ontario
London, Ontario, Canada
Abstract
Applications are shifting into large scale, virtualized data centres that provide resources on a pay-per-usage basis. With power consumption representing a major operational cost, data centres must prioritize efficiency while still providing enough resources to meet application requirements. To meet variable application demands, a dynamic approach to virtual machine (VM) management is required. This requires: (i) placing newly arrived VMs, (ii) migrating VMs from highly utilized machines to avoid performance degradation, and (iii) migrating VMs from underutilized machines so that they may be deactivated to save power. Here, a management strategy is considered to be a policy-set that guides these three operations. To achieve the conflicting goals of performance and efficiency, I propose and evaluate a system of dynamically switching between two management strategies, each with a single goal, based on trends in data centre workload. Experimentation over a simulated data centre demonstrates the superiority of this approach over single-strategy techniques.
Keywords
Co-Authorship Statement
Acknowledgments
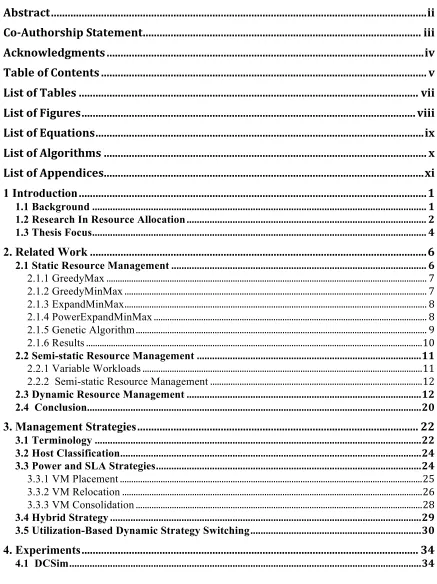
Table of Contents
Abstract...ii
Co-Authorship Statement... iii
Acknowledgments ...iv
Table of Contents ... v
List of Tables ... vii
List of Figures... viii
List of Equations...ix
List of Algorithms ... x
List of Appendices...xi
1 Introduction...1
1.1 Background... 1
1.2 Research In Resource Allocation... 2
1.3 Thesis Focus... 4
2. Related Work...6
2.1 Static Resource Management... 6
2.1.1 GreedyMax... 7
2.1.2 GreedyMinMax... 7
2.1.3 ExpandMinMax... 8
2.1.4 PowerExpandMinMax... 8
2.1.5 Genetic Algorithm... 9
2.1.6 Results...10
2.2 Semi-static Resource Management...11
2.2.1 Variable Workloads...11
2.2.2 Semi-static Resource Management...12
2.3 Dynamic Resource Management...12
2.4 Conclusion...20
3. Management Strategies... 22
3.1 Terminology...22
3.2 Host Classification...24
3.3 Power and SLA Strategies...24
3.3.1 VM Placement...25
3.3.2 VM Relocation...26
3.3.3 VM Consolidation...28
3.4 Hybrid Strategy...29
3.5 Utilization-Based Dynamic Strategy Switching...30
4. Experiments... 34
4.2 Variable Workload...35
4.3 Util-DSS Parameter Selection...36
4.4 Strategy Evaluation and Comparison...36
5. Results... 39
5.1 Validation of Hybrid Strategy...39
5.2 Util-DSS Results...40
6. Discussion... 43
7. Conclusion... 45
7.1 Future Work...45
References... 48
Appendices... 51
Appendix A - Definition of Terms...51
List of Tables
Table 1 - A comparison of two of the VM relocation policies [14]……….… 20
Table 2 - Results of comparison between Minimization of Migrations and Hybrid
Strategy……….… 40
Table 3 - Experimental results comparing Util-DSS and Hybrid management
List of Figures
Figure 1 - Util-DSS switching strategies based on data centre utilization………... 33
Figure 2 - Graphical representation of results of comparison between Hybrid and Util-DSS strategies. SLA and Power strategy results are also displayed for
List of Equations
Equation 1 - Power efficiency of a single host……….... 23
Equation 2 - Data centre power efficiency………..…… 23
Equation 3 - Score Vector Calculation……….... 37
List of Algorithms
Algorithm 1 - Power Strategy’s VM Placement Policy………... 26
Algorithm 2 - Power Strategy’s VM Relocation Policy……….. 27
Algorithm 3 - Power Strategy’s VM Consolidation Policy……….… 29
List of Appendices
1 Introduction
1.1 Background
Computing today is shifting into large-scale data centres that provide access to computing resources for client applications on a pay-per-usage basis. [1] This affords businesses and other organizations the opportunity to simplify their computing needs by offloading the hosting of their systems onto these off-site data centres. Outsourcing their computing requirements means that businesses no longer have to invest in internal IT solutions with all the costs that come along with that in the form of hardware acquisition and maintenance, staffing and concerns over hosting stability and uptime. These applications may range in type from computationally intensive research applications, or simply web/mail servers. Regardless of the type of application, data centres allow clients to rent out their computing resources and pay only for what they need. [1]
However, as data centres grow, they may simultaneously be hosting a wide variety of client applications across many machines. The significant operating costs associated with these large-scale data centres in the form of hardware acquisition and power consumption means that there is great motivation to organize these client applications onto as few, and as efficient machines as possible, while still ensuring that each application receives an adequate amount of computational power. Additionally, the functionality of each application must not be affected by the actions of neighbouring applications as this may result in an error in one application bring down one or more others. To address this and aid in resource management during application hosting, the technique of virtualization is used as it provides a number of features to aid in data centre management [2].
operations run by the true hosting machine. By placing each hosted application within a virtual machine (VM), the functionality of each application can be effectively isolated from collocated VMs and the applications they house, so the behaviour and actions of one application do not interfere with the functionality of others. Additionally, virtualization allows for the precise division of host resources among hosted VMs. In this way virtualization greatly simplifies the problem of allocating client applications to host machines; however the problem remains of determining an effective allocation that balances the desire to conserve power, while ensuring applications have adequate resources.
1.2 Research In Resource Allocation
One approach to resource allocation is to statically allocate enough resources to meet the peak demand of an application. However, the computing resources needed by an application often have high variability [3]. This can lead to a significant over-provisioning, resulting in underutilized resources. Virtualization allows for smaller units of resource to be allocated by using a single physical machine to host multiple VMs, each hosting a client application. If resources are still allocated for peak demand, however, then the physical machine may still be highly underutilized. Utilization can be increased by allocating only enough resources to meet average demand. This, however, can result in VMs being forced to compete for resources when demand increases. Since the overall utilization of a host is high, an increase in demand for an application can result in the VM requiring resources that are already in use by another co-located VM, thus leading to a degradation in application performance.
techniques. However, these approaches generally do not scale well [7] or are not responsive enough. For dynamic management, Stillwell et al. [5] have shown that variants of First Fit heuristics for vector bin packing work best for large-scale systems.
Dynamic management can address the utilization problem by taking advantage of the ability to migrate (move) a running VM from one physical host to another (live migration). More generally, dynamic management of VMs entails a coordinated use of three operations: (i) VM Placement (Allocation): the placement of a VM on a host machine in response to a VM creation request; (ii) VM Relocation: the migration of VMs from a host when the combined requirements of co-located VMs exceed the resources available on the host (stress situation); and (iii) VM Consolidation: the migration of VMs from an under-utilized host, so that the machine may be powered off to reduce costs. These operations make use of metrics characterizing the utilization of resources and the behaviour of applications. VM Relocation and VM Consolidation are triggered on regular time intervals. Decisions on when to invoke these operations are based on conditions on one or more metrics, e.g., when a certain threshold is exceeded. The specific conditions, metrics and threshold values vary and can be represented as a policy.
A dynamic management strategy is considered to consist of a set of policies, such that there is a policy that governs each of the defined management operations (i.e., a VM Placement policy, a VM Relocation policy, and a VM Consolidation policy). This work will focus on two of the most commonly studied goals in the area: (i) minimizing power consumption; and (ii) minimizing Service Level Agreement (SLA) violations. A SLA is considered to be a set of nonfunctional requirements, such as a promised condition on a metric (e.g., response time below a given threshold). Failure to meet the terms of the SLA is termed an SLA violation and is typically associated with some monetary cost to the data centre and so it follows that along with the minimization of power costs, minimization of such SLA violations is a major goal of data centre management.
VMs on a single host as possible. However, sudden increases in workload are more likely to result in a shortage of resources and therefore lead to a high number of SLA violations. Conversely, minimizing SLA violations typically requires VMs to be spread across more hosts, often each having a significant amount of unused resources available to handle spikes in demand. This, however, results in higher power consumption. Designing a management strategy to achieve both of these goals is therefore difficult, as improving performance towards one goal typically results in degradation of performance towards the other. Design of management strategies often focuses on achieving a single goal, or on prioritizing goals such that a single goal is considered the primary goal and others are considered secondary, e.g., [8], [3], [9], [10].
1.3 Thesis Focus
Within a dynamic environment there may be times when one management strategy is more appropriate than another. For example, when overall data centre workload is increasing, this trend would likely cause application resource requirements to potentially grow beyond their current allotments, causing a shortage of resources and, in turn, an SLA violation. During these times, this work proposes that extra care should be taken in managing VMs to guard against this. Conversely, when data centre utilization is stable or decreasing, the probability of SLA violations is likely smaller, and so less caution is required in this regard and the goal of conserving power should take precedence. This work proposes an approach to dynamically switch between two management strategies where each has a primary focus on a single goal; in this case, one strategy to minimize SLA violations and another to minimize power consumption and selectively applies each strategy according to changing data centre conditions. By doing so, better performance in attaining both goals may be produced.
2. Related Work
Solving the problem of efficiently allocating VMs to host machines while ensuring each application has access to adequate computing resources (termed Quality of Service, or QoS) has been the subject of much research. This work may generally be categorized as falling into two categories. Static allocations generally involve determining an allocation of VMs to host machines that attempts to balance the goals of utilization efficiency and high QoS based on the specified resource requirements of each application. These allocations are, in practice, performed once and attempt to consolidate workloads efficiently while reducing the likelihood of SLA violations occurring due to insufficient host resources. Dynamic allocations are similar in that they balance these same two driving forces of power efficiency and high QoS; however dynamic resource management involves periodic monitoring of VMs and hosts during operation and responding to changes in application workload by either migrating VMs from one host to another to alleviate resource contention in an over-utilized, or stressed host, or migrating all VMs away from an under-utilized host so that it may be placed in a low power state to reduce power consumption.
This section is an overview of the major contributions to each allocation category. In general, research into static resource management largely predates research in dynamic resource management and so, this area will be focused on first. Additionally, within each section, work in the area will be presented in a roughly chronological fashion so as to reflect the progress in the field. Section 2.1 will focus on research into static resource management, Section 2.2 will briefly describe what is termed here as semi-static resource management and finally Section 2.3 will centre around recent work in dynamic resource management.
2.1 Static Resource Management
placement is some measure of its expected workload. This allows the specification of a min and max value for each VM which will represent the minimum amount of resources that must be allocated to this application to allow an acceptable level of performance and the maximum expected amount of resources this application will ever request. This work assumes a revenue model for the data centre by which increased levels of application performance produce additional revenue from the client. Under this assumption, each application can be said to have a specific profitability, or utility function associated with it, whereby the revenue generated by an application depends on its level of performance. In this way, the allocation of additional resources to the application beyond the minimum, can be associated with additional revenue from the client. The level of profitability seen at different application performance levels was assumed to be specified in the business agreement with the client and potentially different for every application. To facilitate the sharing of resources in their simulation, the CPU is assumed to be capable of being arbitrarily divided among VMs using a ‘shares’ approach. Furthermore, a data centre composed of a heterogeneous collection of host machines is assumed with machines having potentially different resource capacities and different levels of power efficiency, measured as power consumption per unit of CPU.
Given this information several works [11], [4], [5], have suggested candidate algorithms to generate allocations:
2.1.1 GreedyMax
The GreedyMax (GM) algorithm [11] allocates each VM enough resources to satisfy its max allocation level. In this way the maximum level of revenue is derived from each client application. VMs are then assigned to hosts in order of the power efficiency of the specific host machine.
2.1.2 GreedyMinMax
entries, one with its resource requirements specified at its min value and one at its max value. This list is then sorted according to each VM’s profitability at the specified resource level from high to low. VMs are allocated from this list to host machines in a first fit manner in this order with the caveat that when a VM is allocated from the list at either its min or max level, the corresponding entry representing its other resource level is also removed from the list, ensuring that each VM is placed only once.
2.1.3 ExpandMinMax
The ExpandMinMax (EMM) algorithm [11] seeks to take advantage of a key situation which GMM fails to address. When placing VMs using the GMM algorithm above, it may be the case that after each VM has been assigned to a node at either its min or max capacity, there may be capacity remaining on a number of hosts. This negatively impacts the data centre’s operation as maximising utilization should be a constant goal, and it may be the case that incrementally increasing the resource allocation beyond the min level for a particular VM may increase its profitability as well.
To address this, when placing a VM, EMM first calculates the estimated profitability of each host if the current VM were to be placed there. Profitability is calculated by first setting all VMs located on the host to require their min level of resources, and then increasing the resource allotment incrementally to those VMs that would provide the greatest profit, per unit of capacity. This incremental increase in resource allotment continues until either the host’s capacity is reached or each VM is at its max level. Replacing the first-fit method of placement in GMM with this method would allow the selection of resource allocation levels between the min and max levels for each VM.
2.1.4 PowerExpandMinMax
decreasing that of collocated VMs as would be necessary were it to place the new VM on a partially utilized host. This “server sprawl” has a negative impact on power costs and generally leads to low average host utilization.
To address this problem, PEMM performs VM placement in a similar manner to EMM with the exception that when calculating the profitability of placing the VM on a particular host, there is an additional penalty incurred when the placement would require the activation of an otherwise unoccupied host. This penalty reflects the power costs incurred by supporting an additional host. This power cost is then scaled down to the size of the VM and considered to be the proportional power cost for the VM. Note that even when the expected profitability of placing the VM on a new host is negative, the placement may still take place if the profitability of placing the VM on a different, partially utilized host is even lower (more negative), as may be the case in the situation where more profitable VMs need to be compressed to make room for the new VM.
2.1.5 Genetic Algorithm
A genetic algorithm (GA) [5] was also suggested as a means of producing a high-performing VM placement allocation. The idea here is to have each “chromosome” or candidate represent a simple mapping of VMs to hosts. In support of GA, they suggest a mutation operator, which swaps the host assignment of two randomly selected VMs within the chromosome, and a crossover operator where two chromosomes are split at an identical random location and the pieces concatenated together to form two new VM allocation candidates. If an allocation is produced by either of these operations that is not feasible (ie. the combined resource requirements of collocated VMs exceed the capabilities of the host machine), a greedy algorithm is used to pass through the allocation in an arbitrary order and for each overloaded host, simply move VMs to less loaded machines.
application, informally referred to as the application’s level of happiness. and in so doing, maximize the average happiness of the client applications as a whole while ensuring that no VM trails significantly behind in terms of performance. Happiness here is calculated as the provided resources divided by the requested resources of each VM.
2.1.6 Results
Experimentation of the genetic algorithm above showed it to be generally less effective than other greedy algorithms the authors implemented [5]. These greedy algorithms are very similar to the greedy algorithms listed above by [11]. They found that their greedy algorithm outperformed the genetic algorithm in over 90% of trials, and among these trials, the average happiness of client applications was 32% higher than the average among GA allocations. Although they note that when the number of generations allowed in GA is increased from 100 to 2000, marginal improvements in allocation performance are seen, the execution time of the algorithm increases to be an order of magnitude larger than the greedy policies and so increasing the number of generations further is not feasible. Note that increasing the population size of GA produced no significant improvements.
In general within these works, evaluation between algorithms is performed by comparing the results of experimentation against a theoretical upper bound, common in evaluation of allocations ([11], [4], [5]). This upper bound represents the theoretical best performance attainable by removing the constraint that each client application must be entirely contained within a single server. Essentially, removing this constraint would allow all client VMs to be placed “end-to-end” in each host with any portion of a VM not fitting on a host “spilling over” into the next host. Hosts are filled in order of efficiency and the theoretical upper bound in terms of VM allocation performance is produced.
2.2 Semi-static Resource Management
2.2.1 Variable Workloads
Later work in this area, noted that consideration must be given to the fact that different types of client applications may exhibit dramatically different patterns of resource demand over time. In fact, this often unpredictable variability represents a key challenge in determining an effective VM allocation and has been the subject of much research [12], [13], [14], [15]. For example, a hosted intra-office scheduling application may experience significantly higher levels of activity during regular business hours, followed by comparatively lower levels of activity outside of these times. Therefore, it was proposed that cyclic patterns in workload could be leveraged by attempting, where possible, to assign complementary workloads to each host. This would mean that ideally, when one application can be expected to be requiring additional resources due to its high demand, the requirements of a complementary application would be expected to diminish, freeing up additional requirements.
Indeed, with regard to the these complementary workloads, the authors of a work investigating a periodic recalculation of the allocation [12] demonstrate that even when consideration of daily variations in resource requirements are measured using a granularity of one hour, their placement algorithm yields a 31% reduction the the number of host machines required to support a given workload, as compared to their naive placement algorithm. This reduction in required servers translates to a large reduction in power consumption and cooling requirements, two of the largest operational costs of a data centre.
2.2.2 Semi-static Resource Management
Semi-static resource management was an area briefly explored as a means of dealing with variations in workload that may take place over time [12]. Essentially, semi-static resource management would repeat the static allocation process as described above on some regular time interval. Ideally, this interval would be at least as small as the period over which significant variations in application workload could be observed. Such an algorithm would work by first analyzing historical workload data from each application. Using this data, a forecast could be made to predict expected future workloads. Based on these predictions a remapping of VMs to host machines would be performed to ensure additional resources are available if application workload is expected to increase, or to reclaim resources from an application expected to decline for use elsewhere. This process is then regularly repeated over some time interval, t. The authors here investigated varying t to different values ranging from fifteen minutes, up to ten hours. This periodic recalculation of the static placement yielded significantly better results in the authors’ experimentation. In fact, this approach displayed savings in required host activation of up to 50% as compared to static allocation. However, the author’s note an inherent limitation to this approach in that when calculating a new static allocation, perhaps after even very little change in application workload, the new allocation may be dramatically different than the previous allocation. Due to the costs in terms of resources as well as performance degradation associated with moving, or migrating, a VM from one host to another, this dramatic change is not ideal. The authors suggest that future work in this area should address these problems by perhaps searching for a means of mitigating the costs associated with relocating VMs from one host to another, or by adapting the allocation itself to either minimize change from a previous allocation, or generate more robust allocations that would delay the need for reallocation.
2.3 Dynamic Resource Management
more resources to increasing workloads, and reclaiming resources from declining workloads. The benefits of dynamic resource management lie in the fact that it can selectively deal with problems as they arise, eliminating the need for a regular, periodic reallocation cycle, and that solutions can be applied locally to directly address problem areas in the data centre, without interfering with those portions of the allocation that are performing well. These added capabilities create additional challenges such as how these problem areas can be identified in a timely manner, and how best to resolve the problem. Much work over the past several years has centred around these challenges and will be explored here.
While Sandpiper was shown to be an effective way to resolve performance problems and therefore ensure consistent QoS, it wasn’t until the following year that power considerations were included in dynamic management systems [10]. Motivated by the average power consumption of typical data centres of 100W / sq.ft, and the noted increase in that figure of 15-20% per year [17], a system was suggested which considered several methods of power reduction. This system, termed pMapper, considered power-saving techniques of three varieties:
● soft - hypervisor limits access to hardware of certain VMs to reduce cpu load;
● hard - dynamic voltage and frequency scaling (DVFS) throttles down the cpu to reduce power consumption;
● consolidation - emptying a lightly-utilized host machine by relocating its VMs to other hosts, thereby allowing the emptied host to be placed in a low-power state (standby, sleep, etc.);
Consolidation was additionally motivated by a recent poll showing motivation for consolidation split between the desire to control server sprawl, reducing power and cooling needs of the data centre and reducing total cost of ownership (TCO) costs (hardware acquisition, maintenance, etc.) [18].
diminish as total data centre utilization increases due to the fact that the most significant power savings were produced by the consolidation technique, as opposed to the soft and hard power-saving measures, and as each host machine approaches its capacity, the opportunity for consolidating workload onto fewer machines diminishes. The reason for the high performance of consolidation relative to the hard and soft power-saving measures is suggested to be due to the fact that up to 70% of the maximum power consumption of a host machine is present even when the host is idle [19] and so the primary goal of a power-saving management system should be to have as few host machines active as possible at any given time.
Further work in 2011 [20] refined these ideas by expressing the problem of dynamic resource management simply as a combination of VM relocation, as a process to relieve stress situations, and VM consolidation, as a means of saving power and preventing server sprawl. VM relocation can be further divided into two components: VM target selection to select a VM from a stressed host for relocation, and VM placement, to locate a host to receive the VM.
● Median Absolute Deviation (MAD) - Setting thresholds that correspond to the deviation in the median workload value, allows the thresholds to be tolerant of momentary spikes in workload and prevents far outliers from skewing this value too greatly.
● Interquartile Range (IQR) - Setting lower and upper bounds on cpu utilization that correspond with the 25th and 75th percentile of observed workload levels respectively. This also provides a tolerance to sudden workload spikes as above.
● Linear Regression (LR) - Avoiding the use of an upper threshold entirely, linear regression can be used to predict whether future utilization levels will exceed the capacity of the host machine. As this technique is more sensitive to shorter term trends in workload that the previous techniques ignore, there is less importance on providing a buffer between an upper threshold and the full capacity of the machine. By discarding these thresholds, utilization can more closely approach the capacity of the machine. Based on these predictions for high or low utilization going forward, the host can be marked for VM relocation or consolidation as appropriate.
To solve the problem of VM target selection when a host has been marked for VM relocation, the authors suggest the following algorithms [20]:
● Minimum Migration Time Policy (MMT) - Selection for migration of the VM that will take the least amount of time to migrate, calculated as the size of the memory footprint divided by the bandwidth of the network connection.
● Random Choice Policy (RC) - Use a uniformly distributed random variable to index a VM within the host to be selected for migration.
Finally, to address the problem of host selection to receive migrating VMs, the authors note that the problem can be represented as a bin packing problem with variable bin sizes and prices. In this case, the size of the bins represents the CPU capacity of the host machine and the price of the bin represents the host’s power efficiency. This allows for the representation of a heterogeneous collection of host machines as is likely to be the case in a commercial setting. However, the problem of bin packing is NP-hard and so to address it, the authors use a modification on the best fit decreasing algorithm (BFD) whereby VMs are sorted in decreasing order based on their workload, and placed on hosts such that the minimum power consumption increase is produced, essentially utilizing the most efficient host machines first.
Evaluating the overall performance of an experiment using the metrics of frequency of SLA violations and gross power consumption can be difficult as each is measured in different units and vary over different ranges of values. Additionally, they are often considered to be in conflict with one another as improving performance in one area for a given workload can usually correlate with diminished performance in the other. Therefore, to evaluate their proposed algorithms the authors measure simulation performance against a combined energy - SLA metric termed, Energy-SLA Violation (ESV). This metric is calculated simply as the product of the energy consumption of the data centre and the number of SLA violations. In this way, slight increases in frequency of SLA violations can be considered acceptable if accompanied by significant savings in terms of energy consumption and vice versa. To solve the problem of balancing the priority of each metric, the authors additionally suggest a weight value, through which the relative importance of each metric can be adjusted.
Additionally, MMT was shown to outperform RC and MC suggesting that migration time was a more important factor to minimize than correlation of workloads between VMs.
In a later 2012 work [16], these authors further refine the subject area of dynamic resource management by suggesting several more VM selection algorithms for evaluation. Note that VM placement was performed in these experiments in a similar manner to the authors’ previous work, [20], using their modified best fit decreasing algorithm. Their proposed VM selection algorithms are as follows:
● Minimization of Migrations (MM) - Select the minimum number of migrations necessary to relieve a stress situation on host. That is, the algorithm selects for migration the VM with the smallest workload big enough to entirely relieve the stress situation. If no single VM has a large enough utilization to relieve the stress situation itself, the largest VM is selected for migration and the algorithm repeats.
● Highest Potential Growth (HPG) - Select for migration that VM which is experiencing the lowest current utilization, relative to its expected utilization level. This VM is therefore considered to have the highest potential growth in workload and is removed so as to decrease the likelihood of total host workload increasing in the future.
● Random Choice (RC) - As above, use a uniformly distributed random variable to index a VM on the stressed host and select it for migration
their best-performing selection algorithm. However, although fewer in number, the size of each migration is not addressed.
A 2012 work identified a further difficulty of optimizing VM placement in terms of host utilization and power consumption in that these goals can be considered to be somewhat conflicting. [14] That is to say that actions taken to improve performance in one area often come at the cost of decreased performance in the other. This was seen in the evaluation of a number of different VM relocation policies investigated in this work. These algorithms are all based around the first-fit heuristic, used to approximate a solution to the NP-hard vector bin-packing problem to which VM allocation is related. Variations of this heuristic are widely used to aid in VM placement [20], [16], however sorting techniques vary. In this work, the authors investigate sorting techniques that differ simply in that under a stress situation VMs are either sorted for migration in an increasing or decreasing manner by their CPU workload, and for host selection, host machines are sorted by their CPU availability in either an increasing, decreasing or mixed manner, where mixed refers to sorting partially utilized machines in an increasing manner, and underutilized machines in a decreasing manner. This method of sorting VMs and hosts is a well established technique and is utilized in the above dynamic resource management works [20], [16].
a 65% lower request drop rate. This highlights the idea that these primary operational goals of a data centre are often at odds with one another and that further research is warranted to investigate the possibility of optimizing VM allocations for both these goals
.
Table 1: A comparison of two of the VM relocation policies [14]
2.4 Conclusion
3. Management Strategies
The term management strategy here is defined to represent an instantiation of policies to perform the placement, relocation and consolidation of VMs on host machines. This section presents three management strategies: (i) Power, which is designed to emphasize the reduction of power consumption (Section 3.3), (ii) SLA, which is designed to emphasize the minimization of SLA violations (Section 3.3), and (iii) Hybrid, which is designed to pursue both goals simultaneously (Section 3.4). Finally, this section will introduce a meta-strategy called Utilization-Based Dynamic Strategy Switching, Util-DSS. This meta-strategy dynamically switches between the Power and SLA strategies at runtime based on the monitoring of changing data centre conditions (Section 3.5).
3.1 Terminology
This section presents the terms and metrics used in the description of management strategies. These terms are also defined in Appendix A.
SLA Violation: An SLA violation occurs when resources required by a VM are not available to it, as this situation leads to a degradation in performance. The percentage of required CPU not available in the SLA violation is denoted by s.
Data Centre Utilization: The overall utilization of the data centre is calculated as the percentage of total CPU capacity in the data centre that is currently in use.
CPU Shares: The capacity of a CPU is quantified using CPU shares, where each CPU core has a specific number of shares which represents its computing power. In this work, the number of shares assigned to each core is based on its frequency, with 1GHz = 1000 shares.
Power Efficiency: For a host, h, the power efficiency, ph, is the amount of processing
€
p
h=
cpuInUse
hpowerConsumption
hEquation 1 - Power efficiency of a single host
where cpuInUseh is the number of CPU shares currently in use across all cores in the
host, and powerConsumptionh is the current power consumption in watts of the host. As
an active host machine consumes a significant amount of power even when under little or no CPU load (i.e. very low power efficiency) increased host utilization corresponds to increased power efficiency for that host. This metric is used to calculate the power efficiency for the entire data centre, pdc, calculated as in Equation 2.
€
p
dc=
cpuInUse
hh∈
∑
hostspowerConsumption
hh∈hosts
∑
Equation 2 - Data centre power efficiency
such that hosts is the collection of all hosts in the data centre.
Maximum Power Efficiency: This metric represents the best power efficiency a given host can achieve, calculated as the power efficiency of the host at maximum CPU utilization.
host is allocated 100% of its CPU capacity. The optimal power efficiency, pdcopt, is calculated as the power efficiency of the data centre given this allocation.
3.2 Host Classification
Each time a management operation takes place, hosts are classified into categories based on their power state: on, suspended or off. Powered on hosts are further classified
as stressed, partially-utilized or under-utilized, based on their CPU utilization level. Hosts may transition between these states based either on changes in workload of the hosted VMs, or migrations performed by the management operations. Two threshold values are used for categorization: stressCPU and minUsageCPU. Classification is based on the hosts
average CPU utilization over the last monitoring window (measurements collected every 2 minutes over a sliding window of size 5). Categories are defined as follows:
● Stressed: hosts with average CPU utilization in the range [stressCPU;1];
● Partially-utilized: hosts with average CPU utilization in the range [minUsageCPU; stressCPU];
● Under-utilized: hosts with average CPU utilization in the range [0;
minUsageCPU];
● Empty: hosts that do not currently have any VM assigned to them. Hosts in
suspended or off power state are included in this category.
It should be noted that different VM Relocation policies may make the determination of whether a host is stressed in slightly different manners based on how the most recent measurements of host utilization are considered. This stress check differs in its determination of a stress level depending on the primary goal of the strategy. An example of the different manners in which this stress check is performed are seen in the difference in VM Relocation policies seen in the Power and SLA strategies below.
Power and SLA are single-goal strategies, which means that all management decisions are geared towards achieving a single, primary goal. Single-goal strategies may pursue secondary goals, but always give them lower priority than the primary goal. In the next subsections, the VM Placement, VM Relocation and VM Consolidation policies that comprise these two strategies are explained. Much of the existing work on dynamic management uses some form of First Fit heuristics. The work described in [5] (for static workloads) and [14] (for dynamic workloads) studied variants of First Fit heuristics and found that they work best in practice at determining VM allocations. The Power and SLA strategies are based on such heuristics and are representative of other work on dynamic resource management.
The strategies use different values for the stressCPU threshold: the Power strategy uses
95% and the SLA strategy used 85%. The lower threshold for the SLA strategy allows for additional resources to be available for workload variations. Both strategies use the
minUsageCPUthreshold of 60%.
3.3.1 VM Placement
1: Input: VM 2: Output:
-3: z,p,u,e = classifyHosts(hosts) 4: p’, u’ = sortPowerEffThenUtil(p,u) 5: e’ = sortPowerEffThenState(e) 6: target = concatenate(p’,u’,e’) 7: for host in target do
8: if host.hasCapacity(VM)then 9: host.deploy(VM)
10: break 11: end if 12: end for
Algorithm 1: Power strategy’s VM Placement policy
The VM Placement policy for the SLA strategy differs from the Power strategy’s policy in the way p and u are sorted: p is sorted in increasing order first by CPU utilization and then by maximum power efficiency and u is sorted in decreasing order first by CPU utilization and then by maximum power efficiency. This sorting method ensures that the placement focuses on spreading load across the hosts, leaving spare resources to handle spikes in resource demand, over any other considerations. This change in sorting allows the SLA strategy to pursue the primary goal of minimization of SLA violations over the secondary goal of maximizing power efficiency.
3.3.2 VM Relocation
This management operation runs frequently over short intervals of time, so as to detect stress situations quickly. For both strategies, the interval is set to 10 minutes. This operation determines which hosts are experiencing a stress situation and attempts to resolve the situations by migrating one VM from each stressed host to a non-stressed host. The VM Relocation policy for the Power strategy (see Algorithm 2) first classifies hosts in their respective categories (line 1), performing a stress check on all hosts to determine whether or not they are stressed. The policy performs its stress check by classifying a host as stressed if its CPU utilization has remained above the stressCPU
then by CPU utilization, and e is sorted in decreasing order first by maximum power efficiency and then by power state. The policy then builds a list of target hosts by concatenating p’, u’ and e’ (line 6). Following a First Fit heuristic, the policy selects one VM from each host h in source and a corresponding host in target to which to migrate the VM (lines 7-22). For each host h in source, the policy filters out the VMs with less CPU load than the CPU load by which h is stressed and sorts the remaining VMs in increasing order by CPU load (line 8). If the list of remaining VMs is empty, all VMs are considered and sorted in decreasing order by CPU load. The method migrate(h, VM, host) initiates a migration (line 13).
1: z,p,u,e = classifyHosts(hosts) 2: z’ = sortUtil(z)
3: p’,u’ = sortPowerEffThenUtil(p,u) 4: e’ = sortPowerEffThenState(e) 5: source = z’
6: target = concatenate(p’,u’,e’) 7: for h in source do
8: vms = filterAndSort(h.vms) 9: success = FALSE
10: for VM in vms do
11: for host in target do
12: if host.hasCapacity(VM) then 13: migrate(h,VM,host)
14: success = TRUE 15: break
16: end if 17: end for
18: if success then 19: break
20: end if 21: end for 22: end for
Algorithm 2: Power strategy’s VM Relocation Policy
The VM Relocation policy for the SLA strategy differs from the Power strategy’s policy in the way p and u are sorted: p is sorted in increasing order first by CPU utilization and then by maximum power efficiency and u is sorted in decreasing order first by CPU utilization and then by maximum power efficiency. In addition, the policy performs a different stress check as follows: a host is stressed if its last two monitored CPU load values are above the stressCPUthreshold or its average CPU utilization over the last CPU
3.3.3 VM Consolidation
1: z,p,u,e = classifyHosts(hosts) 2: powerOff(e)
3: p’,u’ = sortPowerEffThenUtil(p,u) 4: target = concatenate(p’,u’)
5: source = sortPowerEffThenUtil(u) 6: for h in source do
7: vms = sort(h.vms) 8: for VM in vms do
9: for host in target do
10: if host.hasCapacity(VM) then 11: migrate(h,VM,host)
12: break 13: end if 14: end for 15: end for 16: end for
Algorithm 3: Power strategy’s VM Consolidation policy
The VM Consolidation policy for the SLA strategy differs from the Power strategy’s policy in the way p and u are sorted: first, p is sorted in increasing order first by CPU utilization and then by maximum power efficiency and u is sorted in decreasing order first by CPU utilization and then by maximum power efficiency, and then to generate a list of target machines, u is sorted in increasing order by CPU utilization. The functionality of the Power strategy’s consolidation algorithm is outlined in Algorithm 3.
3.4 Hybrid Strategy
We designed a dual-goal strategy as a combination of the Power and SLA strategies; the Hybrid strategy consists of the VM Placement and VM Relocation policies of the SLA strategy and the VM Consolidation policy of the Power strategy. Furthermore, the stress check performed by the VM Relocation policy represents a compromise between the checks of SLA and Power: it determines that a host is stressed only if its average CPU utilization over the last monitoring window exceeds the stressCPU threshold. The
thresholds stressCPU and minUsageCPUwere set to 90% and 60% respectively.
valid benchmark against which to compare the strategy switching technique (described in Section 3.5), the performance of the Hybrid strategy is compared against an implementation of the Minimization of Migrations algorithm. Through the experimentation performed in [16], this algorithm was found to produce the best compromise among several candidate strategies when trying to pursue both goals simultaneously. The results of this comparison are described in Section 5.1.
3.5 Utilization-Based Dynamic Strategy Switching
Through preliminary experimentation, two key situations in which one strategy had an advantage over the other became apparent. When overall data centre utilization is growing, increasing the stress on host machines, the SLA strategy is generally more effective as it places greater emphasis on preventing SLA violations. Conversely, when utilization is stable or decreasing, thus decreasing the likelihood of stress situations and increasing the likelihood of hosts becoming underutilized, the Power strategy is more effective as it can more quickly perform VM Consolidation to conserve power.
The Utilization-Based Dynamic Strategy Switching (Util-DSS) meta-strategy is designed to exploit this pattern. It uses the rate of change of overall data centre utilization, m, to determine appropriate times to switch strategies. Measurements of the overall data centre utilization are taken at regular intervals. Linear regression over the last n data centre utilization measurements provides the rate of change, m, over a window of time. The value mSLA defines a threshold for m over which a switch is made to the SLA strategy.
Similarly, the value mPowerdefines a threshold for m under which the Power strategy is set
1: util = getDCUtilWindow(dc,n) 2: m = linearRegression(util)
3: if activeStrategy = Power_Strategy then 4: if m > mSLA then
5: Switch to SLA_Strategy 6: end if
7: else if activeStrategy = SLA_Strategy then 8: if m < mPower then
9: Switch to Power_Strategy 10: end if
11: end if
Algorithm 4: Util-DSS Switching Conditions
where getDCUtilWindow(dc) returns the data centre utilization measurements over the past n measurements. No other conditions cause a strategy switch beyond those outlined in Algorithm 4. If the activeStrategy is Power_Strategy, the only event that could cause a switch to SLA_Strategy is an increase of m above mSLA and if activeStrategy is SLA_Strategy, the only event triggering a switch to Power_Strategy would be a decrease of m below mPower.
The switching thresholds mSLA and mPower were determined using a brute force
search across all combinations of threshold values between -0.005 and 0.015 in increments of 0.0005. Threshold values less than -0.005 or greater than 0.015 produced great drop-offs in performance due to the switching thresholds being so far from typically observed values of m that no thresholds were ever crossed. In this case, strategy switching would either never occur, or in the specific case of an overly low mSLA
threshold and an overly high mPowerthreshold, a strategy switch would occur every time
and fine search granularity above, any given learning algorithm could only perform, at best, as well as this exhaustive search.
The search for threshold values used a set of 5 simulations, each of a duration of 10 simulated days and each using a different random workload (workload generation is described in Section 4.2). Each candidate pair of threshold values was evaluated against these 5 simulations and ranked by score (scoring technique described in Section 4.4). Threshold candidates generally performed consistently across the 5 simulations. Due to this observed consistency, the selected thresholds, chosen for their high performance during this search, are assumed to be high performing in general and can be used across all randomized workloads under the conditions of these experiments.
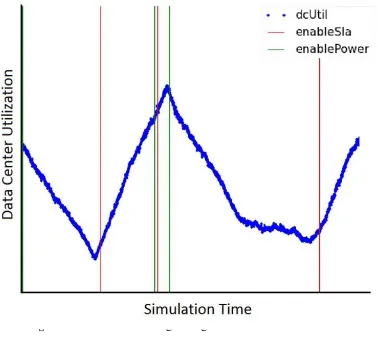
Figure 1 below represents the operation of Util-DSS over a segment of simulated time. The blue series represents measured values of overall data centre utilization over time. Red and blue vertical lines represent switches in management strategy to the SLA and Power strategies respectively. Note that when data centre utilization begins to increase, the slope of the line-of-best-fit crosses the mSLAthreshold and a switch is made
to the SLA strategy, represented by a vertical red line, and when utilization begins to level off or decrease, the slope of the line-of-best-fit falls below mPower and a switch is
4. Experiments
This Chapter outlines the setup of DCSim [22], the simulator used to run the experiments, as well as the implementation of variable workloads. Additionally, this Chapter outlines a novel evaluation technique whereby the performance of multiple strategies can be directly and quantitatively compared using the very different metrics of SLA violations and aggregate power efficiency.
4.1 DCSim
Experimentation is conducted by simulation using DCSim [22]. The simulated data centre consists of 200 host machines, of which there are an equal number of two types:
small and large. The small host is modelled after the HP ProLiant DL380G5, with 2 dual-core 3GHz CPUs and 8GB of memory. The large host is modelled after the HP ProLiant DL160G5, with 2 quad-core 2.5GHz CPUs and 16GB of memory. Cores in the large host have 2500 CPU shares, and cores in the small host have 3000 CPU shares. The power consumption of both hosts is calculated using results from the SPECPower benchmark [23]. The maximum power efficiency of the large host (85.84 cpu/watt) is roughly double that of the small host (46.51 cpu/watt).
Three VM sizes are created: small requires 1 virtual core with at least 1500 CPU shares and 512MB of memory, medium requires 1 virtual core with at least 2500 CPU shares and 512MB of memory, and large requires 2 virtual cores with at least 2500 CPU shares each and 1GB of memory.
During a VM migration, an SLA violation of 10% of CPU utilization is added to migrating VMs, and an additional CPU overhead of 10% of the migrating VMs CPU utilization is added to both the source and target host [20].
Measurements of metrics used by management policies, such as host CPU utilization and SLA violation, are drawn from each host every 2 minutes and evaluated by the policy over a sliding window of 5 measurements.
4.2 Variable Workload
A data centre experiences a highly dynamic workload, driven by VM arrivals and departures, as well as the dynamic workloads and resource requirements of VMs. Here, random workload patterns are generated to evaluate our strategies, where a workload pattern consists of a set of VMs with specific start and stop times, each with dynamic trace-driven resource requirements. As resource allocation is naive of application-type, it is likely that hosted VMs in a data centre will embody a wide variety of application types. Therefore, in these simulations, a variety of traces, representing a variety of applications from different real-world sources were used. Each VM is driven by one of 5 individual traces: the ClarkNet, EPA, and SDSC traces [24], and two different traces from the
Google Cluster Data trace [25]. The normalized rate of incoming requests, in 100 second intervals, is calculated for each trace. The request rates are used to define the current workload of each VM, with the CPU resource requirements of the VM calculated as a linear function of the current rate. Each VM starts its trace at a randomly selected offset time.
admission of some incoming VMs due to insufficient available resources. This continues for 10 simulated days at which point the experiment terminates. Data from the first 2 days of simulation are discarded to allow the simulation to stabilize before recording results.
4.3 Util-DSS Parameter Selection
The switching thresholds mSLA and mPower used for Util-DSS are arrived at using the
method described in Section 3.5. They are each selected to be 0.00255 as this combination produced the best aggregate performance across the five random workloads and are therefore submitted as the best performing switching thresholds. Note that as the value of each threshold is the same, the behaviour of Util-DSS will be simplified to switch to the Power strategy if the rate of change in data centre utilization, m, falls below 0.00255 and switch to the SLA strategy if the rate rises above this value.
The frequency with which the strategy switching method is evaluated was selected to be every one hour following informal, preliminary experimentation over multiple frequency values. Additionally, the monitoring window of Util-DSS, from which measurements of utilization are recorded and considered during strategy switching evaluation, is set to a size of 2 simulated hours in 6, 20-minute intervals. This timing was selected during preliminary experimentation as a balance between being sensitive to changes in workload patterns, but avoiding thrashing between strategies caused by overreacting to minor fluctuations in data centre utilization.
4.4 Strategy Evaluation and Comparison
potential for lost revenue due to poor application behaviour. In the absence of well-defined business rules governing the relative value of each metric, a method is required to evaluate performance based only on the observed values of these metrics.
In order to determine whether DSS can offer improved results over a single strategy, this work proposes a method of evaluating the performance of a strategy relative to other strategies’ performance based on the experimental results of each. Using the SLA and Power strategies as benchmarks, their SLA violation and power efficiency results can be used as baseline measurements with which to evaluate other strategies. The SLA strategy provides the bounds for the best SLA violation value (sbest = sSLA) and the worst power
efficiency (pworst = pSLA), while the Power strategy provides the worst SLA violation
(sworst = sPower) and best power efficiency (pbest = pPower). Values from a candidate strategy, i, are then normalized using these bounds to produce the normalized vector, vi ,
represented by [snorm ; pnorm]. The values snorm and pnorm are defined in Equation 3.
€
s
norm=
(
s
i−
s
best)
(
s
worst−
s
best)
p
norm=
(
p
best−
p
i)
(
p
best−
p
worst)
v
i=
(
s
norm,
p
norm)
Equation 3: Score Vector Calculation
where pnorm is the normalized power efficiency and snorm is the normalized SLA violation. Note that pbest > pworst, but sbest< sworst, so the normalization equations differ to
reflect this. Using the normalized vector, vi , it is possible to calculate its L2-norm, |vi |
€
score
i=
v
i=
s
norm2+
p
norm2Equation 4: Score Calculation
where a smaller score is considered better, as it represents a smaller distance to the best bounds of each metric (defined by sbestand pbest). The SLA and Power strategies always
achieve a score of 1 by definition, as they achieve the best score in one metric and the worst in the other. Scores less than 1 indicate that overall performance of the candidate strategy is superior to that of the baseline strategies.
5. Results
This Chapter will outline the results of experiments comparing Minimization of Migrations (MM) [16] with the Hybrid strategy, outlined in Section 3.4. This will determine the validity of the Hybrid strategy and in so doing, establish its effectiveness as a competitor with Util-DSS. Following these experiments, this section will outline the results of a comparison between Hybrid Strategy and Util-DSS over a much larger number of trials. The results of these experiments will determine the validity of Util-DSS as an effective data centre management technique.
5.1 Validation of Hybrid Strategy
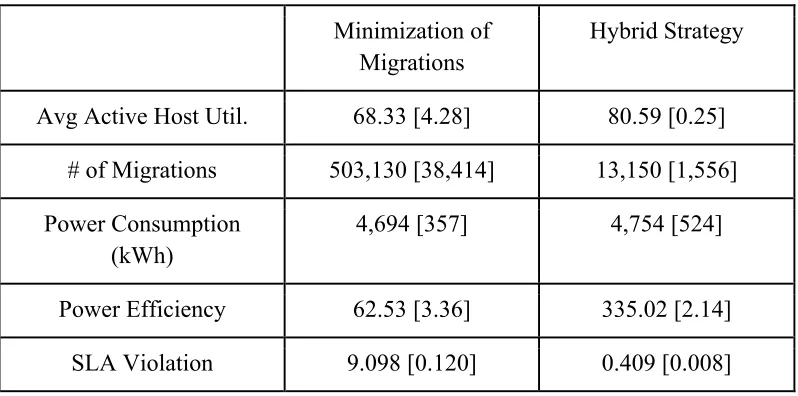
In order to determine the validity of the Hybrid strategy as an effective management strategy against which a fair comparison of the effectiveness of Util-DSS can be made, experiments were run comparing Hybrid strategy to an implementation of the Minimization of Migrations strategy [16] outlined above. The experiments were run using the same configuration of DCSim outlined above in Sections 4.1 and 4.2. The evaluation was performed with a set of 5 randomly generated workload patterns. The results of this evaluation are presented in Table 2. Reported metrics were averaged across all workload patterns and the standard deviation is presented in square brackets. The following metrics are reported: Average Active Host Utilization is the average CPU utilization of powered on hosts; # of Migrations is the number of VM migrations triggered by the management strategies; Power Consumed is the total power consumed by all hosts in kWh; Power Efficiency is pdc over the entire simulation; and SLA
Minimization of Migrations
Hybrid Strategy
Avg Active Host Util. 68.33 [4.28] 80.59 [0.25]
# of Migrations 503,130 [38,414] 13,150 [1,556]
Power Consumption (kWh)
4,694 [357] 4,754 [524]
Power Efficiency 62.53 [3.36] 335.02 [2.14]
SLA Violation 9.098 [0.120] 0.409 [0.008]
Table 2: Results of comparison between Minimization of Migrations and Hybrid Strategy
5.2 Util-DSS Results
The results of the experiments are presented in Table 3. Each management strategy was evaluated with the same set of 100 randomly generated workload patterns. Each experiment was repeated only once per workload pattern, as the simulation is deterministic. Results were averaged across all workload patterns and the standard deviation is shown in square brackets. The following metrics were reported: Average Active Host Utilization is the average CPU utilization of powered on hosts; # of Migrations is the number of VM migrations triggered by the management strategies; Power Consumed is the total power consumed by all hosts in kWh; Power Efficiency is
pdc over the entire simulation; and SLA Violation is s over the entire simulation. Also
Analysis of Variance was performed on the score results, as well as paired t-tests for each pair of management strategies. The resulting scores for each management strategy were found to be significantly different from each other.
SLA Power Hybrid Util-DSS
Avg. Active Host Util.
75% [0.4] 88% [0.4] 81% [0.4] 82% [1]
# of Migrations 15818 [2292] 24378 [3311] 14643 [1930] 19580 [3047]
Power Consumed (kWh)
5488 [703] 4384 [519] 5049 [679] 4778 [583]
Power Efficiency 60.6 [2.4] 75.2 [2.0] 65.9 [2.7] 69.8 [2.3]
SLA Violation 0.033% [0.01] 0.474% [0.05] 0.092% [0.01] 0.220% [0.05]
snorm 0.0 1.0 0.135 [0.01] 0.425 [0.09]
pnorm 1.0 0.0 0.636 [0.06] 0.373 [0.08]
Score 1.0 1.0 0.651 [0.05] 0.576 [0.041]
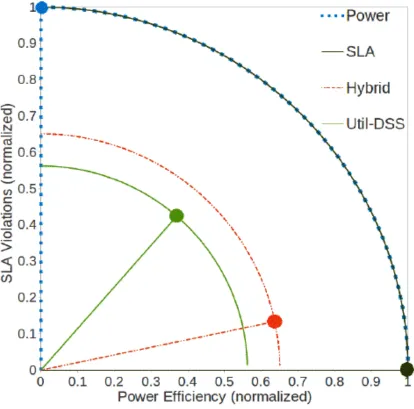
Figure 2: Graphical representation of results of comparison between Hybrid and Util-DSS strategies. SLA and Power strategy results are also displayed for reference,
6. Discussion
Both Util-DSS and the Hybrid strategy produced better overall performance than either of the single-goal Power and SLA strategies with an improvement in score of around 40%. Furthermore, when compared against Hybrid, using the scoring method outlined above, Util-DSS outperformed the Hybrid strategy by ~11.5%. This improvement was largely seen in a 271 kWh reduction in power consumption. Although Util-DSS had a higher percentage of SLA violations than Hybrid, the savings in power were more than enough to make up for this.
Additionally, the results from Util-DSS display a near-perfect balance between the Power and SLA metrics. However, as these results are calculated relative to the results of the Power and SLA strategies, the observed balance of Util-DSS relies on the truth of the assumption that Power and SLA strategies are each equally performing strategies that differ only in a separate, but equal degree of preference for their primary goals. In the absence of well defined business rules quantifying the value of performance in each metric, specific statements of balance between metrics are difficult.
A potential drawback of Util-DSS when compared to the Hybrid strategy is the 34% increase in number of migrations. Although the migration count of each strategy falls far below the migration count observed in the Minimization of Migrations algorithm (evaluated in Table 2), it may be the case that in a situation where network bandwidth is highly constrained, this increase in frequency of migrations would deteriorate the performance of Util-DSS. It is likely that this increase in migration count of Util-DSS over Hybrid is due to the aggressiveness of the consolidation brought on by switching to, and operating under, the Power strategy over the course of Util-DSS’s operation. This is supported by the much larger number of migrations observed when the Power strategy is run in isolation (See Table 2).
![Table 1: A comparison of two of the VM relocation policies [14]](https://thumb-us.123doks.com/thumbv2/123dok_us/7790152.1290450/32.612.176.468.136.279/table-comparison-vm-relocation-policies.webp)
![Table 3: Experimental results comparing Util-DSS and Hybrid management strategies. Result data drawn from previous publication of these experiments by this author and others [26]](https://thumb-us.123doks.com/thumbv2/123dok_us/7790152.1290450/53.612.108.538.154.408/experimental-results-comparing-management-strategies-previous-publication-experiments.webp)