A Comparative Study of Artificial Neural
Network Based Power Quality Signal
Classification Systems with Wavelet
Coefficients and Wavelet Based Energy
Distribution
Praveen Sebastian1, Abhishek Pradeep2
Assistant Professor, Dept. of EEE, BNM Institute of Technology, Bangalore, Karnataka, India1
Assistant Engineer, Inphase Power Technologies Pvt.Limited, Bangalore, Karnataka, India2
ABSTRACT: In this paper a comparative study has been done for the classification of power quality events using wavelet coefficients and wavelet based energy distribution. So for the feature extraction the parameters considered were wavelet coefficients and wavelet energy distribution up to 10 levels. The classification was done using Artificial Neural Network algorithm in both the cases since it is very effective in classification and pattern recognition applications.
KEYWORDS: Discrete wavelets transform, wavelet Energy, Power Quality classification, artificial neural network, comparative study using wavelets.
I.INTRODUCTION
There has been an enormous growth in the converter based power conversion techniques in the past decade. All these devices are capable of introducing some disturbances in to the system which can affect the quality of voltage or current. Therefore Power Quality is considered as an important term in power system. The monitoring and analysis of voltage waveforms or current waveforms is of great importance because then only the appropriate mitigation methods for the disturbances can be suggested.
FT is still an effective tool for analysing the power quality disturbances in frequency domain. But the main drawback with FT is it is a frequency domain analysis and no time based information can be extracted from signals. It gives a clear picture of the frequency spectra of signals but no information regarding where in time axis the frequency components exist.Eventhough Short Time Fourier Transform (STFT) can be used for the time frequency analysis of signals, itis not effective for short duration transient signals since the transform uses a fixed window for the computation. To improve the limitations of FT the Wavelet Transform has been proposed which makes use of a varying window so that transient disturbance analysis can be done in a better way. Precise time features can be extracted like starting and Ending time of disturbances along with frequency informations regarding the signals.
II. WAVELET DECOMPOSITION
Usually in Short Time Fourier Transform the computation will be performed using a kernel using which the convolution with the signals will be done for finding the coefficients. This kernel is known as a window which is of fixed width in case of STFT.So to analyze a signal consists of multiple frequency STFT can be used so a time frequency analysis can be achieved.Here time and frequency resolution that we can obtain is of great importance.This is a criteria based on which an effective method can be suggested for the analysis of the signal.But when coming to transient signals which may have a sudden change in its magnitude within a short duration of time,analysis using STFT may not be very effective.
Wavelet is the basic entity of wavelet transform. Wavelets are basically short duration transient signals having irregular shapes. Wavelet transform has an advantage in this aspect. In wavelet transform the window width can vary depending upon the frequency of the signal. For example if we have a signal consists of a low frequency part and high frequency part we need good frequency resolution for low frequency part and good time resolution for high frequency part. The WT at low frequency provides accurate frequency resolution and poor time resolution, and at high frequency, WT gives accurate time resolution and bad frequency resolution [8].In another way good time resolution can be achieved by narrow windows and good frequency resolution can be achieved by wide windows. Using wavelet analysis signal compression, edge or spike detection can be done effectively.
Multi Resolution Analysis (MRA) is the basic principle behind wavelet transform. In MRA analysis the signals are analysed at different frequencies at different resolutions. Signal analysis can be done using different wavelets each having its own advantages and disadvantages. Usuallypower quality signal analysis can be done effectively with Daubechies wavelets especially in case of transient disturbance analysis.
γ
(s,τ
)=
ʃ
( )
∗
,(t) dt
(1)
The first equation represents the class of functions that we get from different values of r and s. These class of functions are known as wavelet functions and τ are integers where s is known as scaling parameter and τ is known as shifting parameter.
ψ
(x)=
Σ
nh
ψ(n)
√2φ(2x
n)
(2)
This equation gives the relationship between wavelet function and scaling function. So a wavelet function can be derived using shifted version of scaling functions of next higher order of half the width. A Function f(x) can be realized using the equation
f(x)=∑ , , ( )+∑ ∑ , ψ , ( ) (3)
This is known as wavelet series. Where the function is expressed in terms of scaling functions , ( ) and wavelet functions ψ , ( )
The wavelet coefficients , and ,can be found by the following equations
, =∫ ( )∅ , ( ) (4)
, =∫ ( ) , ( ) (5)
Approximate and detail coefficients:
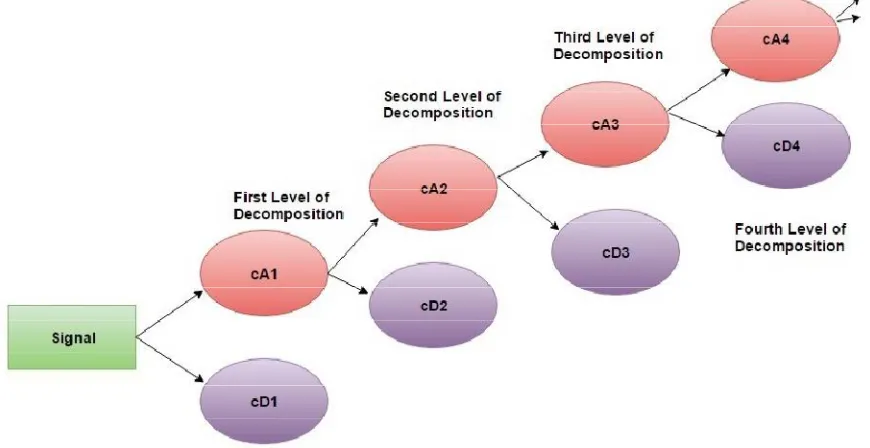
In Discrete Wavelet Transform the signal can be written in terms of two coefficients coefficients. The first coefficient which is associated with the scaling function is known as approximation coefficient and the second one, which is associated with wavelet function, is known as detail coefficient. Approximation and detail coefficients are the low pass and high pass representation of the signal respectively. Multi Resolution Analysis means the signal is decomposed in to desired levels of these two coefficients. After ’N’ levels of decomposition there will be N number of detailed coefficients and one approximate coefficient. Because at each level, only the approximate coefficient will be divided in to next levels of these coefficients. The figure shows this division of any signal into these two coefficientsFig. 1. cA and cD represent the approximation and detail coefficients.The numbers 1,2,3,4 represent the levels of decomposition.
Fig. 1. Decomposition of a signal into approximation and detail coefficients
Simulation of power quality disturbances and wavelet Analysis using MATLAB:
Total 9 common power quality disturbances were simulated using standard equations [8].The sampling frequency of simulated disturbances was 10kHz and the RMS value considered was 230 V.
Artificial Neural Network based Power Quality Disturbance Classification system using wavelet coefficients:
target output classes. We can test the performance of Neural Network by changing the number of neurons in hidden Layer and thus can find the best performance of designed network. An overall accuracy of 97.1 % could be achieved using the designed neural system.
Energy contents in simulated power quality events during 10 Levels of decomposition using Parsevals theorem:
The energy of the signal at each level of the wavelet transform coefficients can be separated in time and frequency in Discrete Wavelet Transform (DWT). So the energy in disturbance waveforms in each scale of the wavelet coefficients can be calculated using the Parsevals theorem [9] by the following expression.
l
i
D
A
t
x
N
t Nj i j N i j0,1,2....
=
;
)
(
)
(
=
)
(
1/
2
=1 , 2
1 , 2(6)
The first term on Right Hand Side is the average power of the approximated version of the decomposed signal and the second term is that of the detailed version of the decomposed signal.The second term in the equation contains maximum required information so it can be used to extract features from distorted PQ signals. The Parsevals theorem in the DWT application can be implemented by separating the total energy of the discrete time domain signal.
Disturbance
1
D
E
E
D2E
D3E
D4E
D5E
D6E
D7E
D8E
D9E
D10 DC Offset 0 0 0 0 0 0.0002 0.0032 0.0004 0 0 Flicker 0 0 0 0 0.0005 0.0572 0.8076 0.1107 0.0020 0.0029 Outage 0 0 0.0001 0 0.0003 0.0001 0.0013 0.0004 0.0063 0.0222 Sine 0 0 0 0 0.0005 0.0545 0.8111 0.1047 0.0019 0.0035 Harmonic 0 0.0002 0.0119 0.0379 0.3979 0.4113 0.0003 0.0005 0.0009 0.0019 Sag 0 0 0 0 0.0005 0.0548 0.8073 0.1063 0.0023 0.0035 Swell 0 0 0 0 0.0005 0.0542 0.8166 0.1028 0.0020 0.0036 SagHarmonics
0 0.0012 0.0756 0.1792 0.4820 0.0006 0.0004 0.0008 0.0016 0.0032
Swell Harmonics
0 0.0012 0.0793 0.189 0.5081 0.0005 0.0004 0.0007 0.0013 0.0027
Table 1: Energy contents in power quality Signals for 10 levels of decomposition
Each disturbance has a unique detailed energy distribution. Energy contents of detail coefficients were found using MATLAB.It is shown in Table 1.
Artificial Neural Network(ANN) based power quality disturbance classification system using energy contents of detailed coefficients:
Accuracy of classification system using Wavelet coefficients:
The accuracy of the system is given below in the table 2.
Sl No Disturbance Accuracy(%)
1 DC offset 100
2 Flicker 96.5
3 Outage 94.6
4 Pure Sine 100
5 Sag 95.4
6 Swell 95
7 Harmonics 100
8 Sag with Harmonics 95
9 Swell with Harmonics 98
Overall accuracy 97.61
Table 2: Accuracy of the signal classification system using wavelet coefficients
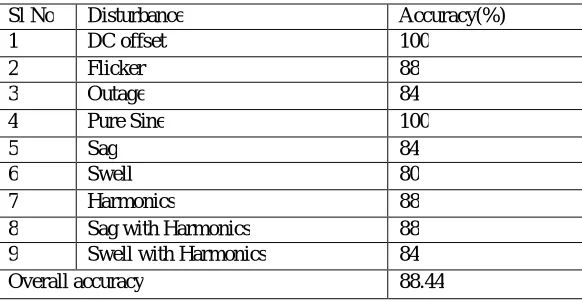
Accuracy of classification system using Energy distribution of detailed coefficients:
The accuracy of the system is given below in the table 3.
Sl No Disturbance Accuracy(%)
1 DC offset 100
2 Flicker 88
3 Outage 84
4 Pure Sine 100
5 Sag 84
6 Swell 80
7 Harmonics 88
8 Sag with Harmonics 88
9 Swell with Harmonics 84
Overall accuracy 88.44
Table 3: Accuracy of the signal classification system using energy distribution of detailed coefficients
III. CONCLUSION
The accuracy for the classification system in using wavelet coefficients was 97.61%.The other one, using energy content of detailed coefficients yielded an accuracy of 88.4% only. So the energy content of detailed coefficients alone is not sufficient for an accurate classification system using artificial neural network.
IV. FUTURE WORK
The accuracy for the classification system using wavelet coefficients is a proved one but for the other system to improve the accuracy, more parameters have to be included together with energy content of detailed coefficients, which can be done as a future work and the accuracy can be checked again. The accuracy for these two methods can also be compared for an algorithm other than a neural network based one. The systems can be tested again for other wavelets also.
REFERENCES
[1] S.A. Deokar,L.M. Waghmare “Integrated DWTFFT approach for detection and classification of power quality disturbances”,International Journal of Electrical Power and Energy Systems,Volume 61,Pages 594605,May 2014.
[2] Julio Barros,Matilde de Apraiz and Ramn I. Diego, A virtual measurementinstrument for electrical power quality analysis using wavelets, Science Direct, Measurement, Volume 42, Issue 2, Pages 298-307,, February 2009.
[3] Liang Wah,Cheok and Tapan Kumar Saha, Power Quality Investigation with Wavelet Techniques, ResearchGate, 2000.
[4] A. Bennett,A.T.Johns,Q.Y. Xuann,R.K Aggarwal,R. W. Dunn,“A Novel Classification Technique for Double-circuit lines Based on Combine Unsuper- vised/Supervised Neural Network”,IEEE Transactions on Power Delivery,Volume 14, No. 4,Pages 1250-1255, 1999.
[5] Rodney H.G. Tan and V.K. Ramachandaramurthy, “Simulation of Power Quality events using Simulink model”, 7th International IEEE Conference on Power Engineering and Optimization(PEOCO), Pages:277 – 28,2013.
[6] Hong-Tzer Yang and Chiung-Chou Liao, “A De-Noising Scheme for Enhancing Wavelet-Based Power Quality Monitoring System”, IEEE Transactions on Power Delivery,Volume 16, No. 3,Pages: 353 – 360, July 2001.
[7] Murat Uyar, Selcuk Yildirim,Muhsin Tunay Gencoglu “An effective wavelet-based feature extraction method for classification of power quality disturbance signals”, Electric Power Systems Research,Volume 78,Elsevier,Pages: 1747-1755.
[8] D. Saxena, S.N. Singh,K.S. Verma “Wavelet based denoising of power quality events for characterization”, International Journal of Engineering, Science and Technology,Vol. 3, No. 3, Pages. 119-132, 2011
[9] Li Penghui, Zhao Lijie, Bai Haijun, Zhang Yanhua , Power Quality Monitoring of Power System Based on Spectrum Analysis,IEEE International Conference on E-Product E-Service and E-Entertainment (ICEEE), 2010