Automatic Assessment of Japanese Text Readability
Based on a Textbook Corpus
Satoshi Sato, Suguru Matsuyoshi, Yohsuke Kondoh
Department of Electrical Engineering and Computer Science Graduate School of Engineering
Nagoya University
Chikusa-ku, Nagoya, 464-8603, JAPAN
[email protected],{matuyosi,kondoh}@sslab.nuee.nagoya-u.ac.jp
Abstract
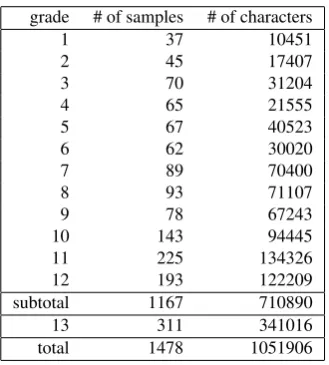
This paper describes a method of readability measurement of Japanese texts based on a newly compiled textbook corpus. The textbook corpus consists of 1,478 sample passages extracted from 127 textbooks of elementary school, junior high school, high school, and university; it is divided into thirteen grade levels and the total size is about a million characters. For a given text passage, the readability measurement method determines the grade level to which the passage is the most similar by using character-unigram models, which are constructed from the textbook corpus. Because this method does not require sentence-boundary analysis and word-boundary analysis, it is applicable to texts that include incomplete sentences and non-regular text fragments. The performance of this method, which is measured by the correlation coefficient, is considerably high (R > 0.9); in case that the length of a text passage is limited in 25 characters, the correlation coefficient is still high (R= 0.83).
1.
Introduction
Assessment of text readability is useful to know whether a text is written at a level suitable for the target audience. For English texts, there are well-known measures such as Flesch Reading Ease and Flesch-Kincaid Grade Level, and they are used for several applications such as compilation of reading materials for students. The Unix commandstyle calculates scores of seven different readability measures for a given text.
Recently, we pay much attention to readability of web pages, because the Web is now an important infrastruc-ture of information exchange. Web Accessibility Initia-tive is working on the draft of “Web Content Accessibility Guidelines 2.01”, where the following recommendation is described.
3.1.5 Reading Level: When text requires reading ability more advanced than the lower secondary education level, supplemental content, or a ver-sion that does not require reading ability more ad-vanced than the lower secondary education level, is available.
To satisfy the above recommendation, we need a readability measure that produces aschool grade level.
Readability measures that do not require sentence analysis are preferable for web pages, because they have many in-complete sentences and non-regular text fragments, such as titles, itemized lists, inline figures, and URLs. On the web siteTxReadability2 at the University Texas at Austin,
For-cast Grade Level, a no-sentence-analyzing measure, is used for readability measurement of English web pages. For Japanese texts, a few readability measures have been proposed (Tateisi et al., 1988a; Tateisi et al., 1988b; Shibasaki and Sawai, 2007), none of which is widely used.
1http://www.w3.org/TR/WCAG20/ 2
http://www.lib.utexas.edu:8080/TxReadability/app?service= page/Home
It may be because there is little interest in readability in Japan and no software tools are available in public. In order to fill the lack, we have implemented an easy-to-use tool for readability measurement of Japanese texts. This paper presents a Japanese textbook corpus, which we have compiled as a criterion for readability assessment, and a method of readability measurement by using character-unigram models.
2.
Related Work
2.1. Formula-Based Approach
The traditional approach of readability assessment uses readability formula, where selected important factors are considered. For example, Flesch Reading Ease (Flesch, 1948) is calculated by the following formula,
“Flesch Reading Ease”=
206.835−84.6wl−1.015sl (1)
wherewlmeans word length, the average number of syl-lables per word, and sl means sentence length, the aver-age number of words per sentence. Flesch-Kincaid Grade Level, which translates the above score into a U.S. grade level, is calculated by the following formula.
“Flesch-Kincaid Grade Level”=
0.39sl+ 11.8wl−15.59 (2)
To compute these measures correctly, perfect detection of sentence boundaries is required, because they consider sen-tence length. Some measures do not require such sen-tence analysis. For example, Forcast Grade Level, which is calculated by the following formula, requires only word-boundary detection.
“Forcast Grade Level”=
20−# of one-syllable words out of 150 words
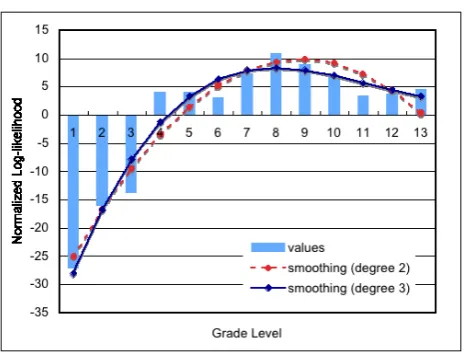
Figure 1: 13 log-likelihood values and their smoothing
3. With smoothing (degree 3):
Same as above except a polynomial of degree 3 instead of a polynomial of degree 2.
4. Median:
Select the median among three estimated grades ob-tained by the above three variants.
5.
Evaluation
To confirm the reliability of our method, we have conducted a series of experiments.
5.1. Leave-One-Out Cross-Validation
First, we have conducted leave-one-out cross-validation for each of sixteen cases, which are the combination of the fol-lowing settings.
1. corpus
(a) the twelve-grade textbook corpus
(b) the thirteen-grade textbook corpus
2. variant for final estimation
(a) without smoothing
(b) with smoothing (degree 2)
(c) with smoothing (degree 3)
(d) median
3. operative characters
(a) Hiragana, Katakana, and Kanji
(b) excluding Katakana (i.e., Hiragana and Kanji)
For each case, we have calculated the correlation coeffi-cient (R) and the root mean square error (RMSE) between the actual grade levels and the estimated grade levels. Ta-ble 2 shows the result. This taTa-ble also shows the correlation coefficient when we use Tateisi’s formula4.
From Table 2, we can see the followings.
4
In the calculation of Tateisi’s formula, we ignore incomplete sentences such as title and header, and non-regular text elements such as mathematical formula.
corpus
12-grade 13-grade
R RMSE R RMSE
operative characters = Hiragana, Katakana, and Kanji without smoothing 0.883 1.646 0.900 1.620 with smoothing
(degree 2) 0.888 1.606 0.885 1.794 (degree 3) 0.889 1.697 0.900 1.686 median 0.905 1.459 0.919 1.441 operative characters = Hiragana and Kanji
without smoothing 0.880 1.661 0.898 1.632 with smoothing
(degree 2) 0.889 1.596 0.882 1.817 (degree 3) 0.887 1.724 0.898 1.691 median 0.903 1.484 0.916 1.469 Tateisi’s formula -0.758 N/A -0.758 N/A
Table 2: Result of leave-one-out cross-validations
1. Every variant of our method is superior than Tateisi’s formula; the correlation coefficient of our method is over 0.88, while one of Tateisi’s formula is around 0.76.
2. Themedianvariant is the best among four variants of our method. While smoothing does not always im-prove the performance, taking the median of three es-timated values improves the performance.
3. The performance when Katakana characters are ex-cluded from the operative characters is competitive to the performance when Katakana characters are in-cluded.
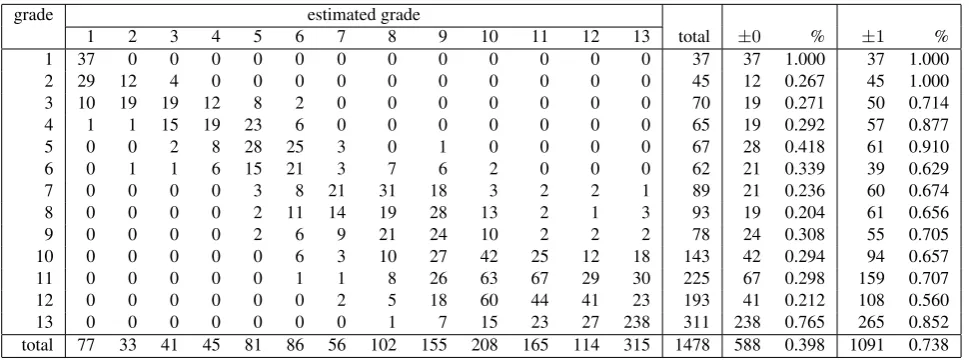
Table 3 and 4 show theclassificationresult of the best case for each corpus. From these tables, we can see that the classificationaccuracy is not high. In case of the thirteen-grade corpus, the ratio of samples whose thirteen-grade levels are correctly estimated is 39.8%. If we allow plus/minus one level error, the ratio becomes 73.8%. This fact is also con-firmed by the fact that RMSE is 1.441.
In summary, overall performance of our readability ana-lyzer is very well (R >0.9); however, each estimated grade is not so accurate (RMSE≈1.5).
5.2. Thirteenth Grade
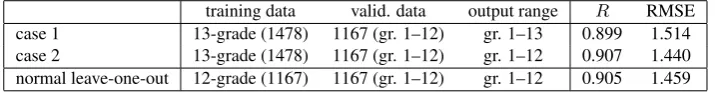
Next, we have confirmed that introduction of the thirteenth grade does not give a bad influence on the estimation of other grades, because the text sources of the thirteenth grade are different from those of other grades. From Ta-ble 4, we calculated the correlation coefficients and RMSEs for the following cases.
1. Case 1: 1,167 samples (grade 1–12) are used for val-idation data, where the output range is between 1 and 13.
grade estimated grade
1 2 3 4 5 6 7 8 9 10 11 12 total ±0 % ±1 %
1 37 0 0 0 0 0 0 0 0 0 0 0 37 37 1.000 37 1.000
2 34 8 2 1 0 0 0 0 0 0 0 0 45 8 0.178 44 0.978
3 15 15 17 13 8 2 0 0 0 0 0 0 70 17 0.243 45 0.643
4 1 2 10 23 23 5 1 0 0 0 0 0 65 23 0.354 56 0.862
5 0 0 2 9 28 25 2 1 0 0 0 0 67 28 0.418 62 0.925
6 0 2 0 4 16 23 1 7 5 3 1 0 62 23 0.371 40 0.645
7 0 0 0 0 1 10 20 32 18 2 4 2 89 20 0.225 62 0.697
8 0 0 0 0 2 9 16 28 18 10 8 2 93 28 0.301 62 0.667
9 0 0 0 0 1 6 11 27 15 6 6 6 78 15 0.192 48 0.615
10 0 0 0 0 0 6 3 16 32 39 25 22 143 39 0.273 96 0.671
11 0 0 0 0 0 1 2 15 23 39 88 57 225 88 0.391 184 0.818
12 0 0 0 0 0 0 3 7 15 38 64 66 193 66 0.342 130 0.674
total 87 27 31 50 79 87 59 133 126 137 196 155 1167 392 0.336 866 0.742
Table 3: Classification result (twelve-grade corpus; median)
grade estimated grade
1 2 3 4 5 6 7 8 9 10 11 12 13 total ±0 % ±1 %
1 37 0 0 0 0 0 0 0 0 0 0 0 0 37 37 1.000 37 1.000
2 29 12 4 0 0 0 0 0 0 0 0 0 0 45 12 0.267 45 1.000
3 10 19 19 12 8 2 0 0 0 0 0 0 0 70 19 0.271 50 0.714
4 1 1 15 19 23 6 0 0 0 0 0 0 0 65 19 0.292 57 0.877
5 0 0 2 8 28 25 3 0 1 0 0 0 0 67 28 0.418 61 0.910
6 0 1 1 6 15 21 3 7 6 2 0 0 0 62 21 0.339 39 0.629
7 0 0 0 0 3 8 21 31 18 3 2 2 1 89 21 0.236 60 0.674
8 0 0 0 0 2 11 14 19 28 13 2 1 3 93 19 0.204 61 0.656
9 0 0 0 0 2 6 9 21 24 10 2 2 2 78 24 0.308 55 0.705
10 0 0 0 0 0 6 3 10 27 42 25 12 18 143 42 0.294 94 0.657
11 0 0 0 0 0 1 1 8 26 63 67 29 30 225 67 0.298 159 0.707
12 0 0 0 0 0 0 2 5 18 60 44 41 23 193 41 0.212 108 0.560
13 0 0 0 0 0 0 0 1 7 15 23 27 238 311 238 0.765 265 0.852
total 77 33 41 45 81 86 56 102 155 208 165 114 315 1478 588 0.398 1091 0.738
Table 4: Classification result (thirteen-grade corpus; median)
Table 5 shows the result. The performance of Case 1 is worse than one of the normal leave-one-out with the twelve-grade corpus, because of the wider output range (i.e., grade 1–13). However, when we tune the output range to 1–12 (Case 2), the performance is competitive to (slightly better than) one of the normal leave-one-out with the twelve-grade corpus.
5.3. Readability Estimation from Short Passages
A desirable characteristic of our method is less sensitivity to passage length. Table 6 shows the correlation coeffi-cients and RMSEs when we restrict the length of the tar-get passages.5 Even if we use only the first 25 characters (it approximately corresponds to ten words in English) of each target passage, the correlation coefficient is still high (R= 0.829).
5.4. Readability Estimation of Web Pages
The results of the cross-validations described above show our readability analyzer works well within the textbook cor-pus. Lastly, in this subsection, we describe the readability
5
In this experiment, we use only 1,286 samples that contain more than 250 characters as validation data.
estimation of web pages. For all experiments, we use the thirteen-grade corpus as training data and the median vari-ant for the final estimation.
5.4.1. Weekly Kids News
A TV news show named “Shukan Kodomo News (Weekly Kids News)” has a web site6, where new stories talked in
the TV shows are provided as texts. We have collected 389 news stories from this site; the average size of a news story is about 1,600 characters. The target audience of this TV show is not explicitly announced, however, we estimate that it is junior high school students (grade 7–9).
Table 7 shows the results of readability estimation of 389 stories. The estimated grades of the most of stories fall between 6 and 9; the average is 8.43. This result shows that our readability analyzer works well beyond the textbook corpus.
In this experiment, we found that our analyzer tends to overestimate readability when new stories contain many Katakana characters. Table 7 also shows the result in case we exclude all Katakana characters from the operative char-acters. By excluding Katakana characters, the readability
6
training data valid. data output range R RMSE case 1 13-grade (1478) 1167 (gr. 1–12) gr. 1–13 0.899 1.514 case 2 13-grade (1478) 1167 (gr. 1–12) gr. 1–12 0.907 1.440 normal leave-one-out 12-grade (1167) 1167 (gr. 1–12) gr. 1–12 0.905 1.459
Table 5: Influence of thirteenth grade
passage length (characters) 5 10 15 20 25 50 100 150 200 250 R 0.636 0.750 0.806 0.810 0.829 0.857 0.883 0.897 0.907 0.907 RMSE 2.879 2.308 2.039 2.009 1.918 1.777 1.617 1.506 1.428 1.411
Table 6: Readability estimation from short passages
analyzer becomes stable. We do not have a solid answer why such phenomena is observed at this moment. A pos-sible answer is that the textbook corpus does not contain enough amount of Katakana characters.
5.4.2. Other Web Pages
There are a small number of Japanese web pages in which their target audiences are declared, and finding such pages is not an easy task. By one-day hunting for such pages, we have found 268 pages in 29 sites. They declare that their target audience is any one of elementary school, junior high school, and high school; no exact grade level is described. Table 8 shows the summary of the experiment. From this table, we can see that estimations by our readability an-alyzer almost agree with readability declarations by web page owners. The phenomena that excluding Katakana characters from the operative characters makes the read-ability analyzer stable is also observed in this experiment.
6.
Software Tool and Web Interface
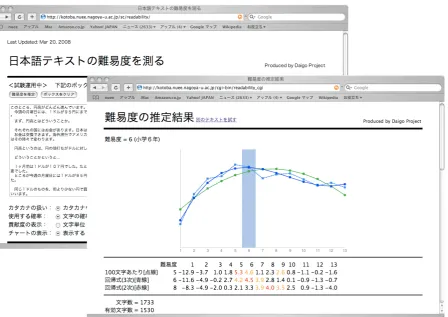
Our readability analyzer consists of a Perl program and a model file that contains the normalized conditional prob-abilities of all operative characters of thirteen language models, which are calculated from the thirteen-grade text-book corpus. The program can be executed on a stan-dard Unix environment. We also provide a web interface at http://kotoba.nuee.nagoya-u.ac.jp (Figure 2), where you can examine the readability of Japanese texts easily. Our readability analyzer requires no sentence-analysis and word-analysis; it looks only the limited number of operative characters. This simplicity is useful for practical situations; we just input a raw text file or HTML file in “as is” style.
7.
Conclusion
In this paper, we have described a method of readability measurement of Japanese texts based on a newly compiled textbook corpus. The cross-validation experiments have shown that the performance of out method is considerably high measured by the correlation coefficient (R >0.9); in case that the text passages are limited in 25 characters, the correlation coefficient is still high (R = 0.83). The other experiments with the web pages show that our method pro-duces reasonable estimations for web texts, which are com-pletely different from textbooks in text type.
The most important characteristic of our method is that it is robust because it does not require any sentence and word-boundary analysis; it is applicable to any Japanese texts in “as is” style.
8.
References
Kevyn Collins-Thompson and Jamie Callan. 2004. A lan-guage modeling approach to predicting reading diffi-culty. InProceedings of the HLT/NAACL 2004 Confer-ence, pages 193–200.
Fudolf Flesch. 1948. A new readability yardstick.Journal of Applied Psychology, 32(3):221–233.
Yoshihiko Hayashi. 1992. A three-level revision model for improving Japanese bad-styled expressions. In Proceed-ings of the 14th Conference on Computational Linguis-tics, volume 2, pages 665–671.
Hideko Shibasaki and Yasutaka Sawai. 2007. Study for constructing a readability formula of Japanese texts us-ing a corpus of language school textbooks. IEICE Tech-nical Report NCL2007-32, The Institute of Electron-ics, Information and Communication Engineers. (in Japanese).
Yuka Tateisi, Yoshihiko Ono, and Hisao Yamada. 1988a. A computer readability formula of Japanese texts for ma-chine scoring. InProceedings of the 12th Conference on Computational Linguistics, volume 2, pages 649–654. Yuka Tateisi, Yoshihiko Ono, and Hisao Yamada. 1988b.
estimated grade
operative characters pages 5 6 7 8 9 10 11 12 13 avg. σ2 Hiragana, Katakana, and Kanji 389 1 34 46 106 165 10 15 5 7 8.43 1.83 Hiragana and Kanji 389 2 30 47 137 164 8 0 0 1 8.19 1.01
Table 7: Readability estimation of Weekly Kids News
estimated grade
pages 3 4 5 6 7 8 9 10 11 12 13 avg. σ2 operative characters = Hiragana, Katakana, and Kanji
elementary school (gr. 1–6) 135 2 16 29 21 14 29 16 2 1 3 2 6.73 4.27 junior high school (gr. 7–9) 78 1 5 11 30 17 6 7 1 9.38 1.90
high school (gr. 10–12) 55 2 15 20 9 9 10.47 2.32
operative characters = Hiragana and Kanji
elementary school (gr. 1–6) 135 4 16 30 26 15 28 12 1 1 2 6.40 3.38 junior high school (gr. 7–9) 78 1 5 11 33 18 6 3 1 9.24 1.54
high school (gr. 10–12) 55 3 14 21 3 7 7 10.33 2.07
Table 8: Readability estimation of web pages