Bachelor Thesis
Capturing, processing, interpreting
and disseminating real-time traffic
information from GPS enabled online
mobile devices
Document
Bachelor Thesis
Title
Capturing, processing, interpreting and disseminating real-time traffic information from GPS enabled online mobile devices
Author
Roel Wessels
Date
December 2008
Project Sponsor
Globosys BV, Amsterdam
Supervisor (Sponsor)
Drs. J.L. (Jorge) Schafraad
Supervisor (University)
Summary
The availability of having accurate, real-time traffic information is increasingly
important in countries which cope with traffic congestion. This information is vital for both road users (for route choice) and road operators (for network management). Currently, route operators mainly use static systems such as loop detectors and video surveillance to monitor the road network. While these have very high accuracy and availability, they are costly (in installation and maintenance) and therefore only installed on a limited part of the highway network.
This thesis focuses on a system that can generate traffic information for a larger part of the road network by using vehicle based data, instead of the aforementioned roadside systems. The system uses mobile phones carried by drivers to capture position
information. Mobile phones with a GPS sensor and wireless internet connection are becoming mainstream in modern day telecommunication and therefore provide a
perfect platform to acquire the data required for accurate, real-time traffic information.
In the scope of this thesis an end-to-end prototype of such a traffic information system was developed. It enables car drivers to send their position, speed and bearing data to a central server which processes and interprets this data to provide network flow and congestion information. This information is then disseminated to a mobile device or to a web-based viewer.
Furthermore, to calibrate and validate the prototype, a simulation package was developed that simulates multiple vehicles and drivers carrying a mobile phone with GPS and wireless connection travelling over the road network. Real life tests were conducted to confirm the correct operation of the prototype.
Table of contents
1. Preface ... 9
2. Introduction ... 11
2.1 Research objectives ... 12
2.2 Research questions ... 12
3. System functionalities ... 13
4. Capturing data ... 15
4.1 Mobile devices ... 15
4.2 Client software ... 18
5. Processing data ... 21
5.1 Introduction to GIS ... 21
5.2 Road network ... 24
5.3 Database Design ... 25
5.4 Map matching ... 28
6. Interpreting data ... 35
6.1 Introduction ... 35
6.2 Generating traffic information ... 37
6.3 Segment length and polling interval ... 39
7. Disseminating information ... 41
7.1 Globocator Mobile version ... 41
7.2 Globocator Browser version ... 42
8. Simulation and Testing ... 43
9. Results and Conclusions ... 47
10. Recommendations ... 49
11. Further remarks and thoughts ... 51
12. List of references ... 55
1. Preface
This thesis focuses on a system that can generate traffic information based on position reports from users with a mobile phone equipped with a wireless internet connection and GPS. The prototype that was developed can be accessed via the internet. Before reading this thesis, it is highly recommended to first visit the website to gain a first impression of the system. It will greatly enhance your understanding of the chapters about the database, algorithm and application design of the prototype.
This ‘Globocator’ software suite can be accessed on its dedicated server via the URL:
http://www.globocator.com
I would like to thank Tom Thomas, who acted as supervisor at the University of Twente, for his support and insight in the all the situations that the devised algorithms needed to cope with and moreover for giving me the time extension required to develop the simulator.
Foremost I would like to thank Jorge Schafraad for giving me the opportunity to develop the prototype of the system for his company, Globosys. Your patience, good ideas and practical solutions proved to be very useful.
2. Introduction
Traffic jams and other traffic flow interruption usually relate to an increase in transport demand and occur where the accompanying road networks are limited in capacity. Traffic congestion accounts for huge economic losses and cause frustration to travellers. Therefore governments and road operators, have systems in place to generate information on traffic flows.
Traditionally, these systems consist of costly loop detectors that are placed on certain key parts of the road network to provide traffic flow information. These systems are hard to maintain and due to their limited placement, do not provide complete information of the traffic flows. Advancements have been made using video surveillance, even combined with license plate recognition to provide more fidelity.
While these newer systems provide very accurate information, due to their cost, they will only be placed on roads which play a major role in a countries’ road network, such as highways. In The Netherlands it is common to see information displays above the highway which provide travel time information based on the gathered data or receive to receive this information via the FM radio in the vehicle. This type of traffic information is also welcome on smaller roads and at a higher accuracy, in more real-time.
Since the introduction of the GSM phone network in 1991, cell phone usage is continually increasing and will probably exceed 2,3 billion users worldwide at the end of 2007. The newer generations of cell phones have all types of sensors included. One of this, which is becoming common in mainstream ‘smart’ phones, is a GPS receiver. Using this receiver it is possible to get position data that has an accuracy of within meters.
2.1
Research objectives
The objective is to design and develop an end-to-end prototype of a traffic information system which enables car drivers to send their position, speed and bearing data to a central server which processes and interprets this data to provide network flow and congestion information back to the car drivers.
The geographical scope of the prototype covers the A35 East- and Westbound, covering the highway connection between Almelo and Enschede in The Netherlands.
2.2
Research questions
2.2.1
Main question
How can real-time position data from GPS enabled online mobile devices be captured, processed and interpreted to provide network flow and congestion information for car drivers?
2.2.2
Sub questions
What system functionalities are necessary to capture the data on the client-side and to process and interpret the data on the server-side?
What road network data is publicly available that can be used in the data model on the server and user interface of the client side?
3. System functionalities
For a complex system like this, it is best to describe it according to the functionalities it should have. This means that actual software implementation is not decided yet, therefore leaving most options open at an early state.
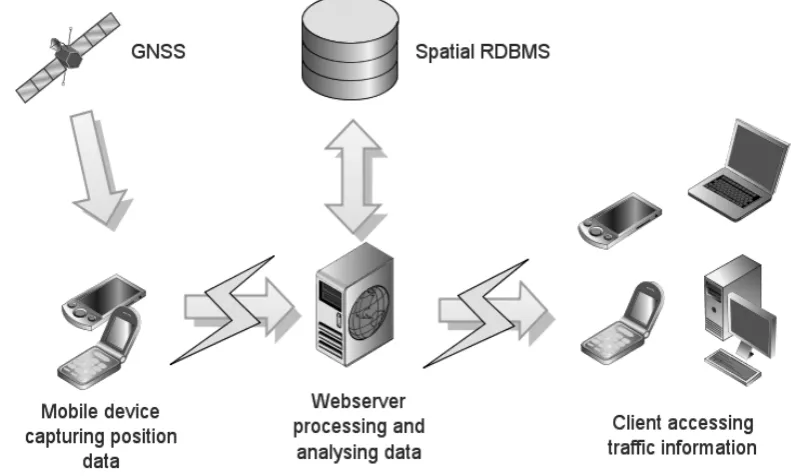
The first functionality is to capture position data of drivers that are driving on roads. Secondly this data should be processed and stored in such a way that it can be used later. This data can then be analysed and interpreted to convert it into actual traffic information. Finally, this information is sent and displayed to users that want to access this information.
These functionalities will be accomplished by using data from mobile devices that can acquire position information by using the signals from satellites from a Global
Navigation Satellite System (GNSS). This position data is captured by software running on the mobile device, which sends reports of the position to a web server at a certain time interval. The report is sent using any available wireless connection at the time of the report.
The second functionality is provided by software running on the web server. When a position report is received, the position is matched to a position on a digital road map that is available on the web server. The position report, together with its matched position, is stored for later use. It is stored using a spatial relational database management system, which is essentially a digital data repository that can handle geographical information.
The third functionality is also provided by software on that runs on the web server. Using the stored reports of all users, the position data is processed to actual traffic flow information by using certain algorithms.
Finally, the last functionality is provided by the web server which sends the network flow and congestion information back to the user. This user can be the same user that has just sent his position report from his mobile device and who wants on-trip traffic information, but could also be a user that accesses this information from a wired connection at home using this traffic information pre-trip.
processing and interpretation is done on another computer. This model where multiple devices connect and send to a central computer is commonly known as the client-server model. The mobile device is the client, which sends data to and receives data from the central web server.
A graphical representation of the system is depicted in figure 1 below.
Figure 1 - System overview
In the remainder of this thesis the subparts of the system will be described. First the theoretical background of each part is given based on findings of the literature study. These chapters are divided based on the system functionalities which are, in logical order, capturing, processing and interpreting the incoming data and finally
disseminating the traffic information to the users.
4. Capturing data
In the previous chapter the system functionalities were outlined. The first functionality is that of capturing data. This means that the geographical location of a driver needs to be known, so that a report can be sent to the server, which is in turn used for the generation of traffic information. These reports should include data which will act as input variables later on. A ‘position report’ is thus a message sent from the client which contains essential data about the ‘state’ of a user. A report contains information like, position, speed and the date and time it was sent.
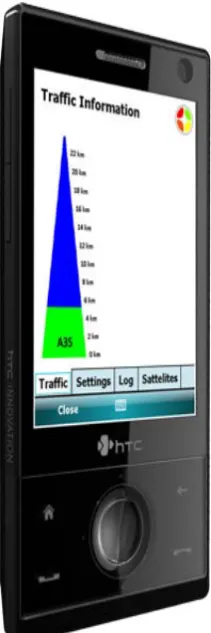
The position reports will be generated on, and sent from, a mobile device. This is usually a cell phone (Figure 3) that is equipped with a sensor that can locate the device using a Global Navigation Satellite System and a wireless connection over which the derived data can be sent. Software is used to perform the process of connecting to the positioning sensor and gathering data from it. The software will generate a position report and send it to the server using any available wireless connection. In this chapter, an overview of the mobile device and the software is given.
4.1
Mobile devices
Ever since the first cell phones appeared on the consumer market in the early 90s, the devices were continually improved, offering more and more capabilities. Nowadays, relatively cheap cell phones are packed with a GNSS sensor and wireless data
connections systems. The monthly plans for unlimited data use have dropped in price dramatically in the last years, making it possible to have a large user base providing the system with data.
4.1.1
GPS sensor system
The most commonly used positioning system in cell phones uses the Global Positioning System (GPS) developed by the American Department of Defence. The GPS receiver sensor can calculate its position by carefully timing the signals sent by the constellation of GPS satellites in orbit around the earth.
Each satellite transmits messages containing the time the message was sent, the precise orbit of the particular satellite (called the ephemeris) and rough orbits of all the other satellites (called the almanac). The signals travel at the speed of light through space and at a slightly lower speed through the atmosphere. The GPS receiver uses the time at which the message was received to measure the distance to the satellite. Information from 4 or more satellites can be used by a process called trilateration to determine the precise location of the receiver on earth.
The determined location (also called position fix) of the sensor is prone to errors. The prototype should be capable of handling these errors and it is therefore important to understand the sources of this position error. These errors can be divided according to their source namely in the space segment (satellites), the medium (atmosphere) and the receiver’s environment.
In the space segment, a first source of error is that the operators of the system may intentionally deteriorate the radio signals of the satellites to the general public (to avoid use by an enemy of the USA). Secondly the satellite message may contain incorrect information, such as wrong satellite time or incorrect orbit data.
The troposphere causes errors in position data because it is an obstacle that can delay the radio waves, which alters the assumption that the speed of the waves is equal to the speed of light and thus create an error. However, the ionosphere plays a more significant role in the total amount of error, due to electrically charged atoms that create delay in the radio waves.
Furthermore, the environment in which the receiver is operated also causes error because buildings and natural features bounce the radio waves via different paths to the receiver. The receiver receives the same signal at different times and therefore the calculation of the straight line distance to the satellite will be erroneous. This
phenomenon is called multi-path and is difficult to avoid.
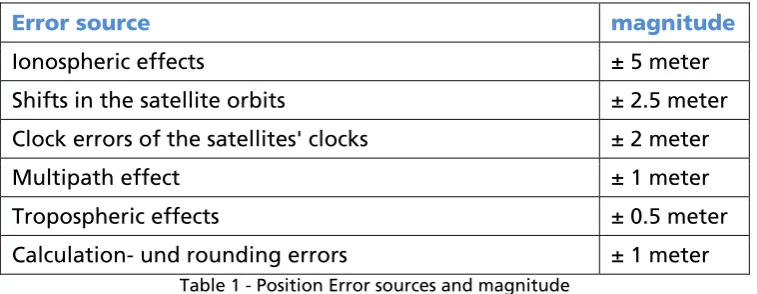
Error source magnitude
Ionospheric effects ± 5 meter
Shifts in the satellite orbits ± 2.5 meter
Clock errors of the satellites' clocks ± 2 meter
Multipath effect ± 1 meter
Tropospheric effects ± 0.5 meter
Calculation- und rounding errors ± 1 meter
Table 1 - Position Error sources and magnitude
Table 1 lists all these errors present in the measurements of the consumer grade GPS receivers incorporated in modern day cell phones. In practice it has been reported that this leads to a total amount of error of about 10-20 meters which is a magnitude that is acceptable. Early tests of the prototype confirmed that the reported position is indeed sometimes about 20m off, however most of the time the sensor performs much better.
4.1.2
Data connections
In order for the position report to be sent to the server, a wireless data connection is necessary. Typical cell phones have multiple connections and protocol possibilities available at any time.
First of all the oldest present protocol available in cell phones is the General Packet Radio Service (GPRS). It uses the GSM network and provides data rates up to 114 kbit/s. A newer protocol is High-Speed Downlink Packet Access (HSDPA) which is has data rates of up to 14.4 Mbit/s. Finally it is also possible to use the 802.11b protocol (better known as Wi-Fi) to send the data, but the downside is that has a very limited range and is therefore unsuitable for in-car use.
The operating system that is installed on the mobile device selects the fastest possible connection that is available at the moment the data transmission should proceed. For the prototype this will typically be either the HSDPA protocol in more densely
populated areas where telephone network operators have erected the necessary masts, or GPRS where only GSM coverage is available.
$GPRMC,123519,A,4807.038,N,01131.000,E,022.4,084.4,230394,003.1,W
the magnitude of a few kilobytes. This means that all of the connections and protocols mentioned above suffice for the data transmission.
4.2
Client software
For the mobile device, a small footprint software application was developed that enables users to capture position data and send this data to the server. A software application is developed from scratch for use in this research. It can connect to any available GPS sensor that is available at runtime and uses the fastest available internet connection to send this data to the server for further processing.
4.2.1
Captured data
The typical GPS receiver sends position information gathered from the sensor to the software using a protocol called NMEA-0183. This protocol consists of human readable sentences which contain data separated by commas. The software application features a settings tab in which three different types of sentences can be specified which are sent during each report.
The basic sentence is called the ‘Recommended Minimum Information’ sentence (GPRMC) which contains all basic information like coordinates, time, date, speed and bearing. Other sentences are ‘Global Positioning Fixed Data’ (GPGGA) and ‘GNSS Dop and Active Satellites’ (GPGSA). These sentences contain information about the number of satellites that are used in the calculation and the precision of the calculated fix.
4.2.2
Data transmission
The data that is extracted from the NMEA sentences is sent over this connection by use of the Hypertext Transfer Protocol (HTTP), which is a communication protocol for the transfer of information on the internet. The software application sends a HTTP request to the URL address of the server. The request contains the data from the NMEA
sentences that are shown in the table below. When the request is performed
successfully, the data is stored on the server. When a HTTP request fails, the position report is lost and only at the time of the next position report, a new request is done. This problem is discussed in the chapter remarks and thoughts.
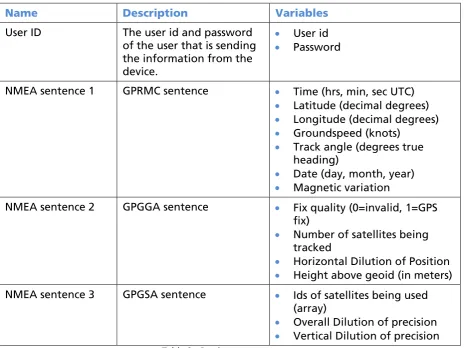
A typical report that is sent from the software application contains the following data.
Name Description Variables
User ID The user id and password
of the user that is sending the information from the
• Track angle (degrees true heading)
• Date (day, month, year)
• Magnetic variation
NMEA sentence 2 GPGGA sentence • Fix quality (0=invalid, 1=GPS
fix)
• Number of satellites being tracked
• Horizontal Dilution of Position
• Height above geoid (in meters)
NMEA sentence 3 GPGSA sentence • Ids of satellites being used
(array)
• Overall Dilution of precision
• Vertical Dilution of precision
Table 2 - Postion report contents
5. Processing data
This chapter covers the phase of the system where the position reports are received from the client. The reports are processed using an algorithm which uses a digital representation of the road network. The results of this process are stored on the server and are then ready to be interpreted in order to generate traffic information. To have a full understanding of the system, all the necessary parts are described below, starting with a short introduction of the subject matter of geographic information systems (GIS).
5.1
Introduction to GIS
By definition, a geographic information system (GIS) is a computer-based system that allows the study of natural and man-made phenomena with an explicit bearing in space. In the case of the prototype we want to analyse the man-made features that together form a road network.
To process the position reports, we need to use a system which can perform calculations which use geographic coordinates and work with network topology and relations. Therefore, a GIS is the perfect tool for the task at hand. In the following sections, the basics of a GIS are covered by describing the related data types and spatial-enabled databases.
5.1.1
Geographical data types
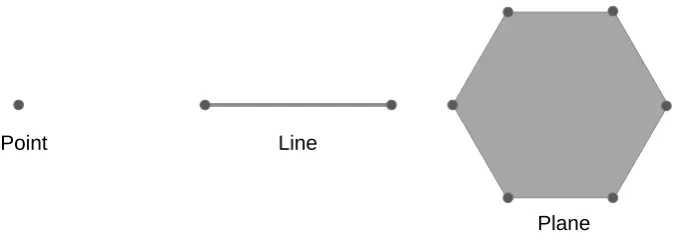
Geographic data can be subdivided into spatial data, which describes the absolute location of geographic features and attribute data, which describes the characteristics of the spatial features.
The spatial data consists of points, lines and planes. Points are infinite small features in space that are on a location specified by its coordinates. Lines are the shortest
Point Line
Plane
Figure 4 - Points, Line and Plane features
In the case of the road network these coordinates are the latitude and longitude specified in decimal degrees. The connected points create lines that together form the road network. Lines are equal to roads in the real physical world and these lines have attribute data such as road name, road number and number of lanes.
5.1.2
Spatial RDBMS
The processing of the position data is done on the server by using a software script that is ran every time a client connects to the server and sends its position report. This script connects to a so-called spatial database.
A database is a large computerized collection of structured data. A database can be managed by use of a database management system (DBMS). This DBMS is a software package that allows the user to set up, use and maintain a database. When the DBMS is specifically designed to access data from different tables in the database using information about their relations, the DBMS is called a relational DBMS. Finally, the database should support working with geographical data, hence the name Spatial RDBMS. In the rest of this thesis, reference is made to a Spatial RDBMS by the term spatial database (system).
A spatial database system has the capability of handling data types like the points, lines and planes that were mentioned previously. There are different vendors of spatial database systems that are well-known. Two worth mentioning are MySQL and PostgreSQL. MySQL gained a reputation because it is used very commonly in web-based systems. Because large parts of the prototype rely on web-based technology MySQL seems usable at first, but it lacks extensive support for spatial data.
The road network consisting of nodes, vertices and the connecting vertices is stored in a table in a database. A table can be thought of a numbered list of entries, each of which describes a small section of a road. This data is stored in binary form in a table. The tables are linked to each other using unique identifiers (ids).
5.2
Road network
5.2.1
Data requirements
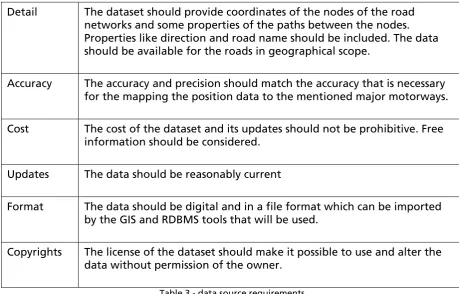
The system will need information of the road network which is used in the algorithms that are described later on in this thesis. There are some requirements to the road network data that are mentioned in table 3 below.
Detail The dataset should provide coordinates of the nodes of the road networks and some properties of the paths between the nodes. Properties like direction and road name should be included. The data should be available for the roads in geographical scope.
Accuracy The accuracy and precision should match the accuracy that is necessary for the mapping the position data to the mentioned major motorways.
Cost The cost of the dataset and its updates should not be prohibitive. Free information should be considered.
Updates The data should be reasonably current
Format The data should be digital and in a file format which can be imported by the GIS and RDBMS tools that will be used.
Copyrights The license of the dataset should make it possible to use and alter the data without permission of the owner.
Table 3 - data source requirements
5.2.2
Data sources
Because the number of data sources is quite limited, there is no need for a complicated criterion based decision method. Instead, the following paragraph shows the available sources and describes their scores on the criterions outlined above only qualitatively.
In addition, it is possible to collect data from the research area manually. It should be possible to meet all the data requirements easily. The downside is that capturing the data is time-consuming and eventually extending the road network to the other highways or other road types will be even more.
Finally, open source datasets are available since the start of a project called
openstreetmaps.org or OSM for short. OSM was originally set up to create an open source street map. Since a street map needs almost the same information as our
algorithms, this source seems very suitable. It has high a level of detail, covering almost all roads in The Netherlands and is updated continually by its large user base. The accuracy that is necessary for creating low scale maps is in the same magnitude as is required for the prototype. Therefore it seems that the accuracy is very adequate for use in the prototype. Commercially important, it can be used without any cost. Concluding, this source seems most appropriate for use in the prototype.
5.3
Database Design
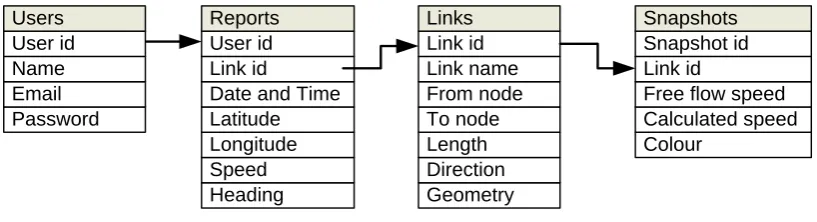
The database contains four data tables. Each table has a name related to its contents and columns relating to the data which is stored in it, this database design in figure 5 below.
Figure 5 - Database table design and relations
5.3.1
Users table
5.3.2
Reports table
The reports table consists of the position reports that are sent by the Globocator mobile client application or when a simulation run is done, sent by the Globosim application. An entry consists of the `User id` associated with the user that sent the report and the position report information such as date and time, latitude and longitude, speed and heading. Finally, the Link id that is associated with the link id from the Links table stores the data from the map matching process.
5.3.3
Links table
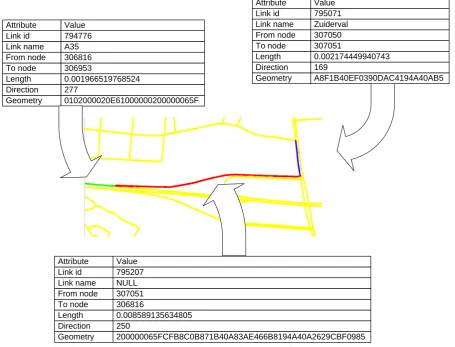
For the prototype, the OSM road network data is imported and stored in a table called ‘Links’. The links table contains the complete road network of the Netherlands as of the summer of 2007. Each row of the links table contains a road section, each of which has certain unique data. This data consists of the road section geometry and other attributes. Below is a visual representation of three of these road sections together with their attribute data.
The `geometry` field of the links table stores the geometry of the link. It contains the spatial reference system, the projection and the coordinate pairs which make up the segment. It is encoded to hex binary for which is most efficient storage in a spatial database. The human readable form of this data would be a list of coordinates which, when connected to each other, together form the actual road.
5.3.4
Snapshots table
This table stores the generated traffic information. Every time the traffic information generation algorithm is run, a snapshot is taken from the ‘Reports’ table and used as input, hence the table name ‘Snapshots’.
5.4
Map matching
The position reports contain errors in position, these error sources were discussed in paragraph 3.1.1. As noted, previous literature suggests the error is in the magnitude of 10 to 20 meters. However, the digital road network data also contains position errors contributed by different sources. Various factors like errors in digitizing map and the distance from the road centreline to the both ends of the road creates a total error to be considered of about 20 meters. As a result, the direct overlay of positional data in the position reports does not match with the digital road network data that is used. Therefore, the report data needs to be corrected with various methods to match it to the digital road network map and we call this procedure map matching.
Map matching algorithms are classified into two categories. First, map matching algorithms which consider only geometric relationships between position data and a digital map. Secondly, map matching algorithms which consider not only geometric relationships but also the topology of the road network and the history of position data. It has been reported that the latter works better.
5.4.1
Map matching theory
The road network can be visualised as a graph which is a mathematical structure used to model pair wise relations between objects from a certain collection. Mathematical graph theories can then be used to analyse the data. The terms used to describe a graph are depicted in Figure 7 - Segments, vertices and nodesfigure 7below.
segment
vertex
node
Figure 7 - Segments, vertices and nodes
5.4.2
Map matching algorithm
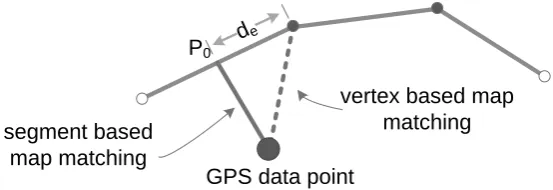
segment based
Figure 8 - Vertex vs Segment based map matching
When the actual vehicle position is at P0, the vertex based map matching creates a
positioning error equal to de. Dependent on the application of the map matched data,
this error can be acceptable, but since recent GIS technology has high performance, there is no reason not to use the segment based variant. A spatial database can perform segment based map matching and this method is used in the prototype.
5.4.3
Algorithm problem situations
When using one of the above algorithms, not all map matching leads to a correct match. In situations where the recorded GPS position is not directly near one node, vertex or segment, it can be difficult to decide with road should be considered the best match.
An overview is given of some increasing problematic situations where there is uncertainty about the correct match of a position report to the network. The maps used below are from a preliminary test run near Rotterdam, The Netherlands, in the vicinity of a large intersection called ‘Kleinpolderplein’. For this run, two GPS sensors where used with a polling interval of 1 second.
The first is the situation is considered the ‘normal’ map matching problem. Position reports do not line up with the actual road. The GPS data point on the network which has the shortest Euclidian distance to a point on the road network is used. This is the simplest form of segment based map matching.
Figure 9 – Map matching based on shortest Euclidian distance
This becomes more difficult when the recorded GPS position coordinates do not line up perfectly due to unavoidable errors in the position fix or the road network data. This situation is depicted below in the west section of the study area.
Figure 10 - Two parallel roads
For the trajectory of the vehicle that actually runs over the motorway the matching incorrectly alternates between the highway and the parallel highway ramp, if map matching is performed according to shortest Euclidian distance. This problem can be solved by using the historic data point and furthermore considering the topology of the road network.
Figure 11 - Multiple intersecting roads
Here an algorithm using the Euclidian distance will erroneously match the vehicle trajectory to at least 5 different roads in the network. This problem can also be solved by using the historic data point and furthermore considering the topology of the road network.
While the two last problem situations are interesting in theory, map matching accuracy near highway intersections is not considered of paramount importance in the
prototype. Therefore these situations will not be accounted for in the used algorithm.
One more situation which has to be accounted for is where there are separate lanes in two directions. Since the OSM data source splits highways into segments in each direction, the problem shown below should be correctly handled.
Figure 12 - Taking direction into account
In this example the actual vehicle trajectory is over the southern highway lane,
accounted for. Therefore, the algorithm that is used will take into account the direction of the trajectory to be able to select the correct lane.
Using the theory about map matching an algorithm was implemented in the prototype. In figure 13, the process of sending the position reports from the client to storing it on the server for later use is shown. Before a report is stored, the system has to perform map matching to map the report to the road network. This process is also shown graphically in the diagram on the next page.
The interpretation of the reports is performed every time a report is received by the server. The process consists of three main parts, namely authentication, map matching and storage. First, when a report is received it is checked if all information is provided. If not all the information is provided correctly the report is discarded immediately. In the second step the provided email address and password is checked against the Users table. If there is no entry that matches the user credentials, the report is discarded. If there is a match, the user id of the user is retrieved.
The next step is parsing the NMEA sentences into usable data. The comma separated sentences are assigned to separate variables. In the next step, these variables are converted to metric form. The NMEA coordinates are given in degrees and decimal minutes together with the corresponding hemisphere. These have to be converted to decimal degrees. Speed is given in nautical miles per hour; therefore it has to be converted to kilometres per hour.
For map matching, first the candidate links are selected based on a range query. Because the GPS coordinate system uses the WGS84 spatial reference system, distance has to be expressed as an arc length. The coordinates are not projected into a
projection that uses metric distances for the range query, because this would create incompatibility when the system is used in other parts of the world. The angle of 1 radian equals about 64 meters, which is far greater than the expected GPS error. Therefore, the actual road on which the vehicle travels will probably be amongst the selected candidate links.
into separate links in opposing directions. As noted earlier, this step makes sure that the correct highway lane is map matched by the algorithm.
Finally, on the candidate links which match the direction condition, map matching is performed. This means that the report position coordinates are projected onto the candidate link. The map matched point is the point with the shortest distance between the report coordinates and the projected coordinates on the candidate link. This link is assumed to be the road on which the vehicle travelled at the time of the report.
Storage
Select all links within 0.01 radians proximity of GPS position data
Select only links that have directions that are between -90 and +90
degrees of reported heading
6. Interpreting data
6.1
Introduction
This chapter covers the phase of the system where the position reports from the reports table in the database are converted into usable traffic information. The results of this process are stored in another table on the server and are then ready to be disseminated to users accessing the traffic information.
For traffic flow information at a high resolution, i.e. information about a small section of the highway in the magnitude of hundreds of meters, it seems necessary to update the traffic information at least once a minute to be useful. As a result, the algorithm that is to be devised for this purpose should be efficient enough to generate the traffic information at this frequency. Furthermore, it should be noted that the algorithm should be capable to achieve this rate while using reports of thousands of users.
These constraints on update frequency and number of user reports lead to an
algorithm that uses road segments. This is due to the nature of databases to efficiently access data only if it is stored in rows of a table. Therefore, each highway for which information is generated is divided into segments of equal length. Each of these link segments conveys information about reported speed of users that send a position report on this link.
Case 1: Reports lie on the same link
Case 2: Reports lie on adjacent links
Case 3: At least one link lies between to two consecutive
reports
Report location Link segment node
Figure 14 - Reporting cases
In the first case, two consecutive position reports lie on the same link. The travelled distance between these two reports divided by the polling interval directly relates to the average speed at which the user travelled on that part link segment. In the second case, the reports lie on two adjacent links, the calculated average speed relates to both link segments. Finally, the last case concerns a situation where there is at least one link between two reports. This leads to a situation where path identification is necessary prior to calculation of average speed and assignment of this information to certain link segments.
A final requirement to the generated traffic information is that it should be stored in such a way that is possible to use the information in the most flexible way in order to be disseminated to systems with different purposes. This means that the derived
6.2
Generating traffic information
The implementation in the prototype is as follows. In the first step, previously calculated speeds and link colours are reset to their default values. Then only the reports that were sent between now and x minutes ago are selected from the Reports table. In the prototype this value of x is set to 5 minutes. This interval balances recency and coverage of the traffic information. In the next step the reports that were matched to a highway lane in scope are selected and the ones that are not in scope are
discarded.
The reports are then grouped according to their matched link id. By default, only if there are two reports on the same link in the same interval, speed is calculated. The
Interval
Storage
Calculate link speeds
Initialisation
Start
End Retrieve reports With timestamp between
now and x minutes ago
Database Table Reports
Reset all previously calculated speeds
to link free flow speeds and link colour to unknown (blue)
Database Table Snapshots
Select only reports with a map matched link id contained in
the snapshots table
Database Table Snapshots
Group reports by link id and select the report with the highest
reported speed on that link
Set the link segment calculated speed
to the highest reported speed
Set link colour based
on calculated speed Table SnapshotsDatabase
6.3
Segment length and polling interval
To decrease complexity of the system, the segment length and polling interval are chosen in such a way that no path identification is necessary. To calculate the optimal segment size and polling interval, first the maximum speed that a user will travel is chosen. At this maximum ‘design’ speed, at least one report should be sent while the vehicle travels over one link segment. Two simple formulae can be generated based on this idea.
Segment length = Maximum design speed [m/s] * Polling interval [s] and; Polling interval = Segment length [m] / Maximum design speed [m/s]
To maintain compatibility with European countries where there is no maximum speed limit on the certain highways, such as Germany, the selected design speed was chosen to be 180 km/h in the prototype. Several options based on the design speed of 180 km/h (50 m/s) are listed below.
Segment length Polling interval
1000 meters 20 seconds
500 meters 10 seconds
100 meters 2 seconds
For the prototype, a segment length of 500 meters and a polling interval of 10 seconds were chosen. These settings make sure that traffic information can be displayed at a relatively high resolution and the polling interval does not place significant load either on the server or the mobile device. Moreover, the traffic information will also be sent back to the mobile device in this interval and preliminary tests revealed that a server round trip time of 10 seconds is acceptable.
7. Disseminating information
This small section covers the phase in the system where the generated traffic information is disseminated to different users. These users could be the same
individuals that have just sent position reports, but also individuals that want to access the traffic information pre-trip at their homes. The dissemination will be done using the same (wireless) connections that were previously used to send the position reports.
To enable different users to access this information, two different display options will be explored in the prototype. The first option, for accessing the information on trip, will be implemented by displaying the traffic information of the highway section that lies ahead of the current position on the mobile device. The second option will be made available by enabling users to access a map on which the traffic information is
displayed.
7.1
Globocator Mobile version
The traffic information is displayed on the “Traffic Information” tab screen. This screen shows the highway section that is ahead of the user. When the user enters a highway, image displayed shows the entire highway that is ahead. Adjacent to the displayed road image, is the distance from the current position to the projected segment.
The image is colour coded to show the calculated speeds for the upcoming highway segments.
Colour Calculated speed as % of free flow speed
Blue No information available
Green >80%
Light green 60%-80%
Yellow 40-60%
Orange 20-40%
Red 0-20%
In the sample image shown here, there is some congestion between 7 and 14
The image is updated at the same interval at which reports are sent, so the default update frequency for the prototype is 10 seconds.
7.2
Globocator Browser version
8. Simulation and Testing
For this research a prototype of a system that can generate traffic information based on position reports was created from scratch. To support, assess and further develop the prototype a software suite was developed. The suite consists of a software application that can be installed on a mobile device and an application which shows the traffic information in an internet browser. The application is called the Globocator, which is a concatenation of the words “Globosys” and “Locator”, to point at the project sponsor and the function of the application.
The other parts of the suite consist of applications called Globosim and Globotest. The Globosim application was developed to simulate vehicles with a mobile device on board which send position reports at specified intervals. The development was necessary because it is too cumbersome to perform real-life tests in each development cycle of the Globocator. The Globosim application can also be used to evaluate the
performance of the devised traffic information generation algorithm. In turn, the Globotest application can be used to access the performance and accuracy of the map-matching algorithm.
Figure 16 is a schematic overview of the parts of the software suite and the directions of data flow between the application and the database. The applications all connect to the database to receive information and/or send data.
Globocator (Mobile)
Globocator
(Browser) Globotest Globosim
Globocator Database
After the prototype was developed, it was tested using the Globosim application. For testing, several real-life scenarios were created and run in the simulator. A scenario test consists of the description of the scenario along with the expected output. Each
scenario tests one element of the used algorithms and can be used to track errors but also to analyse performance.
In the table the below the different scenarios that were loaded into the simulator are listed along with the results.
Scenario Description Expected output Result
Free flow This scenario loads 5 vehicles which travel at free flow speeds from Enschede to Almelo via the A35. This scenario checks whether the algorithm correctly updates the segment speeds only if multiple position reports are map-matched to the same segment in the selected interval.
stops This scenario loads 5 vehicles which travel initially at free flow speeds from Enschede to Almelo via the A35. One car eventually slows down and stops to simulate a car breakdown. This scenario checks whether the algorithm correctly updates the segment speed according to the fastest report in the selected interval.
Segments turn
stop This scenario loads 5 vehicles which travel at free flow speeds from Enschede to Almelo via the A35. Two cars slow down and stop to simulate an accident with light exterior damage involving two cars. Together they make it to the
emergency lane and the rest of the traffic is not affected. This scenario checks whether the algorithm correctly updates the segment speed according to the fastest report in the selected interval.
Segments turn
Congestion This scenario loads 5 vehicles which encounter congestion. Their speed decreases until the first two cars
eventually stop. After a certain period of time, the congestion is gone and all cars can resume free flow speed. When one
High speed
variance This scenario loads 2 vehicles which continuously drive 100km/h for 5 seconds and then completely stop for 5 seconds. Their average speed is therefore 50 km/h which is much lower than free flow speed, therefore indicating low segment speeds. This checks if the algorithm shows average speeds instead of instantaneous speed.
The segments will
turn orange. Fail
Opposing
traffic This scenario loads 10 vehicles with a GPS error factor of 10 and with origins alternating between Enschede and Almelo. This scenario checks the map-matching algorithm's ability to cope with high GPS error and still map-match to correct highway lane based on direction.
The segments will be updated on the correct side of the highway.
Pass
The algorithm passes all scenario tests, except for the ‘High speed variance’ test. This is because the traffic information algorithm does not use average speed based on
9. Results and Conclusions
The objective of this research was to design and develop a prototype of traffic information system which is able to generate traffic information based on real-time position data from GPS enabled online mobile. A prototype was developed and explained in the previous chapters. Simulator scenario tests were performed to
calibrate the prototype during development. Real life tests were performed on the A35 highway to validate the simulation results.
For the prototype, the OSM road network data was used and proved to be a useful source. The simulator however, showed some minor problems concerning outdated network data. In the area of Almelo, some temporary roadwork to the A35 is included in the road network. The simulator in contrast, uses the newer Tele Atlas data.
Therefore, the vehicle trajectories do not match with the used road network by the algorithms. This reveals the fact that the road data used by the system should be updated frequently.
The development of a prototype is an iterative process. The design was based on literature review and previous experience with database design. During the
development multiple design decisions were made. It is impossible to sum up all these decisions and their background. However, the most important ones were discussed in the text. Where possible, this impact of these decisions was tested in advance using the simulator.
The most important system and input variables are the segmentation of the highway lanes and the polling intervals. Maximum design speed leads to a situation where a balancing should be made between polling interval and link segment length. The chosen values seem to work well performance wise and give a high resolution of the traffic data.
10. Recommendations
The aim of developing a prototype was to create a test bed and starting point for a production version of the Globocator software with enhanced capabilities. The prototype can be used at this point to generate accurate information, but in order for it to be released to the public in a production version, improvements are necessary. These improvements mostly include enhancements in the client software.
Some improvements are worthwhile to note. The image that is showed on the traffic information screen is generated on the server side. The pros of the approach are that the same image can be used in both the mobile device application and in the simulator. The cons however, are that unnecessary load is placed on the server which has to generate images every update interval (10s) for all users of the system.
Also it creates some pressure on the bandwidth of the wireless connection of the mobile client, because images are far bigger in data size than just the numerical traffic information. Therefore, ideally the images should be generated by the client application based on the raw traffic data from the server.
During the early development phase of the prototype, the capability of the client software to go to suspend or hibernation mode was envisioned. However, when the prototype was developed further it became visible that in the normal use case, the client system is connected to a hands free telephone holder, because this is required by law in Europe. These holders also charge the battery so power consumption seems less important than envisioned at first.
11. Further remarks and thoughts
• Instead of sending position data at predefined intervals, it is also possible to let the system decide when the position data of a certain user is necessary. This way the amount of data used on the mobile connection can be minimized and
possible server data overload can be avoided. The server requests only data from the server when traffic flow information on a certain road section is outdated and will send a position and speed request to users that are near that particular section of the road.
• The client software can be improved by using other sensors available on the mobile device. Newer cell phones incorporate inertial sensors that can sense in which direction is moving. Using the information from this sensor, it is possible to selectively enable the sending and receiving of data from the server. It is for example possible to sense movement patterns of the carrier of the device, so that when the carrier seems to be walking, the sending of position reports is aborted. This way be the software can be running in the background continually, profiting from the fact that the g-sensor consumes very little power when
operated, and only commence using the GPS sensor when necessary. Also, use of the GPS fix likelihood variable could be used to assign an interval at which the application waits for a position fix.
• The position reports that are sent to the server rely on two factors, namely that there is a position fix available from the GPS receiver and that there is an active connection. Since a direct HTTP request is used to send the data to the server, the report is only received when there is a connection and the report is lost when there is none available. The connection can be lost if it is interrupted due to natural interference, unavailable network coverage and when the connection is used for other applications, for example a telephone call. If the report data is buffered on the client, it can be sent when the connection is available again for the application. This way the dataset for the traffic flow algorithm is more complete and possible more accurate.
• For the final version that is released to the public for the user interface, it would be helpful if the application could be integrated to the home screen of Windows Mobile operating system. This would make starting the Globocator more easily and would allow for traffic data to be displayed at all times.
• The prototype is not able to show information about connecting highways ahead, a next version could have the user enter their destination, and the traffic of the shortest route path to the destination via the highway network could be shown in the traffic information image.
• Another aspect of the GPS sensor worth mentioning is its power use. A low power GPS sensor in a mobile device typically consumes about 125 mW during tracking and even more during the position acquiring phase. This should be kept in mind when developing the software application for use on the mobile device, because battery capacity is generally very limited. Of course, this creates a trade-off between power use and application complexity.
• A previous study by Logica CMG, states that complete coverage of the Dutch highway network by vehicle probes (opposed to signal loops) can only be
acceptable if 1% of all vehicles are equipped. This means that for the production version to work a very high penetration rate should be achieved. It is therefore wise to enhance the Globocator mobile application with other functionalities to make it more attractive for users. With every extra user the coverage can
potentially be improved and there are more advantages of a higher user base.
• When there are more users, the traffic information reports interval can be lowered, so that the information is more current, but the system still maintains good coverage. Also the recency interval could be adjusted according to
• In the early development stages of the prototype, a path identification algorithm was tested to enable very high polling intervals, in the range of minutes. The algorithm used the Link table and Dijkstra’s shortest route path algorithm to identify the shortest route as the identified path. Because this process was not optimised it took nearly 14 seconds per report. This created a load on the server which was far too high. It was decided that the traffic
12. List of references
• De Dios Ortúzar, J. W., L. G. (2002). Modelling transport, Wiley & Sons Ltd.
• Dunnewijk, T. H., S. (2007). "A brief history of mobile communication in Europe, Telematics and Informatics." Mobile Communications: From Cellular to Ad-hoc and Beyond 24(3): 164-179.
• F. Marchal, J. H., K.W. Axhausen (2004) Efficient map-matching of large GPS data sets.
• Gribbon, P. (1998). "Field test of nonintrusive traffic detection technologies." Mathematical and Computer Modelling 27(9-11): 349-352.
• Jagadeesh, G. S., T.; Zhang, X. (2004). "A Map Matching Method for GPS Based Real-Time Vehicle Location." The Journal of Navigation(57): 429–440.
• Mobiliteitsmonitor, S. N. (2007). Nationale Mobiliteitsmonitor.
• Mohan, P. V., V.N.; Ramachandran , R. (2008) TrafficSense: Rich Monitoring of Road and Traffic Conditions using Mobile Smartphones.
• Ramm, K. C., R.; Schwieger, V. (2006). Map-based Positioning using Mobile Phones. XXIII FIG Congress Munich. Germany.
• Verhoef, E. T. (2005). "Speed-flow relations and cost functions for congested traffic: Theory and empirical analysis." Transportation Research Part A: Policy and Practice 39(7-9): 792-812.
• Xi, L. L., Q; Li, M; Liu, Z (2007) Map Matching Algorithm and Its Application. Advances in Intelligent Systems Research
• Xiaohui, S. J., X; Zhou; Lei, J; Weiye, L (2006). Application of Dynamic Traffic Flow by Using Real Time GPS Data Equipped Vehicles. 6th Intermational Coference on ITS Telecommunications Proceedings.
Appendix A
Figure 17 - Study area for map matching Kleinpolderplein
Map Legend
roads type
living_street motorway motorway_link pedestrian primary residential secondary service tertiary trunk trunk_link unclassified
Appendix B
Globocator Status codes
Notification Associated application status
Detecting GPS devices… The application has started detecting devices connected to the ports of the device.
Detecting <device name> The application checks whether the connected device contains a GPS sensor which is capable of NMEA-0183 output.
Found Device: <device name> The device is successfully registered as a compatible GPS sensor.
Device detection completed The application stopped detecting devices. It now has a list of compatible connected GPS devices.
Connecting to GPS device... The application has started connecting to the GPS device.
Connected to GPS device! Reading data...
The application is successfully connected to the GPS device and is receiving its data stream containing NMEA sentences.
Disconnecting from GPS device... The application is disconnecting from the data stream of the GPS device.
Disconnected! The application is disconnected and ready to start
device detection again.
The device stopped. Restarting… The device has been shutdown or went into
hibernation mode during runtime. The application is trying to reconnect to the GPS device that it was connected to before.
Error Notification Associated application status
Error: <error description> Generic error report of the application.
Not responding: <device name> The GPS device is not responding to any
No position fix. No POST. The GPS device is connected and sending