Electronic Thesis and Dissertation Repository
10-23-2017 10:00 AM
Bi-directional Cyclic Behaviour and Liquefaction Analysis of a
Bi-directional Cyclic Behaviour and Liquefaction Analysis of a
silica-carbonate sand
silica-carbonate sand
Keyvan Mirbaha
The University of Western Ontario
Supervisor
Professor Abouzar Sadrekarimi The University of Western Ontario
Graduate Program in Civil and Environmental Engineering
A thesis submitted in partial fulfillment of the requirements for the degree in Master of Engineering Science
© Keyvan Mirbaha 2017
Follow this and additional works at: https://ir.lib.uwo.ca/etd
Part of the Civil Engineering Commons, and the Geotechnical Engineering Commons
Recommended Citation Recommended Citation
Mirbaha, Keyvan, "Bi-directional Cyclic Behaviour and Liquefaction Analysis of a silica-carbonate sand" (2017). Electronic Thesis and Dissertation Repository. 5035.
https://ir.lib.uwo.ca/etd/5035
This Dissertation/Thesis is brought to you for free and open access by Scholarship@Western. It has been accepted for inclusion in Electronic Thesis and Dissertation Repository by an authorized administrator of
i
The cyclic behavior and liquefaction behavior of reconstituted samples of a local silica-carbonate sand are examined by performing monotonic and cyclic simple shear tests in addition to bender element shear wave velocity measurements. Shear wave velocity was found to vary with effective overburden stresses by an average power of 0.25. Maximum shear modulus (Gmax) was also computed from the shear wave velocity measurements and a correlation was developed between Gmax, effective stress and void ratio. Small strain and cyclic strain dependent shear modulus of the soil were determined, and shear modulus reduction curves were obtained. The results show a slower degrading stiffness and damping ratio, compared to an average proposed for sands. A critical state line of the samples was developed by performing drained and constant-volume monotonic simple shear tests.
ii
iii
iv
This thesis has been prepared in accordance with the regulations for an Integrated-Article format thesis stipulated by the School of Graduate and Postdoctoral Studies at the University of Western Ontario and has been co-authored as:
Chapter 2: Characterization of a Silica-Carbonate Sand Based on Shear Wave Velocity
Measurement and Cyclic Simple Shear Tests
All experimental work was completed by Keyvan Mirbaha under the close supervision of Dr. Abouzar Sadrekarimi. A paper co-authored by Keyvan Mirbaha and Abouzar Sadrekarimi has been submitted to 3rd International Conference on Performance-Based Design in Earthquake Geotechnical Engineering (PBD III), Vancouver, 2017.
Chapter 3: Cyclic Behavior and Liquefaction Analysis of a Silica-Carbonate Sand Based
on Bi-directional Cyclic Simple Shear Tests
All experimental work was completed by Keyvan Mirbaha under the close supervision of Dr. Abouzar Sadrekarimi. A paper co-authored by Keyvan Mirbaha and Abouzar Sadrekarimi will be submitted to the Soil Dynamics and Earthquake Engineering Journal.
Chapter 4: Evaluating the Liquefaction and Re-liquefaction behavior of a
Silica-Carbonate Sand
v
I want to deliver my most sincere appreciations to my supervisor Dr. Abouzar Sadrekarimi who advised and supported me consistently in reaching our research objectives and helped me to learn a lot in the field of our research.
I would also like to thank my wife and daughter who encouraged me and supported me in my research path and my father and mother who always gave me strength by giving their words and wishes.
vi
Keywords ... iii
Co-authorship statement ... iv
Acknowledgments ... v
List of tables ... x
List of Appendices ... xvi
List of nomenclatures ... xvii
1. Introduction ... 1
1.1. Problem overview... 1
1.2. Purpose of research and thesis outline ... 3
2. Characterization of a silica-carbonate sand based on shear wave velocity measurement ... 6
2.1. Introduction ... 6
2.2. Experimental plan ... 11
2.2.1. Tested material ... 11
2.2.2. Specimen preparation ... 13
2.2.3. Consolidation ... 17
2.2.4. Monotonic simple shear tests ... 17
2.2.5. Critical state approach ... 20
2.2.6. Cyclic DSS tests... 22
vii
2.3.1. Monotonic drained and constant-volume simple shear tests ... 26
2.3.2. Critical state line location ... 29
2.3.3. Shear wave velocity measurement ... 30
2.3.4. Evaluation of maximum shear modulus (Gmax)... 36
2.3.5. Mono-directional cyclic simple shear test results ... 38
2.3.6. Evaluation of large strain modulus (G) and degradation curves for Boler sand ... 41
2.3.7. Particle crushing verification ... 45
2.4. Conclusions ... 46
2.5. References... 47
3. Cyclic behavior and liquefaction analysis of a silica-carbonate sand based on bi-directional cyclic simple shear tests ... 52
3.1. Introduction ... 52
3.2. Experimental plan ... 54
3.2.1. Soil characteristics and specimen preparation ... 54
3.2.2. Testing apparatus ... 55
3.2.3. Testing plan and parameter definitions ... 56
3.3. Test results ... 62
3.3.1. Introducing resultant shear strain and cyclic stress ratio... 62
3.3.2. Mechanism of strength reduction under cyclic loads ... 65
3.4. Analysis of results ... 67
viii
3.4.3. Pore water pressure generation ... 90
3.4.4. Critical state analysis approach to cyclic behavior ... 92
3.4.5. Evaluating CRR variation based on VS measurements ... 93
3.4.6. Liquefaction susceptibility analysis ... 95
3.5. Conclusions ... 102
3.6. References... 103
4. Evaluating the liquefaction and re-liquefaction behavior of a silica-carbonate sand 110 4.1. Introduction ... 110
4.2. Experimental plan ... 112
4.2.1. Tested material ... 112
4.2.2. Specimen preparation ... 112
4.2.3. Cyclic DSS tests... 113
4.3. Test results ... 115
4.3.1. Critical state line approach ... 115
4.3.2. First stage of cyclic loading (liquefaction) ... 115
4.3.3. Second stage of cyclic loading (re-liquefaction) ... 115
4.4. Analysis of results ... 124
4.4.1. Densification effect of pre-shearing ... 124
4.4.2. Effect of relative density and consolidation stress on a re-liquefaction event ... 126
ix
4.5. Conclusions ... 140
4.6. References... 141
5. Summary and conclusions ... 145
x
Table 2.1: Gmax correlations of cohesionless Soils (Sawangsuriya, 2012) ... 10
Table 2.2: HCL dissolution test results of Boler sand for determining carbonate content ... 13
Table 2.3: Uniformity check for two dense samples ... 14
Table 2.4: Summary of monotonic drained simple shear tests of Boler sand ... 19
Table 2.5: Summary of monotonic constant-volume simple shear tests of Boler sand ... 20
Table 2.6: Summary of mono-directional cyclic simple shear tests ... 24
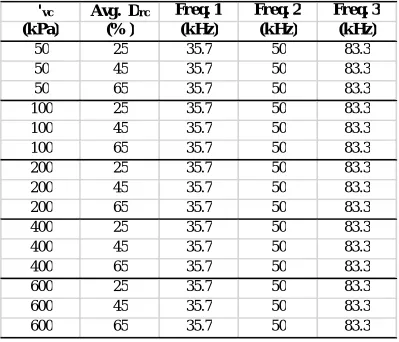
Table 2.7: Summary of characteristics for shear wave velocity measurement tests ... 25
Table 2.8: Summary of selected monotonic DSS tests (for CSL establishment) ... 29
Table 3.1: Summary of cyclic tests for loose samples ... 60
Table 3.2: Summary of cyclic tests for medium dense samples ... 60
Table 3.3: Summary of cyclic tests for dense samples ... 61
Table 3.4: CSR regression parameters for power function of CSR =α. NC-β used for calculation of CRR (CSR at 15 number of cycles) for loose (Drc = 25%) samples ... 78
Table 3.5: CSR regression parameters for power function of CSR =α. NC-β used for calculation of CRR (CSR at 15 number of cycles) for medium dense (Drc = 45%) samples . 79 Table 3.6: CSR regression parameters for power function of CSR =α. NC-β used for calculation of CRR (CSR at 15 number of cycles) for dense (Drc = 65%) samples ... 80
Table 3.7: Summary of factors for shear wave velocity and CRR correlation ... 95
Table 4.1: Summary of cyclic DSS tests for both stages of liquefaction ... 114
Table 4.2: Results for liquefaction / re-liquefaction at Drc = 25% / mono-directional ... 118
xi
Table 4.5: Results for liquefaction / re-liquefaction at Drc = 25% / bi-dir. (figure-8) ... 119
Table 4.6: Results for liquefaction / re-liquefaction at Drc = 45% / mono-directional ... 120
Table 4.7: Results for liquefaction / re-liquefaction at Drc = 45% / bi-dir. (circular) ... 120
Table 4.8: Results for liquefaction / re-liquefaction at Drc = 45% / bi-dir. (elliptical) ... 121
Table 4.9: Results for liquefaction / re-liquefaction at Drc = 45% / bi-dir. (figure-8) ... 121
Table 4.10: Results for liquefaction / re-liquefaction at Drc = 65% / mono-directional ... 122
Table 4.11: Results of liquefaction / re-liquefaction at Drc = 65% / bi-dir. (circular) ... 122
Table 4.12: Results liquefaction / re-liquefaction at Drc = 65% / bi-dir. (elliptical) ... 123
xii
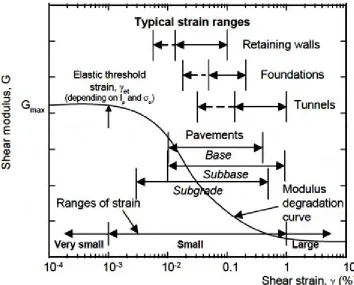
Figure 2.1: Strain-dependent stiffness properties of soils (Sawangsuriya, 2012) ...7
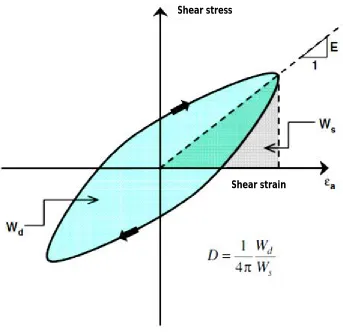
Figure 2.2: Stress-strain loop of soil under cyclic loading and related parameters ...8
Figure 2.3: Average grain size distribution of Boler sand ... 12
Figure 2.4: X-Ray diffraction analysis for Boler sand ... 12
Figure 2.5: Uniformity control with frozen sample ... 15
Figure 2.6: Sample uniformity check (left: cut of frozen / right: tin filled) ... 15
Figure 2.7: Sample setup after preparation left) and after mounting on DSS machine (up-right) and loading mechanism a) after consolidation b) shearing c) constant-volume boundary condition and shear strain illustration d) 3D deformed shape (Yao Li et al. 2017) ... 16
Figure 2.8: Characteristic response of sands under undrained static loading (Chern, 1985) 18 Figure 2.9: Critical state line introduction and overview of parameters for Boler sand ... 21
Figure 2.10: Typical respons of Boler sand in mono-directional cyclic simple shear tests .... 23
Figure 2.11: Monotonic constant-volume simple shear test results for Boler sand ... 27
Figure 2.12: Monotonic drained simple shear test results for Boler sand ... 28
Figure 2.13: Critical state lines of Boler (from this study), Hokksund (Castro, 1969), and Monterey #0 (Jefferies and Been, 2006) sands ... 30
Figure 2.14: Shear wave (S wave) propagation in soil sample ... 31
Figure 2.15: Shear wave signals for specimens (top to bottom; Drc = 25, 45, 65%) ... 32
Figure 2.16: Variation of VS with normalized σ'vc for Boler sand ... 34
Figure 2.17: Variation of F(e) with consolidation void ratio (ec) from this study for Boler sand and comparison with the correlation derived by Hardin and Richart (1963) ... 35
Figure 2.18: Shear wave velocity (VS) versus state parameter (Ψ) from the DSS tests ... 35
Figure 2.19: Variation of Gmax with σ'vc for Boler sand at Drc = 25, 45, and 65% ... 37
Figure 2.20: Variations of AF'(e) with ec for Boler sand and suggested values by several other studies (Hardin 1978; Iwasaki et al. 1978; Kokusho 1980) for clean sands ... 37
xiii
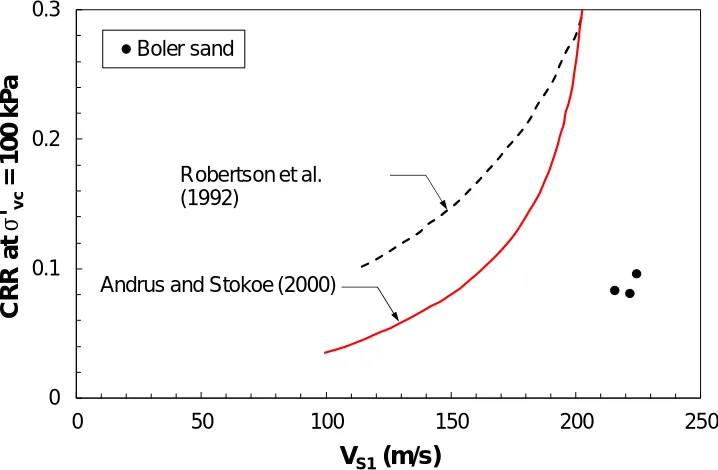
triggering curves of Andrus and Stokoe (2000) and Robertson et al. (1992) ... 40
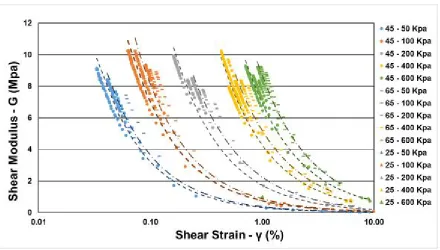
Figure 2.24: Shear modulus curves for Boler sand samples with Drc = 25, 45, and 65%, σ'vc = 50, 100, 200, 400, and 600 kPa ... 42
Figure 2.25: Damping ratio variation for Boler sand samples with Drc = 25, 45, and 65%, σ'vc = 50, 100, 200, 400, and 600 kPa ... 42
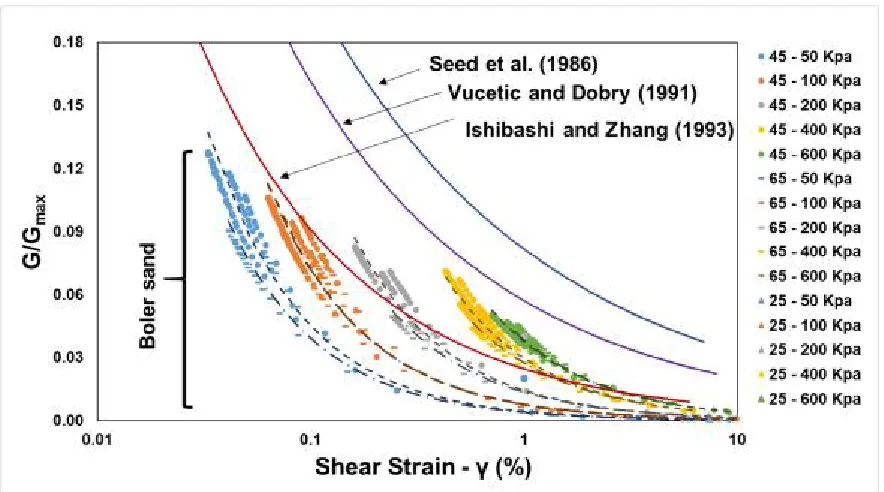
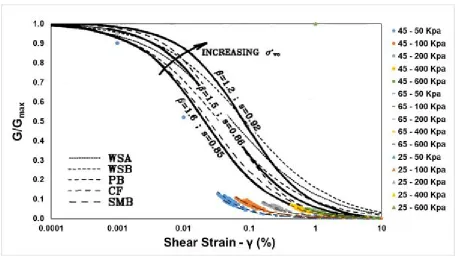
Figure 2.26: G/Gmax degradation curves for Boler sand samples with Drc = 25, 45, and 65%, σ'vc = 50, 100, 200, 400, and 600 kPa ... 44
Figure 2.27: G/Gmax curves for Boler sand compared to lower and upper bands proposed by Seed et al. (1984, 1986) and Iwasaki et al. (1978) for sands ... 45
Figure 2.28: Gradation of a sample before and after shearing to a CSR = 0.152 for a sample with Drc = 65% and σ'vc = 600 kPa ... 46
Figure 3.1: Different applicable bi-directional loading patterns (Yang et al., 2016) ... 58
Figure 3.2: Comparing cyclic response of medium dense samples (Drc = 45%) to cyclic Figure 3.3: Response of a sample to mono-directional cyclic load with Drc = 63.1%, ... 63
σ'vc = 50 kPa, CSR = 0.071 and frequency of f= 0.1 Hz ... 63
Figure 3.4: Response of a sample to bi-directional / circular pattern cyclic load with ... 63
Figure 3.5: Response of a sample to bi-directional / elliptical pattern cyclic load with Drc = 65.9%, σ'vc = 50 kPa, CSR resultant = 0.073 and frequency of fX = fY = 0.1 Hz ... 64
Figure 3.6: Response of a sample to bi-directional / figure-8 pattern cyclic load with Drc = 66.9%, σ'vc = 50 kPa, CSR resultant = 0.065 and frequency of fX = 0.1 Hz, fY = 0.2 Hz ... 64
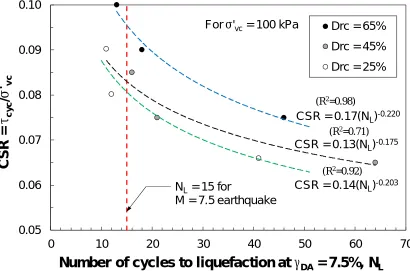
Figure 3.7: CSR (and CRR) variation for mono-directional tests at different relative densities (Drc = 25%, 45%, 65% ± 3%) and ... 68
under vertical effective stress of σ'vc = 400 kPa ... 68
Figure 3.8: CSR versus NC for mono-directional cyclic loads at liquefaction ... 69
Figure 3.9: CSR versus NC for mono-directional cyclic loads at re-liquefaction ... 70
Figure 3.10: CSR versus NC for bi-directional / circular loads at liquefaction ... 71
xiv
Figure 3.14: CSR versus NC for bi-directional / figure-8 loads at liquefaction ... 75
Figure 3.15: CSR versus NC for bi-directional / figure-8 loads at re-liquefaction ... 76
Figure 3.16: Effect of the relative density changes on Kσ factor for Fraser delta river sand specimens (Idriss and Boulanger 2008) ... 77
Figure 3.17: Overburden correction factor (Kσ) factor variation with effective stress for Boler sand (liquefaction) at three different relative densities (Drc = 25%, 45%, and 65%) ... 81
Figure 3.18: Comparison of Kσ factor variation with σ'vc for various research studies ... 83
Figure 3.19: CRR variation for one and two directional loaded samples (σ'vc = 50 kPa) Figure 3.20: CRR variation for one and two directional loaded samples (σ'vc = 100 kPa)... 85
Figure 3.21: CRR variation for one and two directional loaded samples (σ'vc = 200 kPa)... 86
Figure 3.22: CRR variation for one and two directional loaded samples (σ'vc = 400 kPa)... 87
Figure 3.23: CRR variation for one and two directional loaded samples (σ'vc = 600 kPa)... 88
Figure 3.24: Reduction factors to convert bi-directional to mono-directional CRR ... 89
Figure 3.25: Pore water pressure ratio at liquefaction (ru-limit) variation with cyclic stress ratio (CSR) for cyclic DSS tests of Boler sand ... 91
Figure 3.26: Pore water pressure ratio at liquefaction (ru-limit) variation with number of loading cycles (NC) for cyclic DSS tests of Boler sand ... 92
Figure 3.27: CRR versus state parameter (Ψ) for cyclic DSS tests of Boler sand ... 93
Figure 3.28: Cyclic resistance ratio (CRR) versus shear wave velocity (VS) correlations from cyclic DSS tests and bender element tests of this study for Boler sand ... 94
Figure 3.29: SPT test based liquefaction triggering curves for M = 7.5 and σ'vc =100 kPa ... 96
Figure 3.30: CPT test based liquefaction triggering curves for M = 7.5 and σ'vc =100 kPa ... 96
Figure 3.31: Vs based liquefaction triggering curves for M = 7.5 and σ'vc =100 kPa ... 97
xv
Figure 4.1: Definition of cyclic load patterns in this study ... 113
Figure 4.2: Liquefaction stage results at Drc = 25%, σ'vc = 100 kPa and CSR=0.07 ... 116
Figure 4.3: Re-liquefaction stage results at Drc = 25%, σ'vc = 100 kPa and CSR=0.07 ... 116
Figure 4.4: Void ratio changes VS number of cycles at consecutive liquefaction stages .... 124
Figure 4.5: Volumetric strain changes VS initial state parameter (Ψ) ... 125
Figure 4.6: Variable trend of cyclic resistance (CSR) VS number of cycles at consecutive liquefaction events for mono-directional loading patterns ... 127
Figure 4.7: Comparison of cyclic resistance (CSR) vs number of cycles with consecutive liquefaction occurrence in multiple studies and results of current study for dense samples ... 128
Figure 4.8: Variable trend of (CSR) VS (NCL) for loose samples (Drc = 25%) ... 130
Figure 4.9: Variable trend of (CSR) VS (NCL) for medium dense samples (Drc = 45%) ... 131
Figure 4.10: Variable trend of (CSR) VS (NCL) for dense samples (Drc = 65%) ... 132
Figure 4.11: Comparison of pore water pressure ratio (ru) variation by relative density for two stages of liquefaction in different cyclic load patterns ... 134
(Drc = 25% left column and Drc = 65% right column) ... 134
Figure 4.12: Comparison of pore water pressure ratio (ru) variation by consolidation stresses for two stages of liquefaction in different cyclic load patterns ... 135
(σ'vc= 50 kPa left column and 600 kPa right column) ... 135
Figure 4.13: Calculating CRR values for liquefaction and re-liquefaction of Boler sand in mono-directional cyclic tests at σ'vc = 400 kPa and in different relative densities ... 136
Figure 4.14: CRR VS initial state parameter for mono-directional cyclic loads ... 138
Figure 4.15: CRR VS initial state parameter for bi-directional (circular) cyclic loads ... 139
Figure 4.16: CRR VS initial state parameter for bi-directional (elliptical) cyclic loads ... 139
xvi
Appendix 1: Mono-directional cyclic simple shear test results
This appendix includes plots (shear stress VS shear strain – pore water pressure ratio VS shear strain – pore water pressure ratio VS number of cycles – shear stress VS vertical effective stress) for individual test results of samples with 25%, 45%, and 65% relative densities and consolidated to vertical effective stress of 50, 100, 200, 400, and 600 kPa under mono-directional cyclic simple shear loads.
Appendix 2: Bi-directional / circular cyclic simple shear test results
This appendix includes plots (shear stress path – pore water pressure ratio VS shear strain – pore water pressure ratio VS number of cycles – shear stress VS vertical effective stress) for individual test results of samples with 25%, 45%, and 65% relative densities and consolidated to vertical effective stress of 50, 100, 200, 400, and 600 kPa under bi-directional / circular cyclic simple shear loads.
Appendix 3: Bi-directional / elliptical cyclic simple shear test results
This appendix includes plots (shear stress path – pore water pressure ratio VS shear strain – pore water pressure ratio VS number of cycles – shear stress VS vertical effective stress) for individual test results of samples with 25%, 45%, and 65% relative densities and consolidated to vertical effective stress of 50, 100, 200, 400, and 600 kPa under bi-directional / elliptical cyclic simple shear loads.
Appendix 4: Bi-directional / figure-8 cyclic simple shear test results
xvii
A (AX, AY) Amplitude of cyclic loading
amax Maximum ground acceleration, [m/s2] CSL Critical state line
CSR Cyclic stress ratio CRR Cyclic resistance ratio
D Damping ratio of a sample in cyclic loading, [%] Drc Relative density at the end of consolidation, [%]
D50 Particle size corresponding to 50% finer soil-size particles, [mm] emax Maximum void ratio
emin Minimum void ratio e Void ratio
ec Void ratio at the end of consolidation ecs Void ratio at the critical state
f(e), F(e) Void ratio function f Frequency, [Hz]
g Gravitational acceleration, [m/s2] Gmax Small-strain shear modulus, [MPa] h Height of specimen, [mm]
Ko Coefficient of lateral earth pressure at rest Kσ Overburden pressure correction factor
Ltt Tip-to-tip distance between bender elements, [mm] Mw Earthquake magnitude
NC Number of cycles
NCL Number of cycles to trigger liquefaction n Stress exponent
Pa Atmospheric pressure, [kPa] PL Plasticity limit
ru Excess pore water pressure ratio
xviii
Vs Shear wave velocity, [m/s]
Vs1 Shear wave velocity at overburden pressure of 100 kPa, [m/s] WD Energy dissipated in one cycle of loading, [J]
WS Maximum strain energy stored in a cycle, [J] σv Total vertical (normal) stress, [kPa]
σʹv Vertical effective stress, [kPa]
σʹvc Vertical Effective stress at consolidation, [kPa] σʹcs Vertical effective stress at critical state, [kPa] ψ Critical state parameter
Φ' Effective friction angle, [degree]
Φ'cs Critical state (effective) friction angle, [degree] Φ Phase offset in cyclic loading, [degree]
γ Shear Strain, [%]
γDA Double amplitude shear strain, [%] γL Shear Strain at liquefaction, [%] Δu Excess pore water pressure, [kPa] ρ Mass density, [kg/m3]
τ Shear stress, [kPa] τcyc Cyclic shear stress, [kPa]
λcs Slope of the critical state line, [mm] λ Wavelength (Bender tests)
Γcs Critical state void ratio at 1 kPa εa Axial strain, [%]
Chapter 1
1. Introduction
1.1. Problem overview
Liquefaction of saturated sandy soils is the among major causes of destruction to structures and infrastructure in earthquake events. When cyclic loads are applied on saturated loose sands, they are likely to contract and hence impose stress from the sand matrix to the surrounding pore water. Due to increased pore water pressure and consequently decreased effective confining stress on the soil, strength, and stiffness of the soil would drop. Because of a reduced stiffness, soil deposits experience small to large deformations. Some of the most significant damages to man-made construction facilities or natural grounds were observed after earthquakes in high seismic hazard zones of the world. For example, after the 1964 Niigata (Japan) earthquake and the 1964 Prince William Sound (Alaska) earthquake, liquefaction was identified to have considerable consequences. Liquefaction also demolished the Nerlerk (Canada) artificial island, which resulted in more than $100 million financial loss. As another instance, liquefaction of the Lower San Fernando Dam (California) required a population of 80,000 to immediately leave the downstream area. Extensive failures of reclaimed lands and man-made islands due to this phenomenon were reported after the 1995 Kobe earthquake which is one of the largest ports in the world (Idriss and Boulanger 2008).
knowledge of soil behavior is based upon a limited range of soils that have been tested in the laboratory or those encountered in past field failures. Several factors (e.g. density, shear and consolidation stress levels, compressibility, and testing device and procedure) significantly affect the response of sands. The separate and mixed roles of these factors on sand behavior needs to be accurately identified to formulate and regulate soil behavior for analysis and design purposes. Extensive investigation both in the filed and laboratories are required to complete previous studies and existing knowledge on an accurate assessment of soil behavior under cyclic loads and build evaluation methods to analyze, predict and design soil interacted facilities and infrastructures with the maximum factor of safety and minimum economical requirements and consequences.
Soil cyclic and liquefaction susceptibility demands precise evaluation of cyclic loads and soil response to applied loads. Liquefaction is mainly a consequence of the earthquake, which is the main dynamic load resource in nature. The movement of ground in an earthquake is an unpredictable event due to unlimited eventual combinations of deformations and accelerations in different directions. The variable parameters of an earthquake could be mainly divided into three categories: amplitude, pattern, and frequency. Ground accelerations are usually measured and recorded in vertical and two perpendicular horizontal directions by accelerograms. A peak horizontal ground acceleration (PGA) is usually selected as the higher individual record, the mean value or the resultant value. In the structural analysis and design practice, depending on the importance of structure and location (seismic hazard) of the structure, combination of two perpendicular seismic loads have been proposed to consider this multidirectional load effect. For example, American ASCE code or Canadian NBCC provision, persuade the combination of 100% seismic loads in one direction in addition to 30% seismic loads in a perpendicular direction.
1.2. Purpose of research and thesis outline
In the current study, the bi-directional cyclic response of a silica-carbonate sand is verified by applying different two directional cyclic load combinations to help to have a better understanding of soil behavior under dynamic loads such as earthquake and specifically focused on liquefaction behavior. Although some investigations have been performed in this area before, those studies have been mainly focused on the limited type of soils and in a limited domain of densities. Another purpose of this study is to compare the behavior of a silica-carbonate sand with the previously limited type of sands such as Monterey #0,30 and Fraser river which mainly composed of a silicate mineralogy. A wide range of void ratio (relative density) increments has been chosen by applying moist tamping method for preparing specimens to have a better understanding of the cyclic load's effect on different soil states. For investigating cyclic load effects, in addition to a mono-directional load pattern, three different cyclic load patterns have been applied in this work which will be discussed in detail, later. As a brief explanation, bi-directional circular, elliptical and figure-8 load patterns have been chosen based on the limits of the test device. The reason for selection of these three patterns was to consider effective and variable factors of an actual cyclic load such as an earthquake (magnitude, frequency, and multi-directional nature). A circular pattern can represent the effect of a cyclic load with equal magnitudes in two directions but with a time lag between one direction relative to the other. An elliptical pattern can represent the effect of a cyclic load with un-equal magnitudes in two directions and with a time lag between one direction relative to the other. Finally, a figure-8 pattern can represent the effect of a cyclic load with un-equal frequencies in two perpendicular directions.
This study presents a framework for estimating the cyclic undrained shear strength for liquefaction triggering of a silica-carbonate sand by a critical-state soil mechanics approach and demonstrates the significance of cyclic load amplitudes, direction and pattern, sand compressibility, consolidation condition and density of samples in the failure of sandy soils during a liquefaction. Understanding the effects of these factors on sand cyclic shear behavior would be helpful for assessment, evaluation and prediction of liquefaction occurrence. The critical state line of the soil was obtained to effectively characterize and correlate impacting parameters in liquefaction to soil state and formulate the factors that can let us predict soil behavior as precise as possible and correlate similar in-situ soil states to its performance during shaking. Shear wave velocity of samples under different densities and consolidation stresses was also measured and correlated to soil liquefaction parameters to account for soil rigidity factors effective in its behavior.
The main purpose of shear wave velocity measurement and its correlation to soil properties is that there are various in-situ methods of measuring shear wave velocity which could be a confident way to soil assessment when coupled to laboratory-based results and analysis, although questions around accounting for behavior variation between intact soil and re-constituted soil samples remains. Finally, due to the importance of soil post-liquefaction behaviour assessment, specifically in prediction of soil response after cyclic load events such as an earthquake, which is a very common phenomenon in seismic zones, soil samples were subjected to repeating cyclic loads for liquefaction triggering (re-liquefaction) to understand how they behave compared to a first-time liquefaction.
This thesis has been prepared in "Integrated-Article" format. It is organized into 5 chapters. A brief description of the following four chapters is as follows:
Chapter 2 illustrates the shear wave velocity and shear modulus variation of reconstituted samples for a local silica-carbonate sand using a pair of bender elements. Shear modulus, damping ratio and stiffness reduction patterns were evaluated. The cyclic resistance of the samples was also assessed with constant volume cyclic simple shear tests. Moreover, critical state parameters of the soil were evaluated. The cyclic resistance of the specimens was correlated to shear wave velocity and shear modulus within a critical state framework.
Chapter 3 investigates the cyclic resistance and liquefaction susceptibility of the local silica-carbonate sand under mono-directional and three different bi-directional cyclic load patterns. In this chapter, the liquefied undrained strength ratio is correlated to the shear wave velocity and the state parameter (Ψ) for several samples at different relative densities and a wide range of consolidation stresses. Moreover, cyclic resistance, pore water pressure generation and liquefaction susceptibility of the samples are verified and compared. Multi-directional by the one-directional cyclic resistance of a silica-carbonate sand is also studied in this chapter. Chapter 4 presents the post-cyclic response and liquefied shear strength of a silica-carbonate sand under different cyclic load patterns. Cyclic load pattern, pore water pressure generation, relative density, and consolidation pressure effects on a sample’s behavior in repeating occurrence of liquefaction were evaluated.
Chapter 2
2. Characterization of a silica-carbonate sand based on shear
wave velocity measurement
2.1. Introduction
Shear wave velocity (VS) and shear modulus (G) are two of the most fundamental parameters for characterizing materials including soils and play a key role in engineering design practice. VS is used in several constitutive models to determine the small strain response of soils, to estimate the in-situ stress state of cohesionless soils (Robertson, et al., 1995), for ground deformation prediction, for seismic site classification in many design codes including the current National Building Code of Canada and the Canadian Highway Bridge Design Code, to characterize site-response for evaluating seismic hazard, and assessing the potential for liquefaction triggering of cohesionless soils (Andrus, et al., 2004, Clayton, 2011). VS can be measured both in the laboratory (e.g. bender elements or resonant column device) and in the field by down-hole, cross-hole, suspension logging and surface wave methods. Shear wave velocity (Vs) represents soil elasticity and provides a direct measure of the maximum (small-strain) shear modulus (Gmax) of a soil as shown in Equation 2.1:
= (2.1)
Hardin and Black (1966) and Robertson, et al. (1995) studied dynamic characteristics of Ottawa sand while Kokusho (1980) focused on the behavior of Toyoura sand. Both types of sands are composed of silica particles. This paper studies the dynamic behavior of a silica-carbonate sand using bender element measurements and cyclic direct simple shear (DSS) tests. Bender elements provide soil dynamic modulus at very small shear strains (< 10-5), while cyclic DSS tests are employed to augment the VS measurements from bender elements at higher cyclic shear strains (between 0.1 – 4%). The plane-strain boundary condition and simple shearing mode applied in a DSS test provide a closer representation of in-situ conditions than a triaxial test. Furthermore, a soil specimen is subjected to repeated abrupt 90o rotations of principal stresses in a cyclic triaxial test. This is very different from the smooth rotation of principal stress directions, which occurs during an actual seismic event or in a cyclic DSS tests. As shown in Figure 2.1, stiffness (shear modulus and in a similar way, damping properties) of a soil is strain dependent. Shear wave velocity measurement provides estimates of stiffness characteristics of a soil over small strain ranges, unlike cyclic shear tests which are used to evaluate soil stiffness properties at higher strain levels.
Soil subjected to symmetric cyclic loading has a non-linear behavior which results in dissipating energy in each hysteresis loop of cyclic load, illustrated in Figure 2.2. For a wave propagating through the soil, this dissipated energy will cause a decrease in the amplitude of the wave as it travels away from the source (Kramer, 1996). Increasing shear strain amplitude from dynamic loading results in more dissipated energy, and an increasing damping ratio. As the damping ratio increases, the shear stiffness of the soil decreases, weakening the material (Kramer, 1996).
Figure 2.2: Stress-strain loop of soil under cyclic loading and related parameters
Regarding past liquefaction research studies, shear wave velocity is an important parameter that is used for identification of liquefaction both in the field (in-situ) and in the laboratory. SPT, CPT and shear wave velocity are the main three in-situ tests that are currently used for field liquefaction assessment, characterization, and identification.
Among those tests, shear wave velocity is the only parameter which could be measured in the laboratory as well and thus be correlated to in-situ properties of a soil. Bender element (BE), resonant-column (RC) and Ultrasonic pulse test are the principal devices of measuring shear wave velocity in the laboratory. The RC test is relatively expensive and time-consuming in terms of preparation and calibration. Short-circuiting and loss of signal, depolarization at high voltages and small thicknesses have been noted as some of the shortcomings of BE tests. There are also several different methods for measuring shear wave velocityin situ (e.g., cross-hole, downhole, seismic CPT, and spectral analysis of surface waves (SASW)). A general advantage of shear wave velocitytests is that they can be used for sites underlain by soils that are difficult to penetrate or sample (e.g., gravels, cobbles, and boulders).
The general disadvantage of shear wave velocitytests, like other in-situ tests such as SPT and CPT, is that they provide very limited spatial distribution for characterizing site stratigraphy, e.g. they measure an average velocity over relatively large volumes (Idriss and Boulanger, 2012). Shear wave velocities have been identified to increase with increasing effective confining stress. Also, it is usual to use normalized shear wave velocity in studies. The normalization is based on overburden (σ'vc) and atmospheric (Pa = 100 kPa) pressures and a normalized shear wave velocity (VS1) is defined as below in which the overburden normalization for shear wave velocityvalues follows from the experimental observation that the maximum (low-strain) shear modulus (Gmax) in sand is approximately proportional to the square root of the effective confining stress (Idriss and Boulanger, 2008):
=
.
(2.2)
= ( ) ′ ( , ) (2.3)
Where A is a constant, f (e) is the void ratio function, σ′a (kPa) is the applied mean confining stress, n is the stress exponent, Pa is the atmospheric pressure (Pa≈100 kPa), and g (OCR, PI) is a function of over-consolidation ratio (OCR) and plasticity index (PI) estimation of soils. These factors are shown in Table 2.1 for some of the previous studies. The Vs-based liquefaction triggering has improved significantly in recent years, with more advanced correlations and more complete databases, as recently summarized by Andrus and Stokoe (2000) and Andrus et al. (2003). One of their principal research results is used to identify sands cyclic resistance ratios in liquefaction analysis and is based on shear wave velocity measurement in the fields with observed liquefaction symptoms. It appears that shear wave velocitymeasurements would be the least sensitive for distinguishing among different types of in-situ tests (e.g. SPT and CPT) (Idriss and Boulanger, 2012). Developed curves and equations for correlating in-situ test results to cyclic resistance factors of different soils are called liquefaction triggering curves and will be discussed completely and compared to current study results, in upcoming chapters.
Table 2.1: Gmax correlations of cohesionless Soils (Sawangsuriya, 2012)
Type of materials A f ( e ) n Reference
Round-grained 6900 (2.17-e)2/(1+e) 0.5 Hardin and Black (1968) Ottawa sand / Angular-grained / Crushed quartz 3270 (2.97-e)2/(1+e) 0.5 Hardin and Black (1968) Clean sand 41600 (0.67-e)/(1+e) 0.5 Shibata and Soelarno (1975) Clean sand (Cu < 1.8) 14100 (2.17-e)2/(1+e) 0.4 Iwasaki and Tatsuoka (1977)
Clean sand 9000 (2.17-e)2/(1+e) 0.4 Iwasaki et al. (1978) Toyoura sand 8400 (2.17-e)2/(1+e) 0.5 Kokusho (1980)
Clean sand 7000 (2.17-e)2/(1+e) 0.5 Yu and Richart (1984) Ticino sand 7100 (2.27-e)2/(1+e) 0.4 Lo Presti et al. (1993) Clean sand 9300 1/(e1.3) 0.45 Lo Presti et al. (1997)
2.2. Experimental plan
2.2.1. Tested material
A local silica-carbonate sand is tested in the experiments of this study. This sand was collected from Boler Mountain in London, Ontario (called "Boler sand" hereafter). The natural Boler sand contains about 11% fine particles. However, for the experiments of this study, the fines were removed to focus on the behavior of a clean sand and compare its dynamic behavior with those of other clean sands. A specific gravity (GS) of 2.67, and maximum (emax) and minimum (emin) void ratios of respectively 0.845 and 0.525 were determined following ASTM standard procedures. Particle size distribution of Boler sand is presented in Figure 2.3 with D50 = 0.25 mm. Accordingly, Boler sand is classified as a poorly-graded (SP) sand according to the Unified Soil Classification System (USCS).
Figure 2.3: Average grain size distribution of Boler sand
The solubility of carbonate (mostly CaCO3) in acid could help quantifying the amount of carbonate minerals. The results of the acid dissolution test are demonstrated in table 2.2. It is shown that two tests confirm a quantity of almost 11.8% carbonate in Boler sand.
Table 2.2: HCL dissolution test results of Boler sand for determining carbonate content
Container Weight Soil Initial Weight Container W (After) Soil Final W Lost Percentage
gr gr gr gr %
50.04 2 51.82 1.78 11.0
49.99 1.99 51.73 1.74 12.6
11.8 (Average)
2.2.2. Specimen preparation
final sublayer, the surface of each sublayer was also scarified to improve the bonding between sublayers. The top cap of the DSS apparatus was subsequently lowered on the sand surface, the membrane was folded back on the top cap and then secured with an O-ring. The retainer plates were also removed. The small amount of moisture content (5%) imparts a small amount of matric suction to a moist-tamped specimen and helps to stabilize the specimen during preparation. However, since this matric suction was not measured here, it was removed by saturating the specimens after specimen preparation. A small seating vertical stress of 5 kPa was first applied to stabilize the specimen and prevent piping. Saturation was then carried out by flushing the specimens with CO2 gas, followed by de-aired water through drainage ports on the specimen endcaps. Carbone dioxide (CO2) was used to enhance specimen saturation as it is heavier than air (so it replaces air during flushing) and it is many times more soluble in water than air. Specimen height was carefully recorded during this process to determine the precise initial void ratio of the specimen. For samples uniformity check, two relatively dense samples were prepared, frozen, cut in two halves (dividing the cylindrical specimens to top and bottom layers) and their volume and oven dried weight measured. The results are shown in Table 2.3.
Table 2.3: Uniformity check for two dense samples
The samples which were used to control the uniformity, are shown in Figure 2.5 and 2.6. Based on the results, samples are distributed by a uniformity degree of 97% and 99% which is expected for very thin layers of sands.
D H D H D H D H
mm mm mm mm mm mm mm mm
Avg. Dim. 67.23 10.08 68.48 11.21 49.50 15.00 49.50 15.00 Wdry Wbowl Wdry Wbowl Wdry Wbowl Wdry Wbowl
gr gr gr gr gr gr gr gr
255.47 205.80 254.51 196.65 242.40 198.94 234.70 192.33
V 35753.3 mm3 41248.6 mm3 28851.7 mm3 28851.7 mm3
W 49.67 gr 57.86 gr 43.46 gr 42.37 gr
ρdry 1389.2 Kg/m3 1402.7 Kg/m3 1506.3 Kg/m3 1468.5 Kg/m3
Uniformity
Top layer Bot. layer
W
ei
ght
99.04 % 97.49 %
S A M P L E 1
Top layer Bot. layer
Figure 2.5: Uniformity control with frozen sample
Figure 2.7: Sample setup after preparation (up-left) and after mounting on DSS
machine (up-right) and loading mechanism a) after consolidation b) shearing c)
constant-volume boundary condition and shear strain illustration d) 3D deformed
2.2.3. Consolidation
Following with saturation, the specimens were consolidated to an effective vertical stress (σ'vc) of 50, 100, 200, 400, or 600 kPa. The top drainage port was open during consolidation to allow excess pore pressure dissipation. Specimens void ratio after consolidation (ec) was subsequently calculated from changes in the specimen height.
2.2.4. Monotonic simple shear tests
Assessment of sands behavior under monotonic undrained loading has been mostly developed from triaxial tests on reconstituted samples. Based early test results (Castro, 1969; Lee and Seed, 1970; Castro et al., 1982; Vaid and Chern, 1985; Vaid and Thomas, 1992; and Ishihara, 1993), responses of samples are mostly dependant on void ratio changes (relative density) as well as confining stress.
Three types of behavior were mainly recognized in sand samples when a monotonic shear load is applied. In type 1 response which is a typical characteristic of loose sands, (Shown in Figure 2.8) by the progress of shear deformation, the strength of soil reaches its maximum value and then decreases to a stable or critical state. This flow like deformations after reaching the peak of stress-strain curve (undrained yield strength, Su) is the major cause of in-situ failures. This strain softening type of response was called "static liquefaction” by Castro (1969), Casagrande (1975), and Seed (1979). Nonetheless, some of the materials, demonstrate partial or limited flow deformations. In this type of response, pore water pressure increases gradually and reaches its maximum value and decreases again towards the end of shearing (shown in Figure 2.8). This type of behavior is a full contractive behavior.
Figure 2.8: Characteristic response of sands under undrained static loading (Chern, 1985) Shear strain
Shear strain
Normal effective stress
There is a general agreement between researchers that some of the soil characteristics such as friction angle (strength) mobilised at critical state (type 1) or phase transformation (type 2) state, are unique material properties (Castro, 1969; Vaid and Chern, 1985; Vaid and Sivathayalan, 2000) irrespective of void ratio, initial state, mode of loading, sample preparation method, intermediate principal stress values and rotation of principal stress axis.
At a constant vertical effective stress, the behaviour of the soil changes from contractive to dilative while relative density increases (Bishop, 1971; Been et al., 1991; Vaid and Thomas, 1995; Vaid and Sivathayalan, 1996; Vaid and Uthaykumar, 1998). On the other hand, at a constant relative density, increasing confining stress, amplifies the contractive response of the samples. In the current study, monotonic drained and constant-volume simple shear tests were carried out to determine liquefaction susceptibility, static shear behavior, and the critical state line of Boler sand. A summary of tests is shown in Tables 2.4 and 2.5.
Table 2.4: Summary of monotonic drained simple shear tests of Boler sand
ID
σ
'
vce
cD
rce
csσ
'
vc,skPa % kPa
D1 50 0.812 10.3 0.782 50
D2 300 0.793 16.3 0.745 300
D3 50 0.795 15.6 0.802 50
D4 100 0.753 28.8 0.753 100
D5 400 0.756 27.8 0.733 400
D6 100 0.697 46.3 0.698 100
D7 400 0.699 45.6 0.697 400
D8 50 0.621 70.0 0.626 50
D9 80 0.77 23.4 0.758 80
D10 200 0.771 23.1 0.767 200
D11 400 0.749 30.0 0.727 400
D12 500 0.732 35.3 0.709 500
Table 2.5: Summary of monotonic constant-volume simple shear tests of Boler sand
2.2.5. Critical state approach
Been and Jefferies (1985) introduced the state parameter (Ψ) to describe the shearing behavior of a soil based on the combination of void ratio, effective stress and their relation to the critical state void ratio at same effective stress. The critical state line (CSL) represents a boundary between strain-softening (or contractive) and strain-hardening (or dilative) behaviors of a soil where ψ is the difference between the current void ratio (e)and the critical-state void ratio (ecs) for certain value of stress. Denser soils have negative ψ, and loose contractive soils have positive ψ. Monotonic drained and undrained simple shear tests could be applied to extract soil critical state line which is a unique characteristic of a soil. An equation of critical state line, correlating void ratio and vertical effective stress characteristics of a soil is defined as:
= − ( ) (2.4)
ID
σ
'
vce
cD
rce
csσ
'
vc,skPa % kPa
CV1 100 0.812 10.3 0.812 59
CV2 300 0.778 20.9 0.778 42
CV3 200 0.809 11.3 0.809 20
CV4 400 0.750 29.7 0.750 87
CV5 300 0.763 25.6 0.763 72
CV6 150 0.697 46.3 0.697 56
CV7 100 0.802 13.4 0.802 11
CV8 400 0.621 70.0 0.621 96
CV9 800 0.728 36.6 0.728 187
CV10 100 0.762 25.9 0.762 41
CV11 400 0.749 30.0 0.749 213
CV12 800 0.732 35.3 0.732 432
CV13 1000 0.706 43.4 0.706 346
CV14 1200
0.697
46.3
0.697421
CV15 100
0.629
67.5
0.62936
In which, ΓCS is the soil critical void ratio at σ’vc (vertical effective stress) = 1 kPa and λcs is the slope of the critical state line in an e - log σ’vc plane. This is also shown in Figure 2.9.
Figure 2.9: Critical state line introduction and overview of parameters for Boler sand
Undrained shear strength at the critical state is termed “undrained critical shear strength”, Su(critical), which is also the minimum undrained shear strength mobilized in liquefaction flow failures. Sadrekarimi (2013) suggests characterization of Su(critical) by using Su(critical)/ σ’vc. For strain-hardening sands (Ψ< 0), Su(critical) exceeds the drained shear strength due to negative excessive pore-water pressure (suction) generation, whereas in real field conditions cavitation will occur (Brandon et al. 2006) and limits Su(critical) to the drained critical strength ratio (= tan
angle and undrained strength) at liquefaction. Sands compressibility, critical state parameters, and effective stress were reported the most effective parameters on soil undrained strength in the critical state, unlike soil variation of soil critical state friction angle that seems to be less impacting (Sadrekarimi, 2013). In another research study, Sadrekarimi and Olson demonstrated the effects of initial soil fabric and particle characteristics by testing a variety of samples under different sample preparation methods (Sadrekrimi and Olson, 2013).
2.2.6. Cyclic DSS tests
Similar mechanisms that were identified in monotonic loading, can be identified in cyclic loading as well. A progressive increment of pore water pressure and deformation could be observed with increasing number of shearing cycles. A contractive (strain softening) behaviour for loose samples which may be followed by cyclic mobility for medium dense sands (called phase transformation) and finally a complete dilative behavior and cyclic mobility as a response of denser sands have been realized in several past researches.
In the current study, constant-volume cyclic simple shear tests were carried out to determine the cyclic response and liquefaction behavior of Boler sand. Similar to the constant-volume monotonic tests, a constant-volume condition was imposed in these tests by precisely adjusting the vertical stress. Stress-controlled shearing was performed by cycling shear stress within a certain range of stresses at a frequency of 0.1 Hz. Cyclic stress ratio (CSR) is determined as the ratio of the peak shear stress (max) to σ'vc.
Figure 2.10: Typical respons of Boler sand in mono-directional cyclic simple shear tests
Table 2.6: Summary of mono-directional cyclic simple shear tests
2.2.7. Shear wave velocity measurement
Shear wave velocity of the specimens was measured by a pair of piezoelectric bender elements embedded with epoxy into the platens of the DSS apparatus. The epoxy-coated bender elements protruded 1 mm into the specimen. Marjanovic and Germaine (2013) show that this bender element setup (shorter and wider tips) produces the best shear waves without significant interference from compression waves. A sinusoidal pulse was applied to the transmitting bender element, which provides high versatility in selecting a signal frequency and amplitude (compared to square waves). A high voltage of ±14 Volts was chosen to improve the signal to noise ratio. Taller specimens of 30 mm high were prepared for measuring shear wave velocity (VS) to increase VS travel distance and improve signal resolution. Shear wave velocity was measured after allowing about 30 minutes of consolidation at σ'vc. Earlier studies (Lee and Santamarina, 2005, Sanchez-Salinero, et al., 1986, Viggiani and Atkinson, 1995) have often recommended wavelengths (λ) of at least twice the distance between the bender element tips
σ
'
vcAvg. Avg. D
rcTest Freq.
CSR values
(kPa)
e
c(% )
Type
(Hz)
50 0.764 25.3 M 0.1 0.062 - 0.071 - 0.080
100 0.764 25.3 M 0.1 0.067 - 0.080 - 0.090
200 0.768 24.1 M 0.1 0.080 - 0.090 - 0.100
400 0.769 23.8 M 0.1 0.090 - 0.100 - 0.110
600 0.763 25.6 M 0.1 0.100 - 0.110 - 0.125
50 0.701 45.0 M 0.1 0.073 - 0.082 - 0.094
100 0.700 45.3 M 0.1 0.083 - 0.097 - 0.103
200 0.706 43.4 M 0.1 0.08 - 0.102 - 0.112
400 0.709 42.5 M 0.1 0.122 - 0.131 - 0.151
600 0.694 47.2 M 0.1 0.131 - 0.141 - 0.161
50 0.643 63.1 M 0.1 0.047 - 0.071 - 0.093
100 0.635 65.6 M 0.1 0.079 - 0.095 - 0.105
200 0.639 64.4 M 0.1 0.104 - 0.118 - 0.132
400 0.634 65.9 M 0.1 0.122 - 0.137 - 0.151
(Ltt) to reduce near-field effects and allow for the development and propagation of shear waves. Besides preparing taller specimens (= 30 mm), a high frequency (36 kHz) signal was also used to produce short wavelengths and generate at least 2 wavelengths between the bender elements (Ltt/λ > 2). The high signal frequency used in the bender element tests further minimized dispersion from wave reflections at specimen boundaries (Alvarado and Coop 2012). Table 2.7 summarizes the characteristics of shear wave velocity measurement samples of this study. Total of 15 samples in 3 different relative densities under 5 different consolidation stresses was used for analysis. Three different frequencies were applied for bender elements to obtain the most accurate results. Although the difference of result for different frequencies were negligible, wavelength ratio criteria of Ltt/λ > 2 was met in all of the experiments and a 50-kHz frequency was selected for results.
Table 2.7: Summary of characteristics for shear wave velocity measurement tests
σ'
vcAvg. D
rcFreq. 1
Freq. 2
Freq. 3
(kPa)
(% )
(kHz)
(kHz)
(kHz)
50
25
35.7
50
83.3
50
45
35.7
50
83.3
50
65
35.7
50
83.3
100
25
35.7
50
83.3
100
45
35.7
50
83.3
100
65
35.7
50
83.3
200
25
35.7
50
83.3
200
45
35.7
50
83.3
200
65
35.7
50
83.3
400
25
35.7
50
83.3
400
45
35.7
50
83.3
400
65
35.7
50
83.3
600
25
35.7
50
83.3
600
45
35.7
50
83.3
2.3. Test results
2.3.1. Monotonic drained and constant-volume simple shear tests
Constant-volume shear was replicated by maintaining a constant specimen volume. This was performed using the electronic feedback and control system of the DSS apparatus by precisely adjusting the vertical stress to prevent any volume change during shearing. Volume change resulted from changes in specimen height as the area of the specimen was kept constant by the stainless-steel rings. Since pore water pressure was not measured in the DSS apparatus, the top drainage port was left open during shearing. Changes in total vertical stress during constant-volume shear were considered as an equivalent excess pore water pressure which would have developed in an undrained shear test (Dyvik, et al., 1987).
Monotonic shearing was carried out at a shear strain rate of 3% / hour up to a shear strain of 30%. Both strain hardening (dilative) and softening (contractive) behavior could be diagnosed from the results of constant-volume tests which is shown in plots of Figure 2.11. As it is clearly shown in Axial stress plot, the majority the tests terminated in a critical state in the range of applicable strains and regarding their state (relative density and initial consolidation stress). The majority of tests display a significant strain-softening and static liquefaction behavior. A reduction in vertical effective stress σ'vc is assumed to be equivalent to the shear-induced pore pressure generated in an undrained condition for each test. In drained shear tests, a constant effective vertical stress (= σ'vc) was maintained while changes in specimen height were carefully recorded to determine void ratio changes. The results of drained shear tests are shown in Figure 2.12. Both strain hardening (dilative) and softening (contractive) behavior could be diagnosed from the results which are shown in plots. As it is clearly shown in volumetric strain plot, a few of the tests terminated in a critical state in the range of applicable strains and regarding their state (relative density and initial consolidation stress).
simple shear testing of fine grain soils) most of the practical direct simple shear experiences are based on strain rate of 5% / hour. In the current study, although higher drainage rate is expected from a sand compared to a clayey soil, small rate of shearing (0.01 mm/min) was selected in performing tests to prevent any eventual generation of pore water pressure and undrained condition. Drained water could be directed out of samples by the performance of porous platens enclosing the soil sample from top and bottom and considering a relatively small height (20 mm) to large diameter (70.1 mm) of samples.
2.3.2. Critical state line location
As it was discussed in previous sections, only some of the samples reached a critical state point for the range of applied strains and according to their initial state. Table 2.8, summarizes the tests which were clearly reaching a critical state and were selected for the establishment of the critical state line of Boler sand.
Table 2.8: Summary of selected monotonic DSS tests (for CSL establishment)
The critical state is taken at the minimum shear stress reached after failure, although some tests displayed “phase transformation” (Ishihara, 1993) to a strain-hardening (or dilative) behavior after an extended range of constant volume, shear, and effective vertical stresses. An overall frictional angle of Φ'cs = 30o is determined at the critical state from both constant-volume and drained tests. Table 2.8 shows void ratio (ecs) and effective vertical stress (σ'v,cs) at the critical state of both drained and constant-volume shear tests. These data are plotted in Figure 2.13 to establish the CSL for Boler sand as below:
= 0.888−0.071 ( ) (2.5)
σ
'
vce
cD
rce
csσ
'
v,csDrainage
(kPa)
(% )
(kPa)
100 0.762 26 0.762 40.8
100 0.802 13 0.802 11.3
200 0.809 11 0.809 19.6
300 0.778 21 0.778 41.5
300 0.763 26 0.763 71.8
400 0.75 30 0.75 86.6
800 0.728 37 0.728 187
1000 0.706 43 0.706 346
1200 0.697 46 0.697 421
50 0.812 10 0.782 50
80 0.77 23 0.758 80
100 0.753 29 0.753 100
400 0.699 46 0.697 400
Constant Volume
This equation suggests a critical void ratio of 0.888 at an effective stress of σ'vc = 1 kPa and a critical state line slope of 0.071. CSL of Boler sand is comparable to those for Monterey #0 sand (Jefferies and Been, 2006) and Hokksund sand (Castro, 1969) determined from isotropically-consolidated triaxial compression shear tests. These are compared in Figure 2.13 assuming a horizontal stress ratio of Ko = 0.5 for the converting isotropic effective confining stress (in triaxial tests) to σ'vc.
Figure 2.13: Critical state lines of Boler (from this study), Hokksund (Castro, 1969),
and Monterey #0 (Jefferies and Been, 2006) sands
2.3.3. Shear wave velocity measurement
Bender elements are piezoelectric cantilever beam-shaped transducers which either bend by an applied voltage or produce a voltage when it is bent. Despite their simple operation, the interpretation of bender element pules can be complicated. While the wave travel distance can be confidently taken as the tip-to-tip distance (Ltt) between the bender elements (Brignoli, et
0.6 0.7 0.8 0.9 1
1 10 100 1000
V
o
id
r
at
io
, e
Effective vertical stress,
σ
'
v(kPa)
Constant-volume testsDrained tests Boler sand:
e = 0.888 - 0.071Log(σ'v)
Hokksund sand
al., 1996, Viggiani and Atkinson, 1995), identifying the correct travel time is often challenging. Various time and frequency domain methods (Jovicic, et al., 1996, Lee and Santamarina, 2005) are suggested by different researchers to determine travel time. Shear wave propagation through soil sample from a source to a receiver bender element is shown in Figure 2.14.
Figure 2.14: Shear wave (S wave) propagation in soil sample
Figure 2.15 illustrates the transmitted and received shear waves for the experiments. The reverse polarity of the initial small bumps is a characteristic of near-field effects and compression waves generated from the lateral vibration of the bender elements. These compression-wave signals travel faster and reach the receiving bender element earlier than a shear wave, but rapidly decay in subsequent reflections from the endcaps (Camacho-Tauta, et al., 2015).
Low amplitude pulses in the received signal have been observed in other bender-element studies (Arulnathan, et al., 1998, Brandenberg, et al., 2008, Brignoli, et al., 1996), which are often associated with distorted compression waves reflected from the specimen boundaries. These were thus disregarded. The tip-to-tip distance between the bender elements (Ltt) was measured by subtracting the height of the bender elements from the specimen height.
L
ttS
o
il
s
a
m
p
le
Almost all obtained output signals in the present study exhibited a clear major peak (shear-wave). Hence, the peak-to-peak time of the first transmitted and received signals was used to measure travel time (ΔtTR) and determine VS. Several investigators suggest that this approach can provide an accurate measurement of VS (Brignoli, et al., 1996, Camacho-Tauta, et al., 2015, Jovicic, et al., 1996, Lee and Santamarina, 2005, Viggiani and Atkinson, 1995, Yamashita, et al., 2009) which match well with VS measured by other laboratory techniques (e.g., resonant column tests, acceleration measurements, etc). For example, Yamashita et al. (2009) found that the peak-to-peak time difference between transmitted and received signals provided the most consistent determination of VS travel time using bender elements among 23 different laboratories around the world. Accordingly, VS was determined as ΔtTR/Ltt.
Measurements carried out at higher input frequencies (50 & 83 kHz) results in similar travel times and VS, suggesting that VS remains unaltered by changes in input frequency. Shear wave velocity is often expressed as a function of void ratio, F(e) and effective confining pressure (σ'c) as below (Hardin and Richart Jr., 1963):
= ( ). ′ (2.6)
Where exponent β is a material constant which reflects the nature of inter-particle contacts (Santamarina, et al., 2001). For the Ko-consolidated simple shear samples of this study, σ'c can be approximated as (1+2Ko) σ'vc. Because of the difficulties in determining Ko in the field, it is simpler to express VS as a function of σ'vc. The influence of effective stress on any soil parameter is usually considered in geotechnical engineering practice by normalization to σ'vc = 100 kPa. Like the overburden stress correction used for SPT or CPT penetration resistances, Equation (2.7) is used to account for the effect of overburden pressure on VS.
Robertson, et al., 1995) suggest a linear variation of F(e) with the void ratio. As shown in Figure 2.17, the VS data of this study also indicate an approximately linear relationship for F(e) which is quite close to the relationship derived by Hardin and Richart Jr. (1963). Figure 2.17 further suggests a slightly decreasing trend of F(e) and thus VS with increasing void ratio (like Hardin and Richart 1963). Similar to Boler sand, some other studies also report a narrow range of VS for a wide range of void ratios (Cha, et al., 2014, Roe, 1981, Santamarina, et al., 2001). According to Figures 2.16 and 2.27, Equation 2.8 is a proper fit for Boler sand to correlate shear wave velocity variation with void ratio and vertical effective stress.
= . ( ) (2.7)
= (89.4−26.6 ) . (2.8)
Figure 2.16: Variation of VS with normalized σ'vc for Boler sand 0 1 2 3 4 5 6 7
100 150 200 250 300 350 400
σ
'
vc/P
a
V
S(m/s)
Drc = 65%
Drc = 45%
Drc = 25%
Boler sand:
VS1/VS= (Pa/σ'vc)0.25
Figure 2.17: Variation of F(e) with consolidation void ratio (ec) from this study for Boler sand and comparison with the correlation derived by Hardin and Richart (1963)
Figure 2.18: Shear wave velocity (VS) versus state parameter (Ψ) from the DSS tests
50 60 70 80 90 100
0.60 0.65 0.70 0.75 0.80
F
(e
)
=
V
S
/
σ
'vc
β
Void ratio, ec
Hardin & Richart (1963)
Boler sand:
As both the shearing behavior (e.g. in Fig. 2.12) and VS (in Figs. 2.17 & 2.18) of Boler sand are affected by ec and σ'vc, VS can be used to determine the liquefaction susceptibility and strain-softening potential of Boler sand. Figure 2.18 presents the variations in state parameter (determined from Eq. 2.5 and definition given in Figure 2.9) with VS data for the specimens tested in this study.
2.3.4. Evaluation of maximum shear modulus (Gmax)
As discussed in the introduction, calculation of small-strain or maximum shear modulus of a soil is one of the main purposes of measuring shear wave velocity. Gmax is a useful and practical parameter for engineering design purposes which correlates soil deformation properties to applied stress. Gmax is calculated for the specimens of this study using Equation 2.1.
As shown in Figure 2.19, Gmax largely increases with increasing σ'vc for a particular ec, whereas the effect of ec seems to be secondary. It can be explained that increasing σ'vc not only raises ρ but also decreases the propagation distance between the bender elements (Ltt), resulting in a greater VS and hence Gmax. Several empirical correlations have been developed for Gmax characterization, all of which consider void ratio and effective stress as in the following form (Hardin and Richart Jr., 1963, Jamiolkowski, et al., 1991):
= ( ). (2.9)
Figure 2.19: Variation of Gmax with σ'vc for Boler sand at Drc = 25, 45, and 65%
Figure 2.20: Variations of AF'(e) with ec for Boler sand and suggested values by several other studies (Hardin 1978; Iwasaki et al. 1978; Kokusho 1980) for clean sands
0 50 100 150 200 250 300
0 1 2 3 4 5 6 7
Gm a x (M P a)
σ'vc/Pa
Drc = 65%
Drc = 45%
Drc = 25%
500 750 1000 1250 1500
0.60 0.65 0.70 0.75 0.80
A
F
'(e)
=
G
m ax/(
σ
'
c nP
a 1 -n)
Void ratio, e
cKokusho (1980):
AF'(e) = 840(2.27 - ec)2/(1+ec)
Boler sand:
AF'(e) = 614(2.64 - ec)
Iwasaki et al. (1978):
AF'(e) = 900(2.17 - ec)2/(1+ec)
Hardin (1978):
2.3.5. Mono-directional cyclic simple shear test results
Mono-directional cyclic simple shear tests were carried out to determine the cyclic liquefaction behavior of Boler sand. Figure 2.21 shows typical results of the cyclic DSS tests of this study. According to these plots, liquefaction is triggered when excess pore pressure ratio (ru) exceeds 90%. This corresponded to reaching a double-amplitude cyclic shear strain of 7.5% in the DSS tests. This is essentially equivalent to the liquefaction definition (Vaid and Sivathayalan, 1996) of 5% double-amplitude axial strain in a triaxial test. Liquefaction triggering is followed by a much larger increase in cyclic shear strain and loss of shear stiffness in Figure 2.21.