TASKE Call Center Management
Tools
Version 8
Application User Manual
Reporting, Monitoring, Scheduling, and Analysis Solutions for the
© Copyright 2001, TASKE Technology Inc. All rights reserved. Printed in Canada.
Information in this document is subject to change without notice and does not represent a commitment on the part of TASKE Technology Inc. The software described in this document is furnished under a license agreement. The software may be used only in accordance with the terms of the agreement. No part of this manual may be reproduced or transmitted in any form or by any means, electronic or mechanical, including
Table of Contents
Table of Contents ...i
TASKE Call Center Management Tools...1
Using this Guide...1
TASKE Information Server ...3
Starting the Information Server...4
Viewing Client Connections ...5
Status ...6
Disconnect...6
Details ...6
Messages ...6
Viewing the SMDR Connection ...7
SMDR Events...7
Communications...7
Viewing Chat Connections...8
Chat Members...8
Viewing License Information...9
Viewing General Information ...11
TASKE Server Information...11
Integrating PrimeTime with TASKE ...11
Setting the Real-time Adherence Schedule File Location ...12
Showing Data Alarms ...13
Closing Versus Exiting the Information Server ...14
Closing the Information Server...14
Exiting the Information Server...14
TASKE Enterprise...16
Checking for Enterprise Licensing ...18
Viewing Enterprise Site Connections...19
Status ...19
Details ...20
Last Message ...20
Deactivating an Enterprise Site Connection ...24
Locking Sites and Disconnecting Clients...25
Locking an Enterprise Site ...25
Disconnecting All Clients from an Enterprise Site...26
TASKE Network Client ...27
Using the Network Client Interface ...27
Status ...28
Last Message ...28
TASKE Administrator...29
Starting the Administrator ...29
Opening the Administrator Using the Start Button ...29
Opening the Administrator from the TASKE Program Folder ...30
Using the Menu Bar ...30
File Menu...30
View Menu...32
Help Menu ...32
Using the Main Control Panel ...32
Mode Selection...33
Table Selection in Database Mode ...33
Tool Selection in Configuration Mode ...33
Selecting a Mode ...34
Using the Database Mode ...35
Using the Database Mode Interface...35
Exporting the TASKE Database...36
Defining Trunks ...38
Defining Trunk Groups ...40
Defining Extensions ...43
Defining Extension Groups ...45
Defining Agents ...47
Defining Agent Groups ...50
Defining Queues...52
Queue Groups...55
Defining Qualifier Codes ...57
Defining Spectrums...59
Defining Options...61
Defining DNIS Numbers...63
Using the Configuration Mode ...65
Using the Configuration Mode Interface ...65
Using the Event Log...66
Administrator Glossary...85
TASKE ACD Monitor ...88
Real-time Mode...88
Replay Mode...88
ACD Monitor Interface ...88
Starting the TASKE ACD / Enterprise ACD Monitor...90
Network Client ...90
Using the Menu Bar ...90
File Menu...91
View Menu...91
Properties Menu ...92
Replay Menu - Replay Mode Only ...93
Chat Menu...94
Help Menu ...94
Using the Main Control Panel ...95
Mode Selection...95
Date and Time...95
Queue Manager ...95
Queue Monitor List ...96
Replay Date Selection...96
Replay Control...96
Using the Queue Manager...97
Queue Selector ...97
Properties for Selected Queue(s)...98
Closing the Queue Manager ...99
Enabling and Disabling the Monitoring of Queues and Queue Groups ...99
Setting Alarm Parameters for Queues and Queue Groups ...101
Selecting a Mode: Real-time or Replay ...102
The Queue Information Display Area ...102
Displaying Queue and Queue Group Information ...103
Alarm Situations ...104
Overview of the Queue Panels ...104
Real-time Panel...104
Review Panel ...104
Recognizing Alarm Situations...105
Monitoring with Agent Maps...115
Filtering the Agent States Report and Agent Maps...119
Accessing Recent Historical Information ...121
Using the Replay Mode...127
Selecting the Replay Date...128
Using the Replay Controls ...129
Setting the Replay Speed ...130
Setting Trigger Stops in Replay ...131
Using the Enterprise ACD Monitor...132
Monitoring Remote Sites...133
ACD Monitor Glossary ...134
TASKE Reports...138
Starting TASKE Reports ...138
Opening Reports Using the Start Button...138
Opening Reports from the TASKE Program Folder...139
Using the Menu Bar ...139
File Menu...139
Help Menu ...140
Using the Main Control Panel ...141
Daily Reports...145
Weekly Reports ...145
Monthly Reports ...146
Year By Week Reports...146
Year By Month Reports...147
Forecast Reports...147
Using the Report Templates Panel...148
Using the Properties Window...149
Defining Export Properties for Reports ...152
Using the Forecast Properties Window...155
Using the Publication Viewer ...160
Changing the Report Font...161
Manually Exporting a Report...161
Manually Printing a Report...163
Generating Reports...163
Generating Reports from Existing Templates ...164
Creating Trunk Report Templates...165
Creating Extension Report Templates ...167
Creating Extension Group Report Templates ...169
Creating Agent Report Templates...172
Creating Queue Abandon Spectrum Report Templates ...182
Creating Queue Interflow Spectrum Report Templates ...184
Creating Queue Activity Report Templates...187
Creating Queue Peaks Report Templates ...190
Creating Queue Group Report Templates ...192
Creating Queue Group Answer Spectrum Report Templates ...195
Creating Queue Group Abandon Spectrum Report Templates ...197
Creating Queue Group Interflow Spectrum Report Templates...200
Creating Queue Group Activity Report Templates...203
Creating Queue Group Peaks Report Templates ...205
Creating Forecast Report Templates ...208
Printing and Exporting Reports Automatically ...211
Scheduling Reports to Print and Export Automatically ...211
Using Enterprise Reports...213
Creating Enterprise Reports...214
Using Notification Reports ...216
Generating Notification Reports ...217
Notification Report Events...218
Traffic Analyzer...219
Overview of the Traffic Analyzer Interface...219
Menu Bar...220
Tool Bar...220
Main Window...220
Status Bar...220
Understanding Traffic Concepts ...221
Busy Hour/Busy Season ...221
Blocking...222
Queue Delay/Call Abandons...222
Call Duration...222
Service Criteria...223
Creating a Traffic Analysis ...223
Service Percentage - Level of Abandons...225
Telephone Service Factor - Speed of Answer ...225
Creating an Erlang C Traffic Analysis ...226
Erlang C Traffic Calculations...227
Creating an Erlang B Traffic Analysis ...231
Calculating Staffing Requirements ...241
Traffic Model Information Panel ...241
Data Table Panel...241
Graph Panel ...241
Using the Cost Justification Guide...242
Call Center Cost Dynamics ...242
TASKE Agent Desktop ...244
Starting Agent Desktop...245
Opening the Agent Desktop Using the Start Button...245
Opening the Agent Desktop from the TASKE Program Folder...245
Using the Agent Desktop Interface ...245
Adjusting the Window Size and Position...246
Agent Desktop Display Window: Hide/Restore Versus Always on Top...246
Creating, Saving, and Opening Agent Desktop Settings...247
Creating a New Settings File...247
Saving a New Settings File ...247
Saving an Existing Settings File...248
Opening a Settings File...248
Adding, Editing, and Deleting ACD Variables...249
Adding ACD Variables to the Agent Desktop Window...249
Editing ACD Variables...249
Deleting ACD Variables ...250
Defining Thresholds for ACD Variables ...250
Filtering Cell Information ...252
Selecting Cell Information for Display ...252
Docking the Agent Desktop Window to the PC Desktop ...253
Docking the Agent Desktop Window...253
Undocking the Agent Desktop Window...253
Changing the Variable Display ...254
Changing the Display Order of Variables...254
Displaying Variables Horizontally...254
Displaying Variables Vertically ...255
Displaying the Agent Desktop as a Grid ...255
Changing the Font ...256
Exiting from the Agent Desktop Application...256
TASKE Search ...257
Using the Search Interface ...257
Main Window...257
Opening PBX files...259
Printing Search Information ...259
Print Preview from the Main Window ...259
Printing the Main Window Contents ...260
Printing the Information Window Contents...260
Copying Information to the Clipboard ...260
Saving Search Information ...261
Using the Search Commands...261
Using the File Menu ...261
Using the Edit Menu ...262
Using the View Menu ...263
Using the Tools Menu ...265
Using the Window Menu ...266
Using the Help Menu...267
Understanding Call Event Records...268
Identifying ACD Events ...269
Identifying COL Events ...274
Identifying ICM Events ...277
Sorting Records by Call ID...281
Explaining Call Records ...282
Filtering Call Records by Event ...283
Selecting Events...284
Searching for a Pattern ...285
Using Additional Filters ...285
Filtering Call Records by Call Type ...286
Selecting the Call State...287
Selecting the Time Period ...288
Selecting the Call Type ...288
Selecting Database Members ...289
TASKE Chat ...290
Logging Into and Out of Chat from the ACD Monitor...291
Logging Out of Chat ...291
Logging into Chat ...291
Opening the Chat Window from the ACD Monitor...292
Logging Into and Out of Chat from the Agent Desktop...292
Chat Panel...294
Outgoing Message Panel...294
Maintaining the Contact List ...295
Adding Contacts to the Contact List...295
Removing Contacts from the Contact List ...295
Understanding Contact Status Symbols ...296
Requesting a Chat ...296
To Send a Chat Request to an Individual ...296
Accepting or Rejecting a Chat Request...297
To Accept a Chat Request ...298
To Reject a Chat Request...298
Broadcasting a Message - Supervisors Only ...298
To Broadcast a Message ...298
Receiving Broadcast Messages ...299
Conducting a Chat Session ...299
To Send an Outgoing Message ...299
Receiving Incoming Messages ...300
Switching between Chat Sessions ...300
Save Time Using Copy and Paste...301
Copying Text in the Chat Panel ...301
Pasting Text into the Outgoing Message Panel...303
Ending a Chat Session ...304
To Terminate a Chat Session with an Individual...304
When a Chat Session is Terminated by the Other Party ...304
TASKE WallSign ...305
The WallSign Server ...305
The WallSign Administrator ...306
Overriding A Sign Plan with Quick Messages...306
Creating Custom Graphics...307
WallSign Startup and Shutdown ...307
Starting the WallSign Administrator ...307
Starting the WallSign Server ...307
Shutting Down the WallSign Administrator ...308
Shutting Down the WallSign Server ...308
Using the WallSign Server ...308
Using the WallSign Administrator ...309
Sign Plan Components ...309
Using the Menu Bar ...310
Tools Menu...313
Help Menu ...314
Using the Main Control Panel ...314
Mode Selection...314
Window Selection...314
Selecting a Mode in the WallSign Administrator...315
Configuration Mode ...315
View Mode...316
Configuring Communication Paths ...316
Sending Test Messages to Reader Boards ...317
Configuring the Sign Tone ...317
Using the ACD Variables Window ...319
Components of the ACD Variables Window ...319
Setting the ACD Variable Color...321
Defining ACD Variables ...322
Deleting ACD Variables ...322
Using the Messages and Quick Messages Windows...323
Components of the Messages and Quick Messages Windows...323
Building Messages and Quick Messages ...327
Selecting the Line Position...328
Adding Special Effects ...329
Adding Special Graphics...331
Adding Character Formatting ...331
Adding Color to a Message...334
Quick Message Display Options ...335
Starting and Stopping Quick Messages...336
Deleting Messages and Quick Messages...337
Using the Decisions Window ...338
Decisions Window Components ...338
Defining Decision Trees ...341
Default and Conditional Decisions ...341
Deleting A Decision Tree ...342
Using the Days Window...343
Days Window Components...343
Defining Special Days ...345
Defining Specific Dates ...345
Using the Scripts Window...351
Scripts Window Components ...351
Defining a Script ...353
Deleting a Script ...354
Using the Signs Window...355
Signs Window Components ...355
Defining A Sign (Spectrum Reader Board) ...357
Deleting a Sign ...358
Using the Graphics Window ...359
Graphics Window Components...359
Creating Custom Graphics...361
Dimensions...362
Using the Color Palette and Drawing Platform ...362
Deleting Custom Graphics ...363
TASKE Voice ToolBox ...364
Controlling Media Using Voice Plans...365
Voice ToolBox Startup and Shutdown ...366
Starting the Voice Administrator...366
Starting the Voice Server ...366
Shutting Down the Voice Administrator...366
Shutting Down the Voice Server ...367
Using the Voice Administrator Interface ...367
Menu Bar...367
Main Control Panel...368
Display Area ...369
Selecting a Mode ...369
Configuration Mode ...370
View Mode...370
Setting System Parameters ...370
Configuring Communication Paths ...371
Updating System Data in the Voice Server ...372
Updating System Data Using the Send Data to Voice Machine Option ...372
Defining Test Variables...373
Using the Messages Window ...374
Messages Window Components...374
Using the Tools of the Messages Window...375
Building a Message ...377
Deleting a Message ...378
Using the Auto-attendants Window ...379
Using Play Nodes...382
Using Get Digit Nodes...384
Using Digit Nodes...384
Using Dial Nodes...385
Using Supervisor Nodes ...386
Defining Auto-attendants...386
Deleting Auto-attendants...388
Using the Day Plans Window ...389
Day Plans Window Components...389
Using the Tools of the Day Plans Window...390
Defining Day Plans...391
Deleting a Day Plan ...392
Using the Days Window...393
Days Window Components...393
Defining Specific Dates ...394
Defining Reference Dates ...395
Deleting Special Days ...396
Using the Scripts Window...397
Scripts Window Components ...397
Using the Tools of the Scripts Window ...398
Defining a Script ...399
Deleting a Script ...400
Using the Channels Window...401
Channels Window Components...401
Defining a Voice Channel...402
Setting Channel Parameters ...403
Properties of a Voice Channel ...404
Deleting a Voice Channel...405
Remote Programming...406
Accessing System Messaging ...407
Reviewing the System Message ...408
Recording Messages ...409
Reviewing, Re-recording, and Saving Messages ...410
Identifying System Sounds ...411
Glossary of Terms ...418
TASKE Call Center Management Tools
Welcome to the TASKE Call Center Management Tools, a collection of Microsoft Windows based tools and utilities. These applications aid supervisors in analyzing the performance of the ACD call center and fine-tune its operation.
After installing the software, access the applications of the TASKE ACD ToolBox
through the TASKE ToolBox folder on the desktop of the PC, or through the Start button on the Windows task bar. Each application within the TASKE ToolBox folder provides the functionality for a particular aspect of call center management.
Using this Guide
This guide has a section for each application in the TASKE ACD ToolBox. For installation and configuration instruction, refer to the Installation and Configuration Guide for version 8.0 of the TASKE Call Center Management Tools.
The contents of the TASKE ACD ToolBox vary depending on the type of installation performed on the PC (Server, Supervisor, Enterprise Supervisor, or Agent). The table below outlines the components installed with each type of installation.
Installation Type Components Installed
Server • Information Server
• Administrator • Reports
• ACD Monitor with Chat • Search
• Traffic Analyzer
Installation Type Components Installed
Supervisor • Administrator
• Reports
• ACD Monitor with Chat • Search
• Traffic Analyzer
• WallSign Administrator (if selected for installation) • Voice Administrator (if selected for installation)
Installation Type Components Installed Enterprise
Supervisor • • Administrator Reports
• ACD Monitor with Chat • Enterprise ACD Monitor • Search
• Traffic Analyzer
• WallSign Administrator (if selected for installation) • Voice Administrator (if selected for installation)
Installation Type Components Installed
Agent • Agent Desktop with Chat
TASKE Information Server
The TASKE Information Server is an application for server installations only. Installed on the TASKE Server PC, this application ensures that the data supplied by the telephone system is collected, stored and properly dispersed to the real-time applications of the TASKE ACD ToolBox.
Users of the TASKE Server PC use the Information Server interface for a number of applications. These include:
Viewing the client connections to the TASKE Information Server
Viewing site connections to the Information Server for Enterprise enabled sites (local and enterprise connections)
Monitoring the flow of the data stream
Viewing and changing the data port settings for the data stream Viewing the individual connections to the Chat server
Viewing the TASKE Server IP information and status
Viewing the particulars of the TASKE Software license for the site and the number of clients currently using the TASKE suite of Tools
Integrating the Blue Pumpkin PrimeTime workforce management software with TASKE Call Center Management Tools
Starting the Information Server
Use the following steps to start the Information Server application on the TASKE server PC.
1. Click the Start button on the Windows task bar.
2. Select Programs from the Start menu.
3. Select the TASKE 8.0 program group from the Programs menu.
4. Select Information Server from the TASKE 8.0 program group to open the Information Server.
Right-click on this icon to open a menu that allows the user to perform the following activities:
• open the Information Server window when it is closed,
• open the TASKE Data Alarms dialog box,
• display information about the TASKE Information Server application, including the Lock Number for the site,
• and exit the Information Server application.
Exiting the Information Server application completely shuts down the application and stops all data collection. Do not perform this action unless it is absolutely necessary.
Viewing Client Connections
The Clients tab of the Information Server allows a user to view the current number of client applications connected to the Information Server. Any client applications that require real-time information (such as the TASKE ACD Monitor) are displayed in the list at the top of the Clients tab. The list displays the client's IP address and the name of the application the client is using, and the site name.
Status
The Status section of the Clients tab displays the connection status of the selected client to the Information Server. The status is either Connected or Blocked.
When a client is connected and receiving data, the Status section indicates a Connected state and displays a green light with the date and time of the connection.
When the client connection to the Information Server is lost, the status section indicates a Blocked state and displays a yellow light to indicate there is a problem with the connection. The client application automatically attempts to reconnect at 15-second intervals as long as the client application is running.
Disconnect
To permanently disconnect a client from the Information Server, the user of the TASKE server must first lock the site to new connections from the Sites tab (see Locking Sites and Disconnecting Clients in the TASKE Enterprise section). This prevents the client application from reconnecting after 15 seconds. Once the site is locked, return to the clients tab, select the client to disconnect from the list of client connections, and click the Disconnect button.
Details
The Details section of the Clients tab displays the network name and the IP address of the client selected in the connection list. Select any client in the list to view the details for that PC.
Messages
The Messages section of the Clients tab displays information about the PBX messages sent to the Client from the Information Server. The Last sent section displays the date and time of the last message received by the Client from the Information Server. The Last queued section displays the date and time of the last message the Information Server attempted to send.
If the client becomes Blocked, the Last sent and Last queued times may differ. The Last sent field will display the date and time of the last successful message. The Last queued field will display the date and time of the last message sent to the queue. Because the client connection is blocked, the messages will
Viewing the SMDR Connection
The SMDR tab of the TASKE Information Server allows a user to view the SMDR connection to the TASKE Information Server. If the SMDR connection is active, and properly connected, SMDR records can be seen scrolling through the SMDR Events screen in the SMDR tab. The SMDR data cannot be manipulated from the Information Server - and should not be interpreted from the screen. The records are simply
displayed to allow a user to confirm that the SMDR data is being collected.
Up to 150 records are displayed in the SMDR tab at a time.
SMDR Events
The SMDR Events section of the SMDR tab displays the data being received from the SMDR connection and collected by the TASKE Collector for use with the ACD ToolBox applications. Scroll bars are present on the right-hand side and across the bottom of the SMDR Events window to allow a user to scroll through the SMDR records.
Communications
The port settings may be changed by clicking the Change... button.
Communications Settings
The Communications Settings dialog box appears when the Change... button is pressed in the Communications section of the SMDR tab. Any settings changed from here affect the port settings of the SMDR port. The settings will be used by the Information Server to attempt to receive data as soon as the OK button is clicked.
The data port settings should only be changed if they are incorrect. If they are changed while the data is being received, the data connection may cease to function properly.
Viewing Chat Connections
The Chat tab of the TASKE Information Server allows a user to view the current number of agents and supervisors currently logged into the TASKE Chat Server through the ACD Monitor and the Agent Desktop applications.
Chat Members
Viewing License Information
The TASKE License section of the License tab displays the TASKE software licensing information that is stored in the file "TaskeLck.lis" in the TASKE install directory.
The TASKE License section of the License tab displays the following information:
Customer: the customer name of the site.
Lock Number: the Serial Number (or Lock Number) which is required for to receive TASKE Technical Support or for ordering upgrades of software from TASKE.
Primary agent IDs: the maximum number of agents allowed to connect to the
Information Server at any one time.
Secondary IDs per agent: the maximum number of secondary agent IDs allowed
on a per agent basis.
Enterprise supervisors: the maximum number of Enterprise Supervisors allowed to
connect at any time, and the number of Enterprise Supervisors currently active and connected to the Information Server.
Supervisors: the maximum number of Supervisors allowed to connect at any time,
and the number of Supervisors currently active and connected to the Information Server.
Voice channels: the number of voice ports the site is enabled to use and the number actually being used.
The licensing information can be updated by clicking the Update... button on the License tab. This is only necessary when a site upgrades and requires a change to its licensing configuration. The new license file must be provided by TASKE. The site can receive the file on diskette or via email.
Viewing General Information
The General tab of the TASKE Information Server allows a user to view TASKE Server IP information. The Server information cannot be manipulated from this tab; the
information is available for reference only.
TASKE Server Information
The TASKE Server Information section of the General tab displays the following information.
IP address: the IP address of the TASKE Server PC.
Info server port: the port number the TASKE server uses to receive client connections.
Chat server port: the port number the TASKE server uses to receive chat connections.
Running since: the date and time the TASKE Information Server was
launched.
Integrating PrimeTime with TASKE
For instruction and information on integrating PrimeTime with TASKE, refer to the PrimeTime Integration and Configuration Guide for TASKE Call Center Management Tools.
Setting the Real-time Adherence Schedule File Location
TASKE ACD ToolBox applications, such as the ACD Monitor, use the information in the PrimeTime schedules to determine if agents are adhering to the schedules. If an agent is not adhering to the schedule, the ACD Monitor will raise an alarm if it is setup to do so. The practice of tracking agents in this manner is known as Real-time Adherence. This means that the ACD Monitor tracks agent activity in real-time and compares this activity with what is expected in the schedule. If the agent is conducting activities outside of the schedule, supervisors are immediately aware of this deviance from the schedule.
For the Information Server to provide applications such as the ACD Monitor scheduling information, it must know where to locate the schedules. The Set RTAA Schedule File Location... option on the Configure menu opens the Set Schedule File Location dialog box. This dialog box sets the location of the root folder for the PrimeTime schedules.
To locate the root folder for the PrimeTime Schedules, input the path to the folder in the Schedule File Location field. If this information is not readily available, click the Browse button to search the local PC or the network. When the appropriate path to the
Showing Data Alarms
Data alarms are raised when the Collector does not receive records from the PBX within a defined time period and when the disk storage capacity falls below a
user-defined threshold. Alarms are user-defined using the TASKE Administrator application on the server PC, but are displayed through the Information Server.
The Information Server displays all data alarms that occur in the TASKE Data Alarms dialog box. By default, the Information Server automatically displays the TASKE Data Alarms dialog box and rings a bell every time an alarm is raised. To disable the dialog box from automatically opening and the alarm bell from ringing, disable the Display this window and Ring the alarm bell check boxes in the Each time an alarm is raised:
section of the TASKE Data Alarms dialog box. To manually open the TASKE Data Alarms dialog box and view the data alarms, select Show data alarms... from the File
menu.
Closing Versus Exiting the Information Server
Closing the Information Server window means that the application window is closed, but the application is still running in the background and collecting PBX data. Exiting the Information Server means that the application is completely shut down and all data collection stops. The Information Server should run continuously unless it is absolutely necessary to exit the application.
Closing the Information Server
To close the Information Server window, select Close from the File menu or click the X in the top, right corner of the TASKE Information Server title bar.
The Information Server window closes, but the application continues to run and collect data in the background. When the Information Server is running, an icon is present in the Windows System Tray, as in the image below.
The icon on the left represents the Information Server icon when no data alarms have occurred. The icon on the right represents the Information Server icon when the application has encountered data alarms. The red flag indicates the presence of data alarms.
To re-open the Information Server window, double-click the Information Server icon in the Windows System Tray, or right-click on the icon and select Open from the menu.
Exiting the Information Server
To completely shut down the Information Server and stop data collection, right-click on the Information Server icon in the Windows System Tray, and select Exit
TASKE Enterprise
TASKE Enterprise is a feature of the TASKE ACD ToolBox that allows the Information Server applications on TASKE Server PCs to share information across LAN (local area network) or WAN (wide area network) connections. The Enterprise feature is activated through licensing. If the site is licensed for one or more Enterprise Supervisors, the Enterprise feature is automatically activated during installation or with a license upgrade.
The Information Server applications at Enterprise enabled sites communicate using TCP/IP. Site information is shared between the sites when Enterprise Supervisors initiate information requests from a remote site. Two TASKE applications provide statistical information over the Enterprise connection. These applications are the Enterprise ACD Monitor and Reports.
Enterprise ACD Monitor functions the same as the ACD Monitor with the exception of ACD Replay. None of the ACD Replay functionality is available with the Enterprise ACD Monitor. Real-time and recent historical (last hour, last 12 hours) agent and queue statistics are available using the same methods as in the local ACD Monitor. Sites are identified using the site names or local for the local site.
The Reports application generates reports for remote sites by retrieving data from a shared PBX directory on the TASKE Server PC at the remote site. When a request for a report on a remote site occurs, the Reports applications launches a Net Client that connects to the local Information Server. The local Information Server then forwards the request to the Information Server at the remote site. If the remote Information Server finds newer data than is available on the local Information Server, copies of the appropriate .pbx files are transferred to the local Information Server and the report is generated from these files.
When an Enterprise Supervisor requests information from a remote site, the following sequence of events occurs.
1. A client application (ACD Monitor) launches on a client PC. 2. The client application opens a new client connection (Net Client).
When a Net Client connection is open on a client PC, the icon for the Net Client is visible in the Windows System Tray. Only one Net Client connection starts for every client PC. Double-clicking the Net Client icon in the System Tray opens the Net Client Window. Here, a tab is present for every client application that is currently using the Net Client connection.
3. The Net Client sends a request for data through the network to the local
4. The local Information Server communicates the request for data to the
Information Server at the remote site.
5. The Information Server at the remote site routes a copy of the data received from its TASKE Collector to the local Information Server. The TASKE Collector
receives call center data directly from the PBX.
6. The local Information Server routes a copy of the data through the network to the
Net Client, where it is transferred to the client application.
Checking for Enterprise Licensing
There are two methods for determining if the Enterprise functionality is activated in a TASKE Server. Both methods require the Information Server to be started.
The quickest and most obvious method for checking if Enterprise is activated is the presence of the Sites tab in the Information Server interface. If this tab is present, the site is licensed for Enterprise and the Enterprise functionality is active.
The second place to check for Enterprise licensing is the License tab of the Information Server. If an entry for Enterprise Supervisors is displayed in the License tab, the TASKE Information Server is licensed for Enterprise and the Enterprise functionality is active. The Enterprise Supervisors entry in the License tab shows the maximum number of Enterprise Supervisors allowed to connect at one time and the number of Enterprise Supervisors currently connected. Use the following steps to view the License tab and check for Enterprise licensing.
1. From the TASKE ToolBox, open the Information Server.
2. Click the License tab to view the TASKE licensing information for the local
TASKE site.
Viewing Enterprise Site Connections
The Sites tab is only present in the Information Server interface if the license file allows licensing for Enterprise Supervisors. This type of licensing allows the Information Server to collect, store, and disperse PBX data from TASKE Server PCs that are located at remote sites. The Sites tab provides an interface for the setup and maintenance of the remote site connections. The list at the top of the Sites tab displays all of the defined sites, regardless of the connection status. The local site is included in the list of Active sites.
Status
The Status section of the Sites tab displays the status of the connection from the site to the Information Server. If the site is connected and receiving data, a green light is present with the title "Local site activated" for the local TASKE site and "Connected to Remote Site" for other TASKE sites. The date and time the connection commenced are also displayed. If a site is Activated the Information Server can send and receive information requests to and from the site.
Details
The Details section of the Sites tab displays the following information.
PBX Type: displays the PBX type of the site selected in the sites list.
Data Path: displays the local path for the data being stored from the local or remote site.
Clients: displays the number of clients connected to the Information Server of the site selected in the sites list. This field also shows the lock status. If a site is locked, no new clients can connect to the site through the Information Server at the site. This feature is used for site maintenance.
Last Message
The Last Message section of the Sites tab displays information about the
messages sent to the local Information Server from the site selected in the sites list. This section displays the following information.
Time: displays the date and time of the last message received by the local Information Server from the site selected in the sites list.
Type: displays the type of data record that was last received by the local Information Server from the site selected in the sites list.
Adding, Modifying, and Removing Enterprise Site Connections
Enterprise site connections to the local Information Server are setup, modified, and removed using the Sites tab of the Information Server. All of these actions are accomplished through the options available in the Site actions... drop-down menu.
Adding an Enterprise Site Connection
Use the following steps to add an Enterprise site connection to the local
Information Server. Once added, the site is added to the sites list on the Sites tab of the Information Server interface.
1. Select the Sites tab in the Information Server interface.
2. Click the Site actions... button on the Sites tab to open the drop-down
menu.
3. Select Add... from the menu to open the Add Site dialog box.
4. Enter a unique name for the site in the Site name field.
When an Enterprise site is added, a directory for storing the site data is created on the local TASKE Server PC. This directory is automatically assigned the same name as the site. When modifying the site connection information, the site name is not editable because of the inconsistency it would create in the directory structure. Local client applications connected to the Information Server also refer to the remote site by this name. To change a site name the site must be removed and re-added to the list with a new name.
5. Enter the network name of the remote TASKE Server PC in the Server
name field.
Click the Browse... button to search the network (LAN or WAN) for the remote TASKE Server PC. When the remote PC is found by browsing the network, the IP address of the PC is automatically entered in the IP
field. If this is not the case, click the Auto button to have the IP address automatically detected based on the server name provided.
7. Enter the IP port for incoming data from the remote TASKE Server PC in
the IP Port field.
By default, TASKE uses port number 5210 for incoming data from remote sites. Ensure that no other devices are using port number 5210.
8. Select the type of the remote PBX from the drop-down list of PBX types. Once the Enterprise site is added, the PBX type cannot be changed. If the PBX type must be changed, the Enterprise site must be removed and re-added.
9. Enable the Activate automatically on startup check box to have the site
automatically activated when the local Information Server is started. By default this check box is enabled. Disabling this check box means that the user will have to manually activate the site from the Sites tab of the Information Server.
10. Click OK to accept the settings for the Enterprise site and add the new site to the sites list of the Sites tab.
The new site is not activated automatically. The site must be manually activated to commence the collection of data and the processing of information requests.
When new sites are added, a change is made to the data directory structure of the local TASKE Server PC. Under the "SiteData" directory, a directory and data subdirectories are created for each remote site. This change allows collected .pbx files from the local and "remote" sites to be saved locally and used by the Enterprise Supervisors.
Modifying an Enterprise Site Connection
Use the following steps to modify the properties of an Enterprise site connection to the local Information Server.
1. Select the Sites tab in the Information Server interface.
2. Select the Enterprise site connection to modify from the sites list. 3. Click the Site actions... button on the Sites tab to open the drop-down
menu.
4. Select Edit properties... from the menu to open the Edit Site Properties
dialog box.
This dialog box is identical to the Add Site dialog box. The only exception is that the Site name and PBX type fields are not editable.
5. Make the required changes to the editable fields of the Edit Site Properties
dialog box. Refer Adding An Enterprise Site Connection for descriptions of the fields in this dialog box.
6. Click OK to accept the modifications to the properties of the Enterprise site
connection and close the Edit Site Properties dialog box.
Removing an Enterprise Site Connection
Use the following steps to remove an Enterprise site connection from the local Information Server.
1. Select the Sites tab in the Information Server interface.
2. Select the Enterprise site connection to modify from the sites list.
3. Click the Site actions... button on the Sites tab to open the drop-down
menu.
4. Select Remove from the menu to open the TASKE Information Server
5. Click Yes to remove the Enterprise site connection.
Removing the Enterprise site connection removes the site from the sites list in the Sites tab of the Information Server.
Activating and Deactivating Sites
Enterprise site connections are manually activated and deactivated using the Sites tab in the Information Server. If a site is activated the Information Server can send and receive information requests to and from the site. Deactivated sites cannot send information to or receive information from the Information Server.
Activating an Enterprise Site Connection
Use the following steps to activate an Enterprise site connection.
1. Select the Sites tab in the Information Server interface. 2. Select the Enterprise site to activate from the sites list.
3. Click the Site actions... button on the Sites tab to open the drop-down
menu.
4. Select Activate from the menu to activate the site. If the site is activated,
the Activate menu option will not be available. The Deactivate option will be present in place of the Activate option.
The Status section of the Sites tab displays the status of the connection. When the site is activated the light in the Status section is green with the title "Local site activated" for the local TASKE site and "Connected to Remote Site" for other TASKE sites. The date and time the connection commenced are also displayed. If a site is "Activated" the TASKE Information Server can send and receive information requests to and from the site.
Deactivating an Enterprise Site Connection
Use the following steps to deactivate an Enterprise site connection.
1. Select the Sites tab in the Information Server interface.
2. Select the Enterprise site to activate from the sites list.
3. Click the Site actions... button on the Sites tab to open the drop-down
menu.
4. Select Deactivate from the menu to deactivate the site. If the site is
The Status section of the Sites tab displays the status of the connection. When deactivated the light in the status section is gray with the title "Site is inactive". The date and time the connection commenced are also displayed.
Locking Sites and Disconnecting Clients
Sites can be locked and clients disconnected from the Sites tab of the Information Server. Maintenance at an Information Server is the main reason for locking a site and disconnecting the clients. Locking a site and manually disconnecting the clients
provides a polite method for disconnecting service to the clients. Otherwise, clients would be disconnected without warning and continually attempt to reconnect.
If maintenance is occurring at the local Information Server, all remote sites should be locked and all clients from all remote sites disconnected. If maintenance is occurring at a remote Information Server, the site connection at the local Information Server to that site should be locked and all clients disconnected from the site. Any client with access to the remote site through a different Information Server will still be able to connect. It is important to lock a site prior to disconnecting the clients. When clients are
disconnected without locking a site, the client applications will automatically reconnect. Locking the site prior to disconnecting the clients prevents the client applications from reconnecting to the site.
Locking an Enterprise Site
Use the following steps to lock an Enterprise site.
1. Select the Sites tab in the Information Server interface.
2. Select the Enterprise site to lock from the sites list.
3. Click the Site actions... button on the Sites tab to open the drop-down
menu.
4. Select Lock from the menu to lock the site. This action prevents new client connections, but does not affect existing client connections.
Disconnecting All Clients from an Enterprise Site
Use the following steps to disconnect all clients from an Enterprise site.
1. Select the Sites tab in the Information Server interface.
2. Select the Enterprise site from the sites list that all clients will be
disconnected from.
3. Click the Site actions... button on the Sites tab to open the drop-down
menu.
4. Select Disconnect all clients from the menu to disconnect the clients from
TASKE Network Client
The Network Client is a background application that acts as a liaison between client applications requiring real-time information and the Information Server. When a client application requiring real-time data launches, it sends a request to the Information Server through the Network Client application. The request asks the Information Server for permission to connect and receive data. When the Information Server accepts this request the client application has full access to the real-time data acquired from the PBX.
The Network Client application is almost invisible to the user. When the application is running, an icon is present in the Windows System Tray. To open the Network Client window, double-click the icon in the System Tray, or right-click the icon and select Open
from the menu.
Network Client System Tray Icon
Using the Network Client Interface
Status
The Status section of the Network Client displays the status of the connection between the client and the Information Server. If the client is connected and receiving data, a green light is present with the title: Connected to local site. The date and time indicate when the connection was established. The Server and Port information provides the IP address of the TASKE Server PC and the Port number the Server PC is using to receive client requests. If the client is
disconnected, the light turns yellow to indicate a connection problem and the title changes to: Blocked. The Network Client automatically attempts to reconnect.
Last Message
The Last Message section of the Network Client displays information about the PBX messages being sent to the client from the Information Server. The Time
section displays the date and time of the last message the client received from the Information Server. The Type section displays the type of data that was sent to the client, for instance, and SMDR record. If the client is Blocked the Last sent
TASKE Administrator
The TASKE Administrator application is responsible for the development of the TASKE database, its configuration and maintenance, and the configuration and maintenance of its associated files. To perform these functions, the Administrator operates in two
modes: Database and Configuration.
The TASKE database is comprised of names, numbers, and other
characteristics of a customer interaction center. These elements are defined in the Database Mode of the Administrator. The elements defined in the TASKE database mirror those elements defined in the PBX system.
Registering these parameters and mirroring the PBX database elements enables the TASKE system to generate reports for the elements of a telephone system used throughout a company. Use the Administrator to define and maintain the TASKE database. This is the only TASKE application where database elements are defined, modified, and deleted.
The Configuration Mode provides maintenance flags and configuration tools for the database. The interface for this mode is divided into three sections: Logs, Maintenance, and Alarms. For security purposes, the TASKE Servers are the only PCs with access to all three sections. On Supervisor PCs only the Logs section is provided in the Configuration Mode of the Administrator.
Maintenance tools include a system log, alarm parameters set to user specifications that warn of maintenance needs, and the generation of statistics files. The configuration tools include an interface for configuring disk storage settings, error log tracking and ensuring the security of stored records by setting alarms to notify of any abnormalities. The application may be used routinely for activities such as reading maintenance logs, archiving, deleting and synchronizing shadow files, as well as performing disk statistics.
Starting the Administrator
The Administrator application is opened from the Windows desktop. Use one of the following methods to open the application.
Opening the Administrator Using the Start Button
Opening the Administrator from the TASKE Program Folder
Use the following steps to open the Administrator application from the TASKE 8.0 program folder.
1. Double-click the TASKE 8.0 folder icon on the Windows desktop to open
the TASKE 8.0 folder.
2. Double-click the Administrator icon in the folder to open the Administrator
application.
Using the Menu Bar
The menu bar contains three menus that provide keyboard or mouse access to the functions of the Administrator. The menus are File, View, and Help.
File Menu
The contents of the File menu vary depending on the Mode. The table below outlines the menu options for both the Database mode and the Configuration mode.
Database Mode
Option Shortcut Description
Export N/A Select this option to open the Export Database dialog box. Use this dialog box to select the location and file type of the exported database, as well as the types of database elements to include in the export. Exit N/A Select this option to close the Administrator
Configuration Mode
Option Shortcut Description
Open N/A This option is only available in the Logs section of the Configuration mode. Select Open to open a saved TASKE log file. Only files with a .log extension can be opened.
Save As... N/A Select this option to save the log file currently displayed in the Logs section of the Configuration mode.
Save N/A This option is only available in the Alarms section of the Configuration mode. Select Save to save
changes to the alarm parameters.
Clear Log... N/A This option is only available in the Logs section of the Configuration mode. Select Clear Log... to clear the events from the log file. Prior to deleting the events, the user is prompted to save the log file. To retain the events, the log file must be saved prior to clearing the events.
Refresh N/A This option is only available in the Logs section of the Configuration mode. Select Refresh to
immediately update the log with the most recent events.
Exit N/A Select this option to close the Administrator application.
View Menu
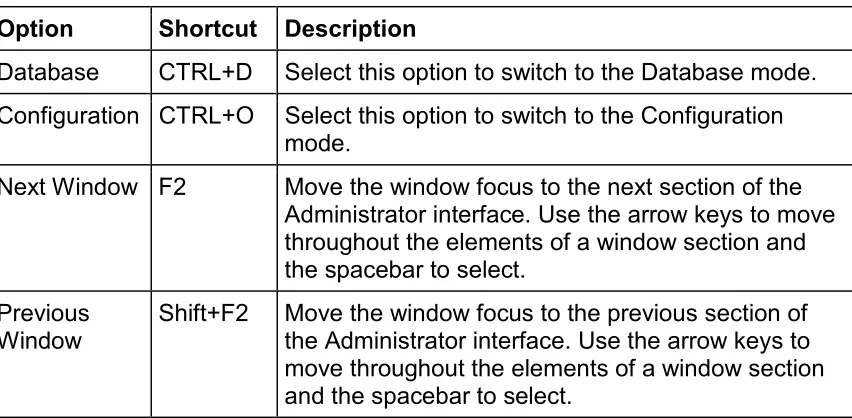
The View menu provides keyboard or mouse access to various sections of the Administrator interface. The table below outlines the functionality of the View menu options.
Option Shortcut Description
Database CTRL+D Select this option to switch to the Database mode. Configuration CTRL+O Select this option to switch to the Configuration
mode.
Next Window F2 Move the window focus to the next section of the Administrator interface. Use the arrow keys to move throughout the elements of a window section and the spacebar to select.
Previous
Window Shift+F2 Move the window focus to the previous section of the Administrator interface. Use the arrow keys to move throughout the elements of a window section and the spacebar to select.
Help Menu
Use the Help menu to access the online help for the Administrator. Additionally, use this menu to view version and copyright information for the application.
Option Shortcut Description
Contents F1 Select Contents to access the Online Help for the Administrator application.
About
TASKE ACD Monitor...
N/A Select About TASKE Administrator... to view version, copyright, and lock number information for the
Administrator.
Using the Main Control Panel
The Main Control Panel is located on the left side of the Administrator window. This section of the window is responsible for:
Mode Selection
The two buttons located at the top of the Main Control Panel are the mode
selection buttons. These buttons toggle between the Database and Configuration modes.
Table Selection in Database Mode
In the Database Mode, the Main Control Panel displays a list of buttons. Each button provides access to a table for the database element described on the button. The tables are provided in the display area of the Administrator window. Use these tables to add, modify, and delete the database elements.
The available tables of database elements are Trunks, Trunk Groups, Extensions, Extension Groups, Agents, Agent Groups, Queues, Queue Groups, Qualifier Codes, and DNIS codes. Use the Spectrum and Options tables to configure the database options.
Tool Selection in Configuration Mode
In the Configuration Mode, the contents of the Main Control Panel depends on the installation type of the TASKE software. For Server installations, the Main Control Panel in the Configuration Mode displays three buttons: Logs, Maintenance, and Alarms. For Supervisor installations, the Main Control Panel in the
Selecting a Mode
The Administrator application operates in two modes: Database and Configuration. Use these modes to build the TASKE database and to maintain and configure its associated files.
The two buttons located at the top of the Main Control Panel toggle between the Database and the Configuration modes.
Database Mode Configuration Mode
The Database Mode is used to construct the TASKE database. The TASKE database is comprised of names, numbers, and other characteristics of a customer interaction center. The elements defined in the TASKE database mirror those elements defined in the PBX system. Registering these parameters and mirroring the PBX database
elements enables the TASKE system to generate reports for the elements of a telephone system used throughout a company. Use the Administrator to define and maintain the TASKE database. This is the only TASKE application where database elements are defined, modified, and deleted.
The Configuration Mode provides maintenance flags and configuration tools for the database. The interface for this mode is divided into three sections: Logs, Maintenance, and Alarms. For security purposes, the TASKE Servers are the only PCs with access to all three sections. On Supervisor PCs only the Logs section is provided in the
Configuration Mode of the Administrator.
Using the Database Mode
The Database Mode allows the design, construction and editing of the TASKE
database. This Includes configuring the number of Trunks, Extensions, Agents, Queues and Qualifiers in use on a telephone system and establishing groups of these elements for reporting purposes.
Using the Database Mode Interface
To use the Database Mode, click the Database button on the Main Control Panel. In Database Mode the Main Control Panel provides buttons to access the editable tables for the database elements. To select a table for viewing, click the button for the desired table. The available tables of database elements are Trunks, Trunk Groups, Extensions, Extension Groups, Agents, Agent Groups, Queues, Queue Groups, Qualifier Codes, and DNIS codes. Use the Spectrum and Options tables to configure the database options. The selected table appears in the display area that is located to the right of the Main Control Panel. This area is comprised of two sections for all tables with the exception of the Spectrum table and the Options table. These sections are the List Panel and the Details panel. Both the Spectrum table and the Options table are comprised of a single section.
List panel
The List panel is the top section of the display area. The panel contains a list of all defined database elements for the selected table. Each entry in the list provides the ID Number, Name and Nick Name of the element. To select a database element from the List panel, click on the entry for the element. When selected, the List panel entry is highlighted in blue.
Details panel
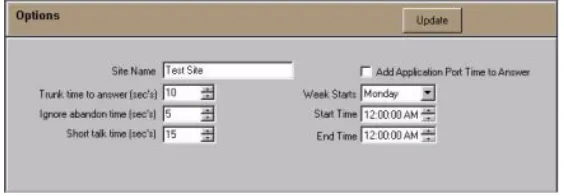
Exporting the TASKE Database
Use the following steps to export the TASKE database. Each database element selected for export is saved in a separate file in the file type and location
selected.
1. From the Database mode, select Export from the File menu to open the
Export Database dialog box.
2. Input the path to the exported database files in the Export Path field. The default location for the files is the root of the TASKE directory.
If desired, click the button to access the network and select another file location.
3. Select a file type for the exported files from the Export As list. The file
formats available for export include: Ascii
Clarion
Comma Separated Variable
dBase II dBase III dBase IV HTML Table Lotus 123 1A Lotus 123 2.0 Lotus 123 3.0 Lotus 123 4.0
Microsoft Excel 2.1 Microsoft Excel 3.0
Microsoft Excel 4.0 or greater Print Image
Quattro Quattro Pro
Quattro Pro 5.0 for Windows Symphony 1.0
Symphony 1.1
4. Enable the check boxes of the database elements to export in the Export
section of the dialog box.
5. Disable the check boxes of the database elements not required for export in the Export section of the dialog box.
6. Click Export to export the selected database elements and close the
dialog box.
Defining Trunks
Click the Trunks button on the Main Control Panel in Database Mode to display the Trunks table.
The List panel displays a list of all Trunks defined in the database. If the list is too long to display all defined Trunks, scroll bars are provided for navigation
throughout the list. The list contains an ID Number, Name and Nick Name for each Trunk.
ID Number Column - displays unique ID Numbers for each Trunk defined in
the TASKE Database. The ID Number is the key parameter by which the TASKE Database indexes and tracks Trunk elements.
Name Column - displays the names for each Trunk defined in the TASKE
Database. The Name is a character string which represents the Trunk's full name for reference purposes and may appear in Trunk reports.
Nick Name Column - displays nicknames for each Trunk defined in the
TASKE Database. The Nick Name is simply an alternate way of naming Trunk records and may be used in reports.
In the Details panel Trunks may be added, deleted or modified by using the New, Update and Delete buttons.
Adding Trunk Entries
Use the following steps to add a trunk entry to the database.
1. In the Trunk Record Details panel, click the New button.
2. In the Trunk Record Detail panel, enter the ID, Name, and Nick Name of
the new Trunk Record.
3. Click the Update button.
The Trunk ID in the TASKE database must be identical to the Trunk ID in the PBX system.
Duplicating a Trunk Entry
Use the following steps to duplicate a Trunk entry. This is useful when creating a new Trunk entry that is similar to another Trunk.
1. Choose the Trunk entry to be duplicated from the List panel.
2. In the Trunk Record Detail panel, change the ID (this is the only
information that must be changed). Ensure that the new ID does not conflict with any existing trunks.
3. In the Trunk Record Details panel, click the Update button.
Modifying Trunk Entries
Use the following steps to modify a Trunk entry.
1. Choose the Trunk entry to be modified from the List panel. 2. In the Trunk Record Detail panel, modify the Trunk Record.
3. In the Trunk Record Details panel, click the Update button.
Deleting Trunk Entries
Use the following steps to delete a Trunk entry.
1. Choose the Trunk entry to be deleted from the List panel. 2. In the Trunk Record Details panel, click the Delete button.
Defining Trunk Groups
Click the Trunk Groups button on the Main Control Panel in Database Mode to display the Trunk Groups table.
The List panel displays a list of all Trunk Groups defined in the database. If the list is too long to display all defined Trunk Groups, scroll bars are provided for navigation throughout the list. The list contains an ID Number, Name and Nick Name for each Trunk Group.
ID Number Column - displays unique ID Numbers for each Trunk Group
defined in the TASKE Database. The ID Number is the key parameter by which the TASKE Database indexes and tracks Trunk Group elements. To implement Call Costing in the customer interaction center, it is absolutely necessary to define the lowest Trunk Group Numbers, such as 1000, 1001, 1002, and 1003 in the TASKE Database as Call Costing Trunk Groups, and reserve the higher Trunk Group numbers, such as 1010, for reporting
purposes. This is because Call Costing searches for costing information on Trunk Groups with the lowest Trunk Group numbers.
Name Column - displays the names for each Trunk Group defined in the
TASKE Database. The Name is a character string that represents the Trunk Group's full name and is for reference purposes and may appear in Trunk Group reports.
Nick Name Column - displays nicknames for each Trunk Group defined in
Use the Details panel to add, delete or modify Trunk Groups by using the New, Update and Delete buttons.
The Trunk Members section of the Details panel lists all Trunks that are
members of the selected Trunk Group. To examine one of these Trunks, select the desired Trunk from the Trunk Members section and click the Go To button. This action displays the Trunks table with the details of the selected Trunk.
Adding Trunk Group Entries
Use the following steps to add a Trunk Group entry to the database.
1. In the Trunk Group Record Details panel, click the New button.
2. In the Trunk Group Record Detail panel, enter the ID, Name, and Nick Name of the new Trunk Group Record.
3. Select the Trunks that belong to the new Trunk Group from the Trunk
Members list.
4. Click the Update button.
Duplicating a Trunk Group Entry
Use the following steps to duplicate a Trunk Group entry. This is useful when creating a new Trunk Group entry that is similar to another Trunk Group.
1. Choose the Trunk Group entry to be duplicated from the List panel.
2. In the Trunk Group Record Detail panel, change the ID (this is the only
information that must be changed). Ensure that the new ID does not conflict with any existing trunk groups.
3. In the Trunk Group Record Details panel, click the Update button.
Modifying Trunk Group Entries
Use the following steps to modify a Trunk Group entry.
1. Choose the Trunk Group entry to be modified from the List panel.
2. In the Trunk Group Record Detail panel, modify the Trunk Group Record.
Deleting Trunk Group Entries
Use the following steps to delete a Trunk Group entry.
1. Choose the Trunk Group entry to be deleted from the List panel. 2. In the Trunk Group Record Details panel, click the Delete button.
Defining Extensions
Click the Extensions button on the Main Control Panel in Database Mode to display the Extensions table.
The List panel displays a list of all Extensions defined in the database. If the list is too long to display all defined Extensions, scroll bars are provided for
navigation throughout the list. The list contains an ID Number, Name and Nick Name for each Extension.
ID Number Column - displays unique ID Numbers for each Extension
defined in the TASKE Database. The ID Number is the key parameter by which the TASKE Database indexes and tracks Extension elements.
Name Column - displays the names for each Extension defined in the
TASKE Database. The Name is a character string which represents the Extension's full name and is for reference purposes and may appear in Extension reports.
Nick Name Column - displays nicknames for each Extension defined in the
TASKE Database. The Nick Name is simply an alternate way of naming Extension records and may be used in reports.
Adding Extension Entries
Use the following steps to add an Extension entry to the database.
1. In the Extension Record Details panel, click the New button.
2. In the Extension Record Detail panel, enter the ID, Name, Nick Name, and
Port number of the new Extension Record.
3. Click the Update button.
For data collection to occur, the Extension ID in the TASKE database must be identical to the Extension ID in the PBX system.
Duplicating an Extension Entry
Use the following steps to duplicate an Extension entry. This is useful when creating a new Extension entry that is similar to another Extension.
1. Choose the Extension entry to be duplicated from the List panel.
2. In the Extension Record Detail panel, change the ID (this is the only
information that must be changed). Ensure that the new ID does not conflict with any existing extensions.
3. In the Extension Record Details panel, click the Update button.
Modifying Extension Entries
Use the following steps to modify an Extension entry.
1. Choose the Extension entry to be modified from the List panel. 2. In the Extension Record Detail panel, modify the Extension Record.
3. In the Extension Record Details panel, click the Update button.
Deleting Extension Entries
Use the following steps to delete an Extension entry.
1. Choose the Extension entry to be deleted from the List panel. 2. In the Extension Record Details panel, click the Delete button.
Defining Extension Groups
Click the Extension Groups button on the Main Control Panel in Database Mode to display the Extension Groups table.
The List panel displays a list of all Extension Groups defined in the database. If the list is too long to display all defined Extension Groups, scroll bars are
provided for navigation throughout the list. The list contains an ID Number, Name and Nick Name for each Extension Group.
ID Number Column - displays unique ID Numbers for each Extension Group
defined in the TASKE Database. The ID Number is the key parameter by which the TASKE Database indexes and tracks Extension Group elements.
Name Column - displays the names for each Extension Group defined in the
TASKE Database. The Name is a character string that represents the
Extension Group's full name and is for reference purposes and may appear in Extension Group reports.
Nick Name Column - displays nicknames for each Extension Group defined
in the TASKE Database. The Nick Name is simply an alternate way of naming Extension Group records and may be used in reports.
Use the Details panel to add, delete or modify Extension Groups by using the New, Update and Delete buttons.