Daylight Performance through Different Types of Glazing in the Tropics
Christopher Y.S. Heng 1, D. R. Ossen 2 and Y. W. Lim 3
1 Department of Architecture, Faculty of Built Environment, Universiti Teknologi Malaysia, Skudai, Johor, Malaysia,
Email : [email protected]
2 Department of Architecture, Faculty of Built Environment, Universiti Teknologi Malaysia, Skudai, Johor, Malaysia,
Email : [email protected]
3 Department of Architecture, Faculty of Built Environment, Universiti Teknologi Malaysia, Skudai, Johor, Malaysia,
Email : [email protected]
Having glazing on buildings will allow natural daylighting in a room. There are four types of glazing which are commonly used in the market today: Clear, light green, bronze and black float glass where tinted glazing will provide shading to the interior. These four glass are being tested using Integrated Environmental Solutions Virtual Environment (IESVE) software with different proportion to investigate the influence of arrangements of glazing to permit daylight and to serve as shading device. There are 40 combinations of different glazing proportion tested in the simulation. The combination of 75 % clear float glass on a green float glass base gives the highest lux value at a point 90cm from the opening whereas the lowest value is exhibited through a 25% green float glass with a black float glass base of 75%. The finding shows that glazing with lower Visual Light Transmittance as the base will give a lower Daylight Factor compared to using it on top of the other glazing. Furthermore, although there is a large contrast of Daylight Factor between the 0.9m and 3.6m depth, several combination of glazing achieved the requirement of Malaysian Standard 1525 for daylighting in office.
Keywords: Daylight performance, Glazing, Tropics, Computer simulation
Introduction
Having daylight in an office can bring benefits to its users such as cutting down
energy usage, providing good sight, colour rendering and increase of work
productivity (Li et al., 2010, Mayhoub et al., 2011, Rosemann et al., 2008). However,
permitting too much of daylight in a room will bring problems such as glare and
visual comfort and heating will require more energy to be consumed by cooling the
space.
Therefore, to prevent these setbacks while acquiring daylight, shading devices
have been used create different level of illuminance. External shading devices such
as blinds, louvers, overhangs and fins require some space and cost to be built. Thus,
architects and developers will opt to use tinted glazing that only require alteration in
the existing windows (Shen et al., 2013). Tinted glazing will reduce the amount of
daylight permitted into the room through its visible light transmittance level. However,
when a whole piece of tinted glazing is installed to prevent glare and heating, the
whole room will be too dark for the occupants.
In this study, an experimental configuration of the tinted glazing has been carried
out to provide shading and daylight in the interior. The studies will be carried out on a
computer software simulation Radiance which is integrated into Integrated
Environment Solution: Virtual Environment (IESVE). This will provide information to
evaluate the performance of the different glazing combination on daylight illuminance
level.
Literature Review
When designing a tinted glazing, there are different areas of specification that
need to be taken into consideration such as visual light transmittance, U-value and
essentially, the climate. Tropical, dry, mild mid-latitude, cold mid-latitude and polar are
five main types of climate in the world according to Köppen climate classification
(Chen et al., 2013, Tang et al., 2012). The climate have an effect on the glazing due to
their differences in temperature, humidity, wind and precipitation in a year. Hence, the
glazing required for each building will need to have certain qualities to suit to the
environment. For instance, cold climate countries such as Australia, harvesting solar
heat gain (high Solar Heat Gain Coefficient (SHGC)) and reducing heat flow (low
U-value) on both direction of the glazing are a necessitate (Fang et al., 2010). The
retarding heat flow from both sides is important in both winter and summer time as to
keep the heat inside and preventing the heat outdoors to penetrate in the building.
Examples of glazing for this climate are Low-E glass and insulated glass units.
Besides that, double glazing is mainly used in the tropical, sub-tropics and arid
climate. This is due to the U-value of approximately 2.53 that serves twice as good
when comparing to a regular glass pane of 4mm glass which has a U-value of 5.88
(Bell et al., 2008). It functions to keep the heat out from the interior and keeping the air
temperature cool on the inside. The radiant energy from the sun can reach up to
The preferable glazing properties are those which has low U-value and SHGC.
The effect of a whole piece of glazing has been studied by a few researchers in
different aspects. Galasiu (2006) researched on the preference and satisfaction of
users in a daylit office. While there is a preference of having daylight in workspaces,
users preferred larger window sizes in general. It also shows that manual shading
devices are rarely adjusted after setting them up which defeat the purpose of the
devices. Arsenault (2012) studied the effects of three glazing colour types which are
blue, neutral and bronze on the switch on patterns, quality daylight and arousal for
electrical lighting using a 1:4 scale model with 36 sample size. The result shows that
the arousal level of office workers will be affected significantly by the glazing colour
and they preferred bronze glazing which is warmer shift, thus, proving the importance
of colour glazing.
Around the same time, a comparative study of glazing areas and the integration
of louvers and blinds was done by Bülow-Hübe (2008). There are two types of glazing
that were used in this research and constituted to 30, 60 and 100 percent of the
façade area: triple clear and double clear solar control glazing. The simulation showed
that larger windows do not guarantee a well-lit space in the interior and glare will occur
on vertical self-luminous surfaces. The 100% glazed office does not show significant
more lighting on work plane level than a 60% glazed. Hence, it shows that higher
glazing tint is able to provide similar illuminance level as lower glazing tint. This will
enable the option to combine various type of the glazing tint.
Besides that, Hu (2014) used Radiance simulation model to test on four design
parameters which are the window dimensions and position, transmittance of glazing
and reflectance of blind. The outcome shows that the percentage error is less than 5%
between the predicted results and the simulation. Hence, both the software are suitable to run on daylight and thermal systems’ studies.
Based on the literature review, extensive studies have been done on glazing and
daylighting thus providing a basis for this research. Previous research also showed
that simulation software is suitable to perform experiment to assess daylight
performance.
Experiment Design and Methodology
Table 1 shows the properties of the four glass used in this research. All the
glasses are common selections among the construction industries. Hence, it provides
a picture of a real condition happening in a building in the tropics. Clear Float Glass
(CFG) provides a visible light transmission (VLT) of 88% which is the highest among
percentage of VLT will greatly affect the amount of daylight entering the interior of the room. Hence, a large range of glass’ VLT are chosen.
Table 1: Properties of glazing
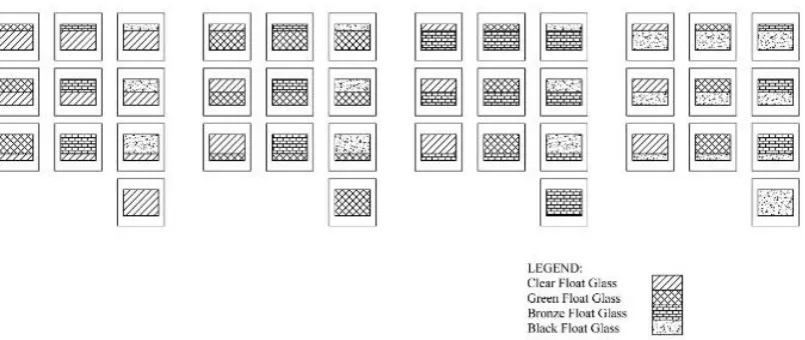
The four glass type are being integrated together based on the proportion of the height of the room’s window: 100%, 75%, 50% and 25%. For example, for the CFG,
there are 10 combinations where the glass proportion is reduced and the remaining
top portion is combined with other type of glass. There are altogether 40 combinations
which include 4 full height of each type of glass as base cases which is shown in
Figure 1. Thus, these arrangement will determine the optimum combination which
gives good daylight performance based on the illuminance ratio. The illumination ratio
is used due to the tropical climate which changes quickly from time to time.
Figure 1: Combination and proportion of type of glazing for simulation
The simulation is carried out using IESVE software. The software uses ray tracing
calculation engine which consider the distribution of emitted rays. The rays are a
combination of forward and backward rays and supports reflection, transmission and
refraction of surfaces. ASHRAE 90.1 is used in IESVE where the climate hourly data
file for solar energy, temperature and humidity are approved by rating authority. The
which is nearest to Johor Bahru (latitude 1.37o, longitude 103.98o, altitude 16m, and
time zone +8 GMT). The date of simulation is set to 8th April, 1200 hours to obtain
indirect sunlight and complying with the scaled model experiment. Based on the
simulation in IESVE, the outdoor illumination reached up to 18227.24 lux.
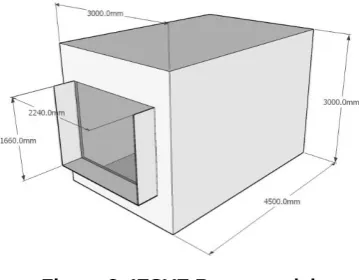
Using the software, a model of 4.5m x 3.0m x 3.0m with an opening of 2.25m x
1.65m (window-to-wall ratio (WWR) is 0.413), which represents an office room with a
window, is being constructed in ModelIt function as shown in Figure 2. The dimension
is based on a scaled physical model which is prepared for comparison.
Figure 2: IESVE Room model
Four points on the ground are selected in the room to collect the illumination level
which are 0.9m, 1.8m, 2.7m and 3.6m from the opening. In RadianceIES, the setting
are customised to 8 ambient bounces and 16 reflection limit. The walls and ceilings
have 0.7 reflection, 0.03 specularity and a roughness of 0.03. This simulation uses
standard CIE overcast sky and the illuminance value is taken from a working plane
height of 0.8m which is in accordance to the working table height.
Daylight Factor (DF) is used as a tool to assess the daylight performance for the
glazing. The equation for DF is the percentage of indoor and outdoor illuminance ratio.
Both the indoor and outdoor illuminance are taken in overcast sky condition which
demonstrate the worst case scenario of a daylighting situation in a room while
illuminance ratio is used to determine the ratio between percentage of internal Work
Plane Illuminance (WPI) level and external illuminance level.
Results and Analysis
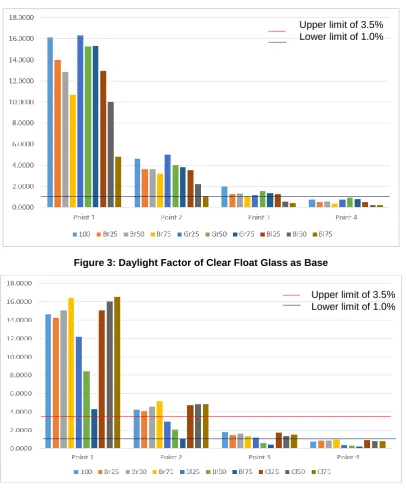
Figure 3 shows the DF of the glazing where CFG was placed as the base. From
the graphs, the highest ratio of 16.28% is shown by using 25% GFG on top of the 75%
CFG base. This is followed by a full 100% CFG with DF of 16.12% and 50% and 75%
GFG with the same ratio of 15.34%. 75% BLFG with 25% CFG showed the lowest
All the glazing combination at Point 1 are above DF of 3.5%. Most of them also
exceeds the 6% mark set in MS1525:2014 which is noted as intolerable in terms of
lighting condition. However, most of the glazing in Point 2 such as 75% BRFG, 50%
BLFG and 75% BLFG fall in this window whereas at Point 3, only 50% and 75% BLFG
are short of the 1% benchmark. This goes to all the combination at Point 4 as well,
which makes the back space of the room perceptible.
Figure 3: Daylight Factor of Clear Float Glass as Base
Figure 4: Daylight Factor of Green Float Glass as Base
Figure 4 shows the DF with GFG as the base. The highest DF for Point 1 is
achieved using 75% CFG and 25% GFG as base which is 16.51% and followed by
Upper limit of 3.5% Lower limit of 1.0%
75% BRFG and 25% GFG with DF of 16.40%. The percentage difference of Point 1
between this combination and the lowest illumination ratio (75% BLFG) is 74.1%. All
the 3 BLFG combination ranks the lowest comparing to the other glazing. However,
another 4 combination are similar to the 75% CFG which are 50% CFG, 25% CL and
50% BRFG with the value of 16.04%, 15.08% and 15.08% respectively. The lowest
ratio is seen in Point 3 and 4 with the value of 0.42 and 0.22 through the combination
of 75% BLFG. Besides that, when all the glazing combination is compared to the
benchmark, there are 3 combinations at Point 2 which are within the boundaries which
are 25% BLFG, 50% BLFG and 75% BLFG. At Point 3 however, only 50% BLFG and
75% BLFG do not reach the required benchmark as well as all the combination at
Point 4.
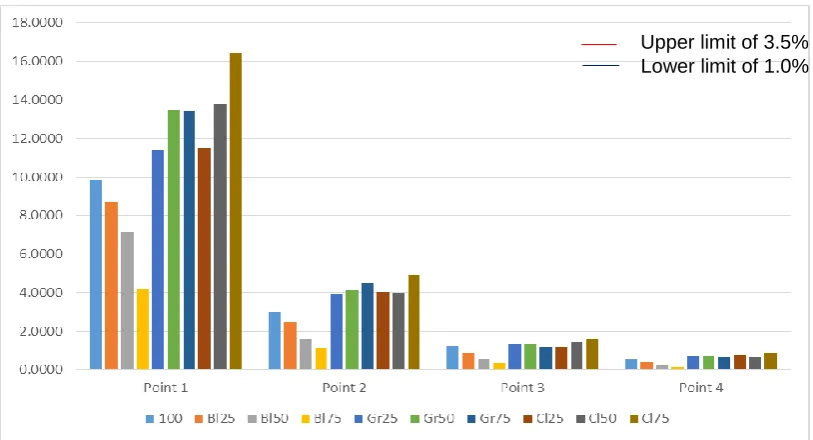
In Figure 4, the DF of all the glazing with BRFG are shown. For Point 1, 2, 3 and
4, 75% CFG tops the list with a DF of 16.45%, 4.92%, 1.61% and 0.89%. This is
followed by 50% CFG with 13.80%. Both 75% and 50% GFG have the same
illuminance ratio of 13.46. All combination of BLFG and 100% BRFG have lower ratio
than GFG and CLFG at Point 1 and 2. The difference between the highest ratio and
the lowest at Point 1 is 74.6%. At Point 4, the lowest ratio is shown by 75% BLFG with
0.16%. This is followed by 50% BLFG and 25% BLFG that gives a value of 0.16% and
0.24%. Therefore, all these combinations at Point 4 are not up to the 1% DF
benchmark set by MS1525:2014. The same goes to 25%, 50% and 75% BLFG at
Point 3. However, these 3 combinations along with 100% BRFG are within the
acceptable DF at Point 2 where all the other combinations exceeds the benchmark.
Figure 5 shows the DF of BLFG. The highest DF is achieved by combining 75%
CFG and 25% BLFG, 15.44% at Point 1, 5.45% at Point 2, 1.91% at Point 3 and
0.93% at Point 4. The lowest DF at Point 1 is 0.32% and differs 97.9% from the
highest percentage which is shown by 25% GFG. The second highest at point one is
shown through 75% GFG with a percentage of 12.73%. Whereas at Point 2, 75%
GFG and 25% BRFG have slight difference of 2.98% between both the value with
4.02% and 3.90%. When comparing with MS1525:2014, only 100% BLFG are within
the 1%-3.5% benchmark at Point 1. While at Point 2, it is joined by 50% BRFG, 75%
BRFG, 25% GFG, 50% GFG and 25% CFG. AT Point 3, 75% BRFG, 50% GFG, 75%
GFG, 50% CFG and 75% CFG also achieved the benchmark. However, all the
Figure 5: Daylight Factor of Bronze Float Glass as Base
Figure 6: Daylight Factor of Black Float Glass as Base
With the assumption of outdoor illuminance of 80k lux at 1200h and the
acceptable indoor illuminance level is 300 lux, the acceptable illuminance ratio is 0.37.
For a CFG base set, all the glazing combination achieve the benchmark at Point 1, 2
and 3. However, for Point 4, several combinations do not reach the ratio. For CFG as
base, 50% BLFG and 75% BLFG only have ratio of 0.24 and 0.23. As for GFG and
BRFG base, there are 2 combinations each which fell under the benchmark, which
are 75% BLFG and 50% BLFG with ratio of 0.22 and 0.31 for GFG base and 0.16 and
0.24 for BRFG base. There are another two combination when using BLFG as a base
which does not surpass the 0.37 ratio: 100% BLFG and 25% GFG with value of 0.11
Upper limit of 3.5% Lower limit of 1.0%
and 0.35.
Discussion
Previous studies on glazing has always been using only one full height glazing.
The results from this study gives a preliminary picture on how combinations of
different glazing type affecting the daylight level in a room.
As a general observation, all the simulation results shows a higher level of DF
than the required limit at Point 1 and none of the combination can achieve the
minimum level of 1% at Point 4 which show the high non-uniformity of daylight
distribution in the room.
Besides that, BRFG provides a good base of most of the combination as the
number of combination that falls between the benchmark levels are more than the
other three glazing. This gives BRFG a potential to be used in window design as it can
provide a feasible lighting level in both the points.
Conclusion
Based on the simulation of 40 different combination percentage of 4 glazing type
with IESVE, there are 4 combinations that achieved the benchmark of MS 1525 at
1.8m and 2.7m depth; 75% BRFG with CFG base, 25% BLFG with GFG base, 100%
BRFG and 25% GFG with BLFG base. These gives the designer options to use
different types of glazing based on the design of the building without compromising
the daylight performance in the interior. These combination series enable the glazing
to provide shading while allowing natural daylight to penetrate inside as the sun angle
will not affect the lower part of the window compared to the top and thus, gives a
choice of glazing selection at the bottom. Besides that, although most of the results
from the illumination ratio exceed the benchmark, consideration has to be apply in the
uniformity of the room as there are a significant differences between the front and end
part of the room. This study focused only on the DF percentage of the experimental
combination of glazing. Further studies can be done on intermediate sky condition to
simulate the daily performance of the glazing. It is also necessary to examine the glare index and thermal performance to evaluate the users’ visual comfort from the
other end of the room. Thermal studies will give the amount of energy that could be
saved and needed to provide a comfortable environment for users.
Acknowledgement
The author would like to acknowledge the research funding by Universiti
Q.J130000.2421.00G38, entitled “Daylight and Thermal Performance of Intelligent Glazing with Transparent Wireless Communication System”.
References
Alvarez, G., Palacios, M. J. and Flores, J. J. (2000). A Test Method to Evaluate the
Thermal Performance of Window Glazings, Applied Thermal Engineering, 20,
803-812.
Arsenault, H., Hébert, M. and Dubois, M-C. (2012). Effects of Glazing Colour Type on
Perception of Daylight Quality, Arousal and Switch-on Patterns of Electric Light in
Office Rooms, Building and Environment, 56, 223-231.
Bell, J. and Miller, W. F. (2008). The Use of Advanced Glazing in Combating
Residential Greenhouse Emissions in Subtropical and Tropical Regions in
Australia, Proceedings World Renewable Energy Congress X, Glasgow, Scotland.
Chen, D. and Chen, H. W. (2013). Using the Köppen Classification to Quantify
Climate Variation and Change: An Example for 1901-2010, Environmental
Development, 6, 69-79.
Fang, Y., Hyde, T. J. and Hewitt, N. (2010). Predicted Thermal Performance of Triple
Vacuum Glazing, Solar Energy, 84, 2132-2139.
Galasiu, A. D. and Veitch, J. A. (2006). Occupant Preferences and Satisfaction with
the Luminious Environment and Control Systems in Daylit Offices: A Literature
Review, Energy and Building, 38, 728-742.
Hu, J. and Olbina, S. (2014), Simulation-Based Model for Integrated Daylighting
System Design, Journal of Computing in Civil Engineering, 28, A4014003-11.
Li, D. H. W., Tsang, E. K. W., Cheung, K. L. and Tam, C. O. (2010). An analysis of
Light-pipe System via Full-scale Measurements, Applied Energy, 87, 799-805.
Mayhoub, M. S. and Carter, D.J. (2011). The Costs and Benefits of Using Daylight
Guidance to Light Office Buildings, Building and Environment, 46, 698-710.
Rosemann, A., Mossma, M. and Whitehead, L. (2008). Development of a
Cost-Effective Solar Illumination System to Bring Natural Light into the Building
Core, Solar Energy, 82, 302-310.
Shen, H. and Tzempelikos, A. (2013). Sensitivity Analysis on Daylighting and Energy
Performance of Perimeter Offices with Automated Shading, Building and
Environment, 59, 303-314.
Tang, L. and Hossain, F. (2012). Investigating the Similarity of Satellite Rainfall Error
Metrics as a Function of Köppen Climate Classification, Atmospheric Research,