ABSTRACT
YUAN, HUI. Development and Evaluation of Advanced Classification Systems
using Remotely Sensed Data for Accurate Land-Use/Land-Cover Mapping. (Under
the direction of Dr. Siamak Khorram.)
Our general objective in this research was to design, develop, implement, and evaluate advanced classification approaches for more accurate land-use/land-cover mapping using remotely sensed data. The overall research consists of three interrelated studies.
In the first study, we developed Simulated Annealing (SA) based classification systems for land cover mapping. SA has been shown to be able to overcome the local minimum problem that is typical with many unsupervised classification approaches. Our hypothesis in this study was that SA-based classification systems could help overcome the
local minimum problem in one of such approaches, K-means, and thus improve the
In the second study, we developed an automated Artificial Neural Network (ANN) classification system including two classification modules: 1) a supervised Multilayer Perceptron (MLP) neural network module, and 2) an unsupervised Kohonen Self-Organizing Mapping (KSOM) neural network module. In the KSOM network module, we incorporated SA random search procedures into the standard KSOM learning algorithm to reduce the likelihood to be trapped by local minima. Two hypotheses have been tested in this study: 1) the ANN system developed here was suitable for
land-use/land-cover classification, and 2) the KSOM network refined by SA could help
overcome the local minima problem and improve the classification performance of the
standard KSOM network. To test these hypotheses, we applied the ANN system to land-use/land-cove classifications of a Landsat TM image using a MLP network and two KSOM networks. The ANN classification system has been shown to be a robust and well-suited classification system for land cover mapping. Experimental results demonstrated that the incorporation of SA improved the classification performance of the standard KSOM network. Among the three classifications, the supervised MLP network had superior classification performance than the unsupervised KSOM networks.
ANNs have been shown to have great potential to fuse multiple source data sets. In the third study, we performed a two-stage multisource classification using the ANN system. The KSOM module in the ANN system was adapted as an Automated Data Selector (ADS) in the first stage to automatically select training data for the supervised MLP classification in the second stage. Two hypotheses were tested in this study: 1) the ADS adapted from the KSOM network could improve the quality of training sets and the
images could increase the classification accuracy of the derived land categories. Our experimental results demonstrated that the multisource classification using the ADS developed in this study was significantly better than that using manual data collection. The fusion of the two images significantly improved classification accuracy as compared to single source image classification when adequate and reliable training data sets were selected using the ADS.
ii
Dedication
To my parents and my husband
iii
Biography
iv
Acknowledgements
First of all I thank all my committee members, Dr. Siamak Khorram, Dr. Hugh Devine, Dr. Joseph Roise, and Dr. Wesley Snyder, for their supports and discussions throughout the development of this research. My first special gratitude goes to my advisor, Dr. Siamak Khorram, for his wisdom and enthusiastic encouragements to help me turn my dream into reality. I would also like to thank Dr. Snyder particularly for spending lots of time helping me clarify many technical issues in my dissertation. His input has greatly improved the completeness of my work. I owe a great debt to Dr. Xiaolong Dai, who taught me to walk the first step as a researcher and consistently provided me assistance throughout the five years of my degree program. I want to express my sincere gratefulness to Dr. Xinghe Yang from ERDAS IMAGINE, for his spiritual encouragements and technical supports. He had offered a lot of good suggestions to help me refine my dissertation.
In addition, I would like to take this chance to thank many graduate students and staff of the Center for Earth Observation for their friendly supports. Special credits should go to Joseph Knight for his great contribution of precious time hours in proofreading of many of my paper drafts. Thanks are also due to Cray Research, Inc. and North Carolina Supercomputing Center for their financial and technical support in my work. Without these people, I would not have made today possible.
v
Table of Contents
List of Tables ... viii
List of Figures ... ix
1. Introduction... 1
1.1 Why advanced classification techniques are needed... 2
1.2 Proposed classification systems and their applications ... 5
1.2.1 Study one: development of SA-based classification systems ...6
1.2.2 Study two: development of an automated neural network classification system ...8
1.2.3 Study three: development of a two-stage neural network-based multisource classification using multiple remotely sensed data...10
1.3 Dissertation Organization ... 12
References ... 13
2. Literature Review... 16
2.1 Review of thematic land information extraction from remotely sensed data ………. 16
2.1.1 Remotely sensed data and their applications for land cover classification ...17
2.1.2 Classification algorithms and their applications for land cover classification using remotely sensed data ...21
2.2 Review on Simulated Annealing (SA) and Applications for Land Cover Information Extraction using Remotely Sensed Data ... 30
2.2.1 Introduction...30
2.2.2 Fundamentals of Simulated Annealing ...30
2.2.3 General discussion of SA and unsupervised classification ...34
2.3 Review of Artificial Neural Networks Applications in Land cover Classifications ………..35
2.3.1 Introduction...35
2.3.2 Popular ANN models in remotely sensed classification applications ...36
2.3.3 Multisource image classification using artificial neural networks...43
2.3.4 General discussion and summary...46
References ... 50
3. Paper #1 Development and Evaluation of Land-Use/Land-Cover Classification Systems using Simulated Annealing... 67
3.1 Introduction ... 68
vi
3.2.1 Clustering by minimizing the distance function ...72
3.2.2 Simulated Annealing: basic principle ...75
3.2.3 Adaptation of Simulated Annealing for Clustering Issues...77
3.2.4 Definition of Parameters in SA...79
3.2.5 Integration of the SA and K-means for Clustering Refinement...81
3.3 Applications to Land-cover/Land-use Classification ... 83
3.3.1 Description of data sets and classification scheme ...83
3.3.2 Study of the selection and roles of parameters in SA ...86
3.3.3 Classification results and analysis...93
3.4 General Discussion and Conclusion... 104
3.5 Recommendations for future research... 107
References ... 108
4. #Paper 2 Development of an automated neural network classification system for remote sensing based land cover mapping... 114
4.1 Introduction ... 115
4.2 Neural network Classification Approaches ... 118
4.2.1 Multilayer Perceptron (MLP) neural network...118
4.2.2 Kohonen’s self-organizing mapping (KSOM) neural network...122
4.3 Development of an automated ANN classification system ... 127
4.4 Case study: neural network classification ... 134
4.4.1 Study area and classification scheme...134
4.4.2 Operational issues in neural network classification ...136
4.4.3 Neural network classification and discussions...141
4.5 Conclusions and future work... 149
References ... 152
5. #Paper 3 Development of a two-stage neural network-based land cover mapping system using multisource remotely sensing data ... 158
5.1 Introduction ... 159
5.1.1 Problem statement...161
5.1.2 A proposed two-stage neural network based multisource classification...163
5.2 Neural Network Methodologies and the Automated Data Selector ... 164
5.2.1 Kohonen’s Self-Organizing Mapping (KSOM) neural network model ...165
5.2.2 Multilayer Perceptron (MLP) neural network model...166
5.2.3 The adapted automated data selector ...167
5.3 A Two-stage Neural Network based Multisource Classification ... 171
5.3.1 Study area and class definition...171
5.3.2 Image preprocessing ...174
vii
5.3.4 Classification results and discussion...183
5.4 Summary and Conclusions ... 191
References ... 193
6. Summary and General Conclusions... 198
6.1 Study One ... 198
6.2 Study Two... 199
6.3 Study Three... 200
6.4 General Summary ... 202
6.5 Recommended Future work... 203
viii
List of Tables
Table 3. 1 SA-related Parameters and Performance Indexes from TM-1... 96
Table 3. 2 Error matrix on the classified result of TM-1 from the K-means... 96
Table 3. 3 Error matrix on the classified result of TM-1 from the single SA-based algorithm... 96
Table 3. 4 Error matrix on the classified result of TM-1 from the integrated SA-based Algorithm... 97
Table 3. 5 Individual Kappa Analysis for the three Error Matrices from TM-1... 97
Table 3. 6 Kappa Analysis Results for the Comparisons of the Error Matrices from TM-1... 97
Table 3. 7 SA-related Parameters and best classification results from TM-2... 99
Table 3. 8 Error matrix on the classified result of TM-2 from the K-means... 99
Table 3. 9 Error matrix on the classified result of TM-2 from the Single SA-based algorithm... 99
Table 3. 10 Error matrix on the classified result of TM-2 from the integrated SA-based algorithm... 100
Table 3. 11 Individual Kappa Analysis for the Three Error Matrixes from TM-2... 100
Table 3. 12 Kappa Analysis Results for the Comparisons of the Error Matrixes from TM-2... 100
Table 4. 1 Classification scheme and category definition………..135
Table 4. 2 Error matrix on the classified map from the MLP network... 146
Table 4. 3 Error matrix on the classified map from the KSOM network... 147
Table 4. 4 Error matrix on the classified map from the KSOM-SA... 147
Table 4. 5 Individual Kappa Analysis for the three network error matrices... 148
Table 4. 6 Kappa analysis results for the comparisons of the three error matrices... 148
Table 5. 1 Classification scheme and category definition………..174
Table 5. 2 Error matrix on the classified map of the two-stage multisource classification... 184
Table 5. 3 Error matrix on the classified map of the one-stage MLP multisource classification... 184
Table 5. 4 Error matrix on the classified map of the one-stage MLP-TM classification... 185
Table 5. 5 Individual Kappa Analysis on the error matrices Table 5.2, Table5.3, and Table 5.4... 185
Table 5. 6 Kappa analysis results for the comparisons of Table 5.2, Table5.3, and Table 5.4... 185
Table 5. 7 Error matrix on the classified result of the fused image by dropping 40 reference points with time change from Table 5.2... 189
Table 5. 8 Error matrix on the classified result of the fused image by dropping 9 reference points with significant misregistration error from Table 5.2... 189
Table 5. 9 Error matrix on the classified result of the fused image by dropping 48 reference points either with class changes or with significant misregistration error from Table 5.2... 190
Table 5. 10 Individual Kappa Analysis on Table 5.2, Table5.7, Table 5.8, and Table 5.9... 190
ix
List of Figures
Figure 1. 1 Flowchart and structure of the three-paper styled dissertation... 6
Figure 1. 2 General system interface description of each ANN classifier module and interaction between sub-modules within system... 9
Figure 2. 1 The structure of a three-layer neural network with 4 input nodes, 10 hidden nodes and 5 output nodes………38
Figure 2. 2 The structure of a Kohonen’s Self-Organization Mapping Neural network with 4 input nodes and 9 output nodes... 41
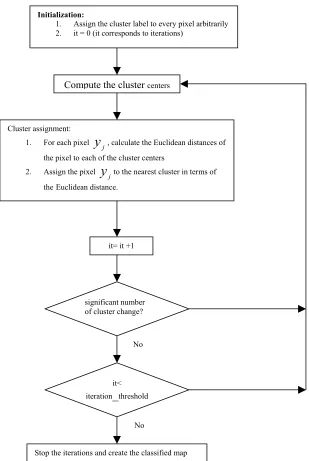
Figure 3. 1 The flowchart of K-means clustering algorithm……….74
Figure 3. 2 The adapted single SA-based clustering algorithm... 78
Figure 3. 3 Original Landsat TM-1... 83
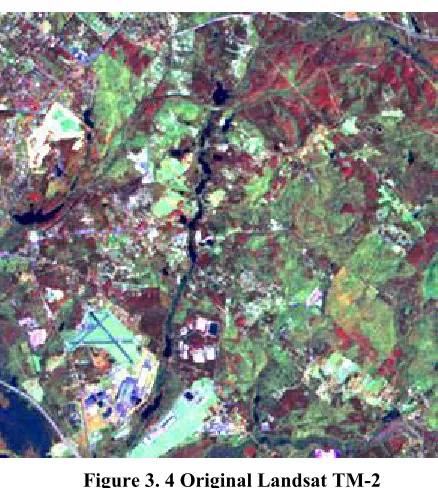
Figure 3. 4 Original Landsat TM-2... 84
Figure 3. 5 Effect of
T
0 on the magnitude of J(V) ... 87Figure 3. 6 Effect of µ on the magnitude of J(V) ... 88
Figure 3. 7 Effect of the IET on magnitude of J(V) ... 88
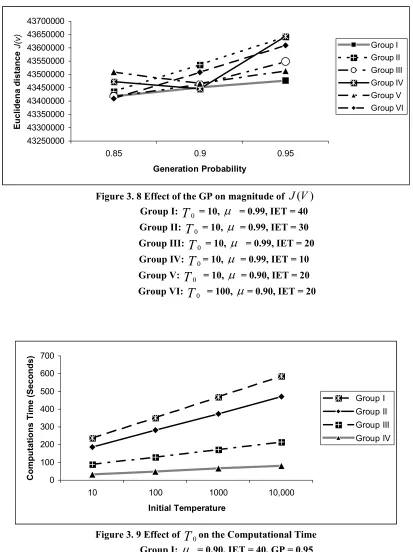
Figure 3. 8 Effect of the GP on magnitude of J(V) ... 89
Figure 3. 9 Effect of
T
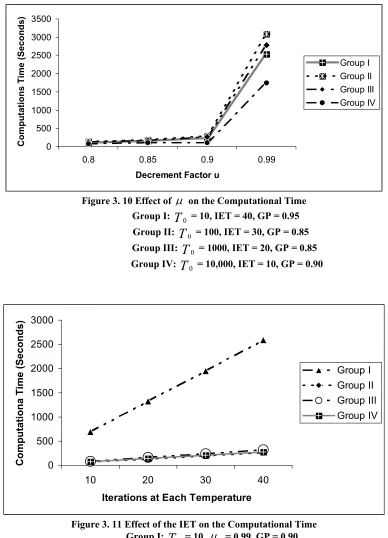
0on the Computational Time... 89Figure 3. 10 Effect of µ on the Computational Time... 90
Figure 3. 11 Effect of the IET on the Computational Time... 90
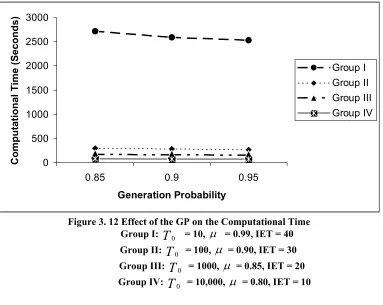
Figure 3. 12 Effect of the GP on the Computational Time... 91
Figure 3. 13 The original image TM-1 and the classified maps... 95
Figure 3. 14 The original image TM-2 and the classified maps... 98
Figure 3. 15 Scatter plots of the 253 reference points from TM-1 and their class labels... 102
Figure 3. 16 Scatter plots of the 299 reference points from TM-2 and their class labels... 103
Figure 4. 1 The structure of three-layer neural network with 4 input nodes, 10 hidden nodes, and 5 output nodes………..119
Figure 4. 2 The structure of Kohonen’s Self-Organization Mapping Neural network... 123
Figure 4. 3 The flowchart of the ANN-based Classification System... 130
Figure 4. 4 Main Interface of the ANN System... 131
Figure 4. 5 Pattern Conversion Sub-module Interfaces of the ANN System... 132
Figure 4. 6 KSOM Training Sub-module Interfaces of the ANN System... 132
Figure 4. 7 MLP Training Sub-module Interface of the ANN System... 133
Figure 4. 8 Network Generalization Sub-module Interfaces of the ANN System... 133
Figure 4. 9 The standard false color display of the acquired Landsat TM image... 135
Figure 4. 10 Classified maps of the three network classifiers... 144
Figure 4. 11 Learning curve of the mean squared error (MSE) vs. training epochs from the MLP network ... 145
Figure 4. 12 Topological maps from the KSOM and KSOM-SA networks... 145
Figure 5. 1 The original KSOM Generalization Sub-module Interface of the ANN System …………. 169
Figure 5. 2 The Modified Interface of the KSOM Generalization Sub-module... 169
x
Figure 5. 4 Two multispectral images that are used in the fusion application... 176
Figure 5. 5 Learning curves of the MLP training... 181
1
1. Introduction
Remote sensing is the science and art of deriving information about an object, area, or phenomenon by means of the analysis of data that are acquired without direct contact (Lillesand & Kiefer 2000; Jerson, 1996). Basically, the devices or sensors aboard satellites or aircrafts record electromagnetic energy emanating from the objects on multiple spectral bands, resulting in multispectral remotely sensed data (Swain & Davis 1978; Jerson, 1996; Lillesand & Kiefer 2000). Remotely sensed data have great potential to help solve many environmental problems (Swain & Davis 1978; Lillesand & Kiefer 2000): 1) management and conservation of natural resources, 2) urban and regional planning, 3) controlling and mitigating of environmental pollution, and 4) meteorological phenomena.
2
investigate advanced computerized techniques to derive the most accurate and efficient information in a timely manner from currently available remotely sensed data.
1.1
Why advanced classification techniques are needed
It is crucial to maintain accurate and current information on cover and land-use conditions for timely planning, management and conservation of natural land resources. Multispectal classification of remotely sensed data offers a feasible tool to generate detailed land inventories especially for large, distant, and relatively ecologically complex areas. Various multispectal classification techniques have been used to produce high quality maps of the earth by assigning each pixel on the remotely sensed data to its appropriate thematic land category. An in-depth discussion of classification techniques can be found in numerous papers (Jain 1989; Jain & Dubes 1988; Schowengerdt 1983; Swain & Davis 1978; Tou & Gonzales 1977; Duda & Hart 1973). Among the most commonly used techniques in these remote sensing applications are K-means, minimum distance to means, maximum likelihood.
3
local minima problem could significantly affect the resulting classification performance. This issue has motivated many researchers to search for new techniques that can overcome the local minima problem and thus approximate the global or near-global minimal solution. As shown by Geman & Geman (1984) and Aarts & Laarhoven (1987), Simulated Annealing (SA) has the potential to find or approximate the global or near global minimum in a combinatorial optimization problem. The basic idea of SA is to incorporate some randomness into the assignments of cluster labels to pixels in the clustering procedure, thus reducing the likelihood of getting trapped in a local minimum. Based on this, we hypothesize that SA-based classification systems may be able to overcome the limitation of local minima so as to improve the classification accuracy for land cover classification. However, to date, SA has not been thoroughly investigated and has been rarely applied in remotely sensing applications because SA is computationally expensive and therefore not practical to deal with the large data sets typical of remotely sensed applications. However, the rapidly growing and available computing power in recent years enables faster processing of huge data sets and facilitates the use of more sophisticated and diverse methods for data classification. SA is one of the most interesting of these methods.
4
especially for multisource classification (Benediktsson et al.1990). It is thus necessary to develop advanced classification techniques that will have better classification performance under such circumstances. Classification approaches based on Artificial Neural Networks (ANN) have been extensively used in land cover and land use mapping during the past decade and are shown to be well-suited for remotely sensed image classifications (Zhang & Foody 2001; Serpico & Roli, 1995; Bischof et al. 1992; Heermann & Khazenie 1992; Benediktsson 1990). As compared to traditional statistical classification approaches, ANN-based approaches have many advantages: 1) independence of the statistical distribution of the input data, 2) the ability to estimate the non-linear relationship between the input data and desired outputs, 3) parallel computational potential, 4) fast generalization capability once a well-trained network is found, and 5) the ability to fuse different types of spatial data sets.
The rapid advancement of spatial and computer technologies in recent years has led to a dramatic boost in available remotely sensed data and Geographical Information System attribute data. The availability of multiple types of spatial data offers the potential to explore the real world more accurately because the fusion of complementary data can help reduce uncertainty and improve classification accuracy (Hagarat–Mascle et al.
5
simpler than traditional statistical classification methods such as maximum likelihood classifiers (Foody & Arora 1997; Bischof et al. 1992; Benediktsson et al.1990).
It has been shown that no single approach or procedure is optimal to completely solve a complex classification problem (Jain et al. 2000). The combination of classifiers has, therefore, become a heavily studied topic. An ideal classification system should be: 1) as fully automated and as fast as possible to process large data sets quickly, and 2) as robust and as flexible as possible to be able to handle various situations, for example, single source vs. multisource data classification, with minimal human interaction. Thus, the study of the complexity, feasibility, timeliness, and performance of different classification methods is our focus in this research.
1.2 Proposed classification systems and their applications
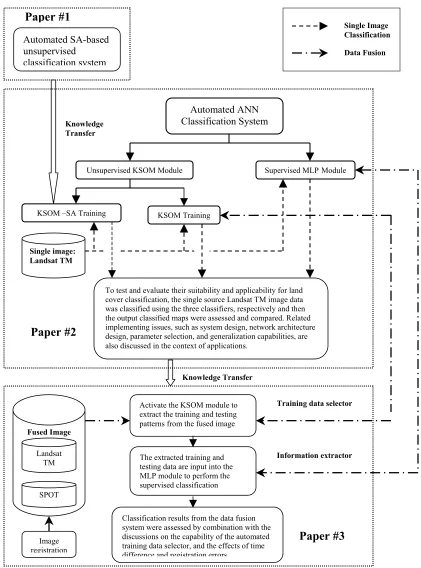
In this dissertation research, we propose to explore, design, develop, implement, and evaluate advanced LU/LC SA- and ANN-based classification systems that can handle single and multisource remotely sensed imageries. This research consists of three interrelated studies. The working flowchart for the three studies is shown in Figure 1.1. The specific objectives for each of the studies are as follows:
To develop and evaluate SA-based classification systems in the first study.
To develop an automated neural network classification system for remote sensing based land cover mapping applications in the second study.
6
Figure 1. 1 Flowchart and structure of the three-paper styled dissertation Automated SA-based unsupervised classification system Paper #1 Knowledge Transfer KSOM Training Automated ANN Classification System
KSOM –SA Training
Supervised MLPModule Unsupervised KSOM Module
Paper #2
Single image: Landsat TM
To test and evaluate their suitability and applicability for land cover classification, the single source Landsat TM image data was classified using the three classifiers, respectively and then the output classified maps were assessed and compared. Related implementing issues, such as system design, network architecture design, parameter selection, and generalization capabilities, are also discussed in the context of applications.
Single Image Classification Data Fusion Knowledge Transfer Fused Image Landsat TM SPOT
Activate the KSOM module to extract the training and testing patterns from the fused image
The extracted training and testing data are input into the MLP module to perform the supervised classification
Classification results from the data fusion system were assessed by combination with the discussions on the capability of the automated training data selector, and the effects of time difference and registration errors
Image registration
Training data selector
Information extractor
7
1.2.1 Study one: development of SA-based classification systems
Many previous studies have shown that one of the traditional iterative unsupervised approaches, K-means, suffers from the aforementioned local minima problem (Selim & Alsultan 1991; Klein & Dubes 1989). SA is proved to be able to overcome the local minimum problem (Geman & Geman 1984; Aarts & Laarhoven 1987). Our hypothesis is that SA-based classification systems can solve the local minimum problem in K-means and thus improve classification performance. In this study, two automated SA-based classification systems are proposed: 1) the Single SA-based (S-SA) system that is developed based on the standard SA algorithm, and 2) the Integrated SA-based (I-SA) system that is developed by combining the standard SA algorithm and
8
1.2.2 Study two: development of an automated neural network classification system
9
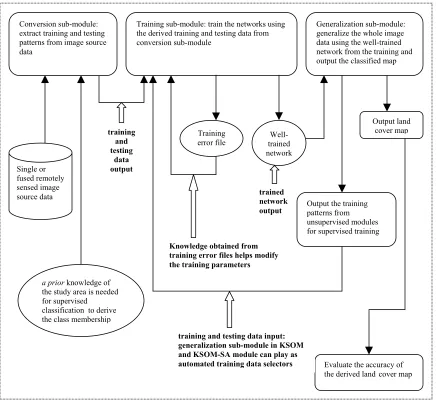
Figure 1. 2 General system interface description of each ANN classifier module and interaction between sub-modules within system
Single or fused remotely sensed image source data
a prior knowledge of
the study area is needed for supervised classification to derive the class membership Conversion sub-module: extract training and testing patterns from image source data
Training sub-module: train the networks using the derived training and testing data from conversion sub-module
Generalization sub-module: generalize the whole image data using the well-trained network from the training and output the classified map
Training error file
Output land cover map
Evaluate the accuracy of the derived land cover map training
and testing
data output
Knowledge obtained from training error files helps modify the training parameters
trained network output
training and testing data input: generalization sub-module in KSOM and KSOM-SA module can play as automated training data selectors
Well-trained network
10
Two hypotheses are tested in this study: 1) the proposed ANN system is well-suited
for LU/LC classification, and 2) the refined KSOM-SA network has the potential to
overcome the local minima problem and thus improve the classification performance as
compared with the standard KSOM network. To verify these two hypotheses, we apply
the ANN system to perform LU/LC classifications of a Landsat TM image using the supervised MLP network and the two unsupervised KSOM networks. The training and testing data sets are manually extracted from the TM image to train the network classifiers. For the supervised MLP classification, the class labels are provided for each training and testing data. Once the training is complete, the three well-trained networks are used to classify the entire TM image into a land cover map with eight categories. The resulting classifications from the three neural networks are assessed by comparison with reference data derived from the high spatial resolution Digital Color Infrared (CIR) Digital Orthophoto Quarter Quad (DOQQ) data. To qualitatively evaluate the classification performance of the three ANN classification approaches in terms of the classification accuracy, Kappa analyses are performed on the resulting ANN classifications.
1.2.3 Study three: development of a two-stage neural network-based multisource
classification using multiple remotely sensed data
11
12
classification in which, instead of collecting training data sets from the fused image, we manually collect training data sets from the single Landsat TM image to train the network and then perform the image classification.
Two hypotheses are tested in this study: 1) the ADS adapted from the KSOM
network provides adequate and reliable training data sets and thus improves the
classification performance of the MLP classification, and 2) the fusion of the two Landsat
TM and SPOT images using the ANN system increases the classification accuracy of the
derived land categories. The comparison between the two-stage multisource
classification using the ADS and the one-stage MLP multisource classification using the manually collected training data can show the effectiveness of the ADS and test the first hypothesis. By comparing the stage MLP multisource classification with the one-stage MLP-TM classification, the second hypothesis can be tested.
1.3 Dissertation Organization
13
References
Aarts, E. H. L., and P. J. M. Van Laarhoven, “Simulated annealing: a
pedestrian review of the theory and some applications”, Pattern recognition theory and applications, pp.179-192, 1987.
Benediktsson, J.A., P.H. Swain, and O.K. Ersoy, “Neural network approaches versus statistical methods in classification of multi-source remote sensing data,” IEEE Transaction on Geoscience and Remote Sensing, vol. 28, pp. 540-551, 1990. Benediktsson, J.A., and J. R. Sveinsson, “Feature extraction for multisource data
classification with artificial neural networks,” International Journal of Remote Sensing, vol. 18, no. 4, pp. 727-740, 1997.
Bischof, H., W. Schneider, and A. J. Pinz, “ Multispectral classification of landsat images using neural networks,” IEEE Transaction on Geoscience and Remote Sensing, vol. 30, no. 3, pp. 482 – 490, 1992.
Carpenter, G.A., M.N. Gjaja, S. Gopal, and C.E. Woodcock, “ART neural networks for remote sensing: vegetation classification from Landsat TM and terrain data,”
IEEE Transaction on Geoscience and Remote Sensing, vol. 35, no. 2, pp. 308-325, 1997.
Duda, R. O., and P. E. Hart. Pattern classification and scene analysis. New York: Wiley- Interscience. 1973.
14
Geman, S., and D. Geman, “Stochastic relaxation, Gibbs distributions, and the Bayesian restoration of images,” IEEE Proceeding. Pattern Analysis and Machine
Intelligence, vol. 6, pp. 721 – 741, 1984.
Granville, V., M. Krivanek, and Jean-Paul Rasson, “Simulated annealing: a
proof of convergence,” IEEE Transactions on Pattern Analysis and Machine Iintelligence, vol. 16, no. 6, pp. 652-656, 1994.
Hegarat-Macel S. L., I. Bloch, and D. Vidal-Madjar, “Application of Dempster-Shafer evidence theory to unsupervised classification in multisource remote sensing,”
IEEE Transaction on Geoscience and Remote Sensing, vol. 35, no. 4, pp.1018 – 1031,1997.
Heermann, P. D., and N. Khazenie, “Classification of multispectral remote sensing data using a back-propagation neural network,” IEEE Transaction on Geoscience and Remote Sensing, vol. 30, pp.81-88, 1992.
Highleyman, W. H., “Linear decision functions, with applications to pattern recognition,”
Proc. IRE, vol. 50, pp.1501 – 1514, 1962.
Jain, A. K., R. P. W. Dulin, and J. C. Mao, “Statistical pattern recognition: a review,”
IEEE Transaction on Pattern Analysis and Machine Intelligence, vol. 22, no.1, pp. 4 – 37, 2000.
Jenson, J. R.. Introductory digital image processing. Englewood Cliffs, NJ: Pretentice Hall. 1996.
15
Kolonko, M., and M. T. Tran, “Convergence of simulated annealing with feedback temperature schedules,” Probability in the Engineering and Informational Sciences, vol. 11, pp. 279-304, 1997.
Lillesand, T. M., and R. F. Keifer, Remote sensing and image interpretation. 4th.
NewYork: Wiley, 2000.
Locatellli, M., “Convergence properties of simulated annealing for continuous global optimization,” Journal of Applied Probability, vol. 33, pp. 1127-1140, 1996.
Serpico, S. B., and F. Roli, “Classification of multisensor remote-sensing images by structured neural networks,” IEEE Trans. Geosci. And Rem. Sens., vol.33, no.3, pp. 562-578, 1995.
Selim, S. Z., and K. Alsultan, “A simulated annealing algorithm for the
clustering problem,” Pattern Recognition, vol. 24, no. 10, pp.1003-1008, 1991. Smith, F. W., “ Pattern classifier design by linear programming,” IEEE Trans. Comput.,
vol. C-17, pp. 367 – 372, 1968.
Swain, P. H., and S. M. Davis, Remote sensing: the quantitative approach.
New York: McGraw-Hill, pp. 136 – 188,1978.
16
2. Literature Review
2.1
Review of thematic land information extraction from remotely
sensed data
17
2.1.1 Remotely sensed data and their applications for land cover classification
2.1.1.1 Advanced Very High Resolution Radiometer (AVHRR) Data
18 2.1.1.2 Landsat Thematic Mapper (TM) system
Since 1972, the National Aeronautics and Space Administration (NASA) have launched a series of Earth-monitoring satellites that are designed for the needs of resource managers and Earth scientists. The Landsat systems are one of the most widely used satellites for LU/LC applications. The improved spatial resolution (30 m) of TM data as compared to NOAA AVHRR data increases its capability to differentiate land cover types for LU/LC applications at a relatively local scale. The enhanced spectral resolution improves the spectral separability between LU/LC classes and makes it particularly useful to characterize areas with various vegetation covers (Solberg et al.
1994; Frank 1988; Strahler et al. 1978). Furthermore, Landsat TM data has been demonstrated to well-suited for urban studies (Haack et al. 1987; Khorram et al. 1987). The enhanced characteristics of Landsat TM systems, and the reliable, low cost, data acquisitions have led the Landsat TM data to be one of the most popular satellite images in LU/LC applications.
2.1.1.3 Satellite Pour l’Observation de la Terre (SPOT) System
The SPOT satellite Earth Observation System was designed by the CNES (Center National d'Etudes Spatiales), in France. The development of the SPOT system with onboard High Resolution Visible (HRV) sensors was announced by Jaakkola et al.
19
that enhances the capabilities to detect the land surface details. This suggests that the SPOT system is particularly useful for land-cover mapping applications at a local scale. Merging of both SPOT multispectral and panchromatic data with a spatial resolution of 10m is suitable for urban/suburban mapping (Couloigner et al., 1998).
2.1.1.4 Radio Detecting and Ranging Satellite (RADARSAT) System
The Canadian RADARSAT-1 was launched in November 1995 to acquire data for monitoring environmental changes and improving the management of natural resources. Its mapping capabilities enhance the classification performance of optical aerial and satellites. Optical aerial and satellites have been used for a long time to produce information about the current LU/LC characterization (Running et al. 1995; Jaakkola et al. 1987; Strahler et al. 1978). Unfortunately, its performance is restricted by adverse meteorological conditions, such as clouds, rain, or fog. Synthetic Aperture Radar (SAR) is a powerful sensor that can overcome these meteorological restrictions because it contains an electromagnetic microwave spectrum that is insensitive to rain, fog, hail, smoke, and most importantly, clouds (Elachi 1988). RADARSAT imagery has been utilized to study its applicability in the LU/LC applications in forest areas (Kux et al.
20
resulting classification accuracy. However, RADARSAT data have to be rectified using some special image preprocessing procedures to remove speckle noise.
2.1.1.5 I-KOH-NOHS (IKONOS) System
The IKONOS satellite is the world's first commercial satellite to collect images with one-meter resolution. IKONOS is derived from the Greek word for "image". IKONOS-1 was successfully launched on 24th of September 1999. Space Imaging EOSAT (Colorado, USA) is operating the satellite in co-operation with a network of regional ground stations. IKONOS image data are distinct from other satellite data sets because of their very high spatial resolution (1-meter panchromatic and 4-meter
multispectral). In the past, the applicability of remotely sensing data to many LU/LC applications, such as urban planning on a local scale and vegetation species discrimination, was limited because the high spatial resolution data were not available. The moderate spatial resolutions of Landsat TM and multispectral SPOT data have been shown to be inadequate for the accuracy and specificity required for many urban applications (Harrison & Richards 1988; Haack et al. 1987; Khorram et al. 1987). The very high-resolution IKONOS data offers a better choice in these classifications.
2.1.1.6 General discussions of satellite images
21
various mapping scales ranging from global to local. With the advantage of large coverage and high temporal resolution, the satellite imagery from NOAA AVHRR is more suitable for regional and global scale land mapping. For regional and local scale mapping, the most suitable satellite data are Landsat TM and SPOT image data sets. The IKONOS image data with very high spatial resolution makes urban planning at small local areas possible. In addition, the fusion of RADARSAT data and optical satellite images is useful to reduce the effects of adverse meteorological and atmospheric conditions. The use of the appropriate image data is very important for any specific application and ensures proper information to be generated. Unfortunately, in practice, there are many factors, such as the project budget and the timely requirement, that often compromise the accessibility of the most appropriate data. Under such circumstances, it is essential to use some powerful image analytical techniques to enhance the differentiation capability of the acquired image data.
2.1.2 Classification algorithms and their applications for land cover classification
using remotely sensed data
22
Unsupervised classification is known as “clustering” which is “a generic labeling procedure designed to find natural groupings, or clusters, in multidimensional data based on measured or perceived similarities among patterns” (Jain 1989). It is the analysts’ responsibility to relate the resulting spectral clusters from unsupervised classification to the desired land categories (Jensen 1996; Lark 1995; Schowengerdt 1983; Swain & Davis 1978).
In the following sections from 2.1.2.1 to 2.1.2.5, we briefly review the five most frequently used classifiers in remote sensing: three supervised (parallelpiped, maximum likelihood, and minimum distance), and two unsupervised (K-means and ISODATA). A general discussion on their pros and cons in remote sensing application is given in section 2.1.2.6.
2.1.2.1 Parallelpiped Classification
This method is based on a simple Boolean “and/or” logic decision rule (Jensen 1996). Training data in n spectral bands are used to estimate a n-dimensional mean vector,
µ
k=(
µ
k1,µ
k2,...,µ
ki,.µ
ki+1,...,µ
kn)
withµ
kidenoting the mean value of the training dataobtained from the kthclass in the ith spectral band, and the standard deviation
S
kidenotingthe standard deviation of the training data of the kth class in the ith band. The parallelepiped algorithm assigns an unknown pixel
Y
j denoted by an n-dimensionalvector
(
y
j1,y
j2,...,y
ji,...y
jn)
to the kth class if and only ifS
y
S
ki ji ki kiki− ≤ ≤
µ
+µ
--- (2.1)23
i = 1,2,3,…,n and n denotes the number of spectral bands
Based on Equation 2.1, the decision boundary of each of the m classes is a rectangular area in a two-dimensional feature space. An unknown pixel is classified based on the decision boundary in which it lies, or as ‘unknown’ if it lies outside all decision boundaries (Lillesand & Kiefer 2000).
This parallelepiped method is computationally efficient (Lillesand & Kiefer 2000; Jensen 1996). However, the classifier may have high misclassification rates if there exist significant decision boundary overlaps between classes (Lillesand & Kiefer 2000). In addition, there may be many unclassified pixels outside any one of the m defined decision boundaries. Lillesand and Kiefer (2000) propose to solve the overlapping problem by dividing the single rectangles of the decision boundaries into a series of rectangles with stepped borders. Jensen (1996) suggests combining this classifier with other classifiers, such as the minimum distance and the maximum-likelihood, to classify those unclassified or ambiguous pixels to classes.
2.1.2.2 Maximum-Likelihood or Bayesian Classification
The maximum-likelihood (ML) is the most popular classifier in remote sensing (Foody et al. 1992; Maselli et al. 1992; Bolstad & Lillesand 1991; Richards 1986; Mather 1985; Shlien 1977).
24
data. Based on the estimated probability density functions, an unknown pixel is assigned to the class with highest probability value. An extension of the maximum likelihood approach is the Bayesian classifier. The Bayesian classifier incorporates two weighting factors into classification: the a priori probability, i.e., the anticipated likelihood of occurrence for each class in the given scene, and a weight associated with the ‘penalty’ of misclassification.
25 2.1.2.3 Minimum distance to means Classification
This Minimum distance classifier is computationally simple (Jensen 1996). Like the parallelepiped classifier, the mean vectors and standard deviation for each class are estimated from the acquired training data. Using this method, an unclassified pixel is assigned to the nearest class in an n-band spectral space. The most commonly used distance measure to determine the nearest class is Euclidean distance.
The minimum distance classifier has been applied in many remote sensing applications (Lee & Landgrebe 1993; Franklin & Wilson 1992; Hodgson 1988). Jensen (1996) points out that the minimum-distance decision rule could produce good classification results that are comparable to those from the sophisticated classifiers such as maximum-likelihood when classes are spectrally separated.
2.1.2.4 K-means Classification
The K-means classifier is a very popular clustering algorithm and is the basis of many sophisticated clustering algorithms (Jain & Dubes 1988; Selim & Ismail 1984; Tou & Gonzales 1977; Duda & Hart 1973; Fukunga 1972). In a clustering problem, the generalized least-squared error function J(V) is defined as below to guide the search for an optimal k clustering:
∑
=
= N
j
d
ijV J
1 2
)
( --- (2.2)
where
d
ij2 is the associated distance function ( 2 || ||2v
y
d
ij= j− i ) between a patterny
j and26 } ], , 1 [ /
{
y
y
R
nj
j j N
Y = ∈ ∈ is the data set,
N is the number of patterns within the data set,
} ], , 1 [ /
{
v
v
R
ni i i k
V = ∈ ∈ is the set of k cluster centers
The minimization of such a criterion function is usually sought by an iterative scheme, which starts with arbitrarily chosen initial cluster centers in the first iteration. Each pixel is then assigned to the closest cluster. A new set of cluster centers is calculated from the results of the previous assignments and the pixels reassigned to the clusters. The procedure continues until there is no significant change in pixel assignments from one iteration to the next or a certain number of iterations are attained.
The K-means classifier is computationally efficient. Although no general proof of convergence exists for this algorithm, it is able to produce good results if the clusters are compact, well separated in the feature space, and hyperspherical in shape if Euclidean
distance is used, or hyperelliptical in shape if Mahalanobis distance is used (Jain et al.
27
criterion function in fuzzy K-means algorithm (Lillesand & Keifer 2000; Jerson 1996; Bezdek 1981), 2) using generic algorithms, such as simulated annealing (Yuan et al.
1999; Bandyopadhyay et al. 1998; Brown & Huntley 1992), and deterministic annealing to optimize the resulting clustering (Rose 1998), and 3) mapping it onto a neural network for parallel implementation (Mao et al. 1994).
2.1.2.5 ISODATA Classification Algorithm
The well-known Iterative Self-Organizing Data Analysis Technique (ISODATA) (Jain 1989; Selim & Ismail 1984; Tou & Gonzales 1977; Ball & Hall 1965) can be considered as a sophisticated version of K-means that incorporates a comprehensive set of heuristic procedures. The most important heuristic procedures in ISODATA are cluster lumping and cluster splitting. In the ISODATA classifier, a set of parameters is specified to create new clusters or merge existing clusters. A cluster is split if it contains too many pixels and has an unusually large variance within the cluster. Two clusters are merged if their cluster centers are sufficiently close. To perform the cluster split and merge operations in ISODATA algorithm, the parameters are usually specified as follows: (Jensen 1996; Tou & Gonzales 1977):
The maximum number of clusters to be identified.
The maximum number of pixels without cluster changes between iterations, and the maximum iterations. These two parameters control when to terminate the iteration.
28
The minimum distance and the minimum number of pixels within a cluster. These two parameters determine when to merge clusters.
The iterative clustering process of ISODATA is similar to that of K-means. However, the assignment of each pixel in ISODATA involves additional analyses using the described parameters to split or merge the clusters. There are many successful applications of ISODATA in remote sensing (Ouegan et al. 2000; Pierce et al. 1998; Jensen 1996). The cluster splitting and merging capability of the ISODATA classifier allows the algorithm to be, to some extent, less sensitive to poor initial clustering (Jain & Dubes 1988). Due to the heuristic nature of ISODATA, its effective implementation in a classification problem is highly dependent upon the analyst’s understanding of the controlling parameters in clustering problems. Like K-means, there is no guarantee that this algorithm can converge to a globally optimal clustering.
2.1.2.6 Summary
Using these traditional classification methods, abundant successful supervised and unsupervised remote sensing application examples have been reported (Cihlar et al. 1998; Thomson et al. 1998;Bruzzone et al. 1997; Guneriussen et al. 1997; Remund et al. 1998; Foody et al. 1995; Benediktsson et al. 1990; Belward et al. 1990).
In a supervised classification, a set of labeled training samples must be collected. Using the collected training data, the spectral signatures of classes are estimated and then used to classify other unknown pixels throughout the image. For this reason, the
29
training data may be very expensive and laborious in terms of time and economic cost. This drawback has limited the usability of supervised classification approaches and led us to explore the use of unsupervised methods. Unsupervised classification algorithms are to identify a set of clusters in the data with little supervision of the analyst. However, after clustering is completed, the analyst has to match the derived spectral classes to each of the desired land categories if the clustering purpose is to form a land cover map (Jensen 1996; Palylyk & Crown 1984). It is very likely that one general land category has large spectral variability and consists of many spectral classes (Lark 1995). The criteria that are used to match land categories with spectral classes will affect the accuracy of the
resulting land cover map.
30
2.2 Review on Simulated Annealing (SA) and Applications for Land Cover
Information Extraction using Remotely Sensed Data
2.2.1 Introduction
Simulated Annealing (SA), which is developed based on an analogy between the physical annealing process of solids and the problems of solving large combinatorial optimization problems, has shown to have the potential to find or approximate the global or near-global optimal in a combinatorial optimization problem (Aarts & Laarhoven 1987;Geman & Geman 1984). However, SA often requires much greater computational time. SA was first described by Metropolis et al. in 1953 and then introduced by Kirkpatrick et al. (1983) and Cerny (1985) into combinatorial optimization problems. The special characteristics of SA are its general applicability and simplicity of implementation. SA has been proven applicable in many classification applications (Brown & Huntley 1992; Selim & Alsultan 1991; McErlean et al. 1990; Klein & Dubes 1989). In section 2.2.2, the fundamental theory behind the SA algorithm is introduced. In section 2.2.3, the relationship between SA and clustering problems is established and the incorporation of SA into clustering problems is proposed to reduce the likelihood of traditional clustering methods to be trapped by local minima in the same section.
2.2.2 Fundamentals of Simulated Annealing
31
1) For a solid at a given temperature T, its current state i has energy
E
i.2) Perturb the solid by randomly selecting a particle of the solid and relocating it. The perturbation of the particle creates a new state j of the solid with energy
E
j.3) Calculate the energy difference, ∆E, before and after the perturbation. Our decision of accepting the new state j is made based on the criterion: if ∆E is less than or equal to 0, the new state j is accepted as the current state, otherwise, the state j is accepted with a probability that is given by
) exp(
T
k
B E ∆− --- (2.3)
where ∆E =
E
j−E
i, T denotes the temperature, andk
B is a constant calledthe Boltzmann constant.
4) Repeat 2) and 3) until a sufficient number of perturbations are applied and the thermal equilibrium at this temperature is reached.
The thermal equilibrium of a solid at a given temperature T is characterized by the
Boltzmann distribution (Toda et al. 1983). The Boltzmann distribution gives the
probability of the solid being in a state i with energy
E
i at the temperature T, and is givenby
{
}
− = = T T Z i Xk
E
p
B iT ( )exp
1
--- (2.4)
32
∑
− = i B i T T Zk
E
exp )( ---(2.5)
where the summation sums all possible states. Based on the Boltzmann distribution, the thermal equilibrium state of the solid denotes that the minimal energy state is reached at the given temperature T.
The Metropolis algorithm that was originally designed for the physical annealing of solids is adapted to solve combinatorial optimization problems based on two comparisons between them: 1) the generated sequences of states of the solid by perturbations corresponds to a sequence of combinatorial solutions, and 2) the resulting energy of each state of the solid corresponds to the cost or error function in the combinatorial optimization problem. The SA algorithm is composed of a number of iterations of Metropolis algorithm by starting the temperature T sufficiently high at the beginning and then cooling down gradually. At each given temperature T, a number of perturbations are performed and the thermal equilibrium is reached. Then the temperature is decreased to the next lower temperature in a given schedule. This process is called the cooling schedule.
Mathematically, the new state generation and the cooling process in SA can be modeled by Markov chains (Feller 1950). In SA, the generation of each new state j
depends only on the previous state i. The sequence of states can be represented by Markov chains that are described as a set of conditional probabilities
P
ij(k) for each pairof new and previous states (i, j). Let X(k) denotes the generate state of the kth
33
( )
k{
X k j X k i}
P
ij =Pr ( )= | ( −1)= --- (2.6)where
P
ij(k)is the conditional probability that the generated state of the kth perturbation34
2.2.3 General discussion of SA and unsupervised classification
Unsupervised classification, or ‘clustering’ is the search for optimal groupings, or clusters based on the similarities between patterns in terms of a distance measure such as Euclidean distance (Jain & Dubes 1988; Tou & Gonzales 1977). Clustering is one type of combinatorial optimization problem. Generally, clustering approaches classify input data by minimizing the distance function defined in Equation 2.2 to estimate the cluster centroids. K-means is one of the most popular clustering algorithms applied in remotely sensed applications The K-means clustering algorithm has been shown to be computationally efficient and to be able to produce good results if the clusters are compact, well-separated in the feature space, and hyperspherical in shape (Jain et al.
2000). However, the classical K-means algorithm suffers from the local minimum problem that prevents it from producing satisfactory classification in many occasions.
35
methods for data classification. SA is one of the most interesting of these methods. It is necessary to conduct some research to develop SA-based classification systems and test their applicability in LU/LC classification using remotely sensed data.
2.3 Review of Artificial Neural Networks Applications in Land cover
Classifications
2.3.1 Introduction
Artificial Neural networks (ANNs) originally emerged in 1940’s to simulate the behavior of the human nervous system. In late 1980’s and early 1990’s, ANNs were first used for remotely sensed data classification (Benediktsson et al. 1990; Key et al. 1989). Subsequently, a number of successful classification applications in remote sensing have been reported (Bruzzone et al. 1997; Foody & Arora 1997; Kanellopoulos & Wilkinson 1997; Paola & Schowengerdt 1997; Foody 1995; Bischoff et al. 1992; Heermann & Khazenie 1992).
ANNs are fundamentally network systems in which a large number of small and interconnected processors or neurons work together to solve difficult classification and optimization problems. ANN approaches have a distinct advantage over statistical classification methods in that they are non-parametric and require little a priori
36
In the following sections, two ANN neural network models in remote sensing are reviewed in section 2.3.2. In section 2.3.3, we present a review on multisource classification using neural networks. A general discussion and summary concerning neural network classification applications in remote sensing are given in section 2.3.4.
2.3.2 Popular ANN models in remotely sensed classification applications
A variety of ANN approaches have been found to be well-suited for a wide variety of LU/LC classification applications in remote sensing (Carpenter et al. 1997; Bishop1995; Bezdek et al. 1992; Benediktsson et al. 1990). Among them, two most popular network models in remote sensing, supervised Multilayer Perceptron network model (Rumelhart & McClelland 1986) and unsupervised Kohonen’s Self-Organizing Mapping neural network model (Kohonen 1982), are reviewed respectively in section 2.3.2.1 and 2.3.3.2.
2.3.2.1 Multilayer Perceptron (MLP) neural network model
37
Through the search, the resulting network is believed to be able to approximate the inherent input-output relation. Based on the minimization goal, the mean square error (MSE) J is used as a classification performance criterion given by
∑
== N
i i
N J
1 2
2 1
ε
--- (2.7)where N is the number of training patterns.
ε
2i is the Euclidean distance between thenetwork output of the pattern and the desired output.
38
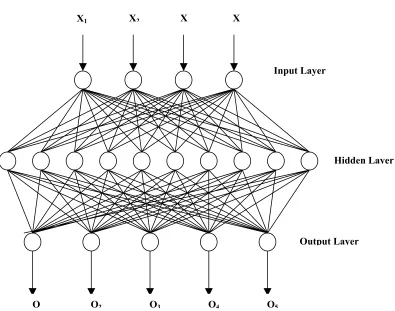
Figure 2. 1 The structure of a three-layer neural network with 4 input nodes, 10 hidden nodes and 5 output nodes
For each input pattern presented to the network, the current network output of the input pattern is computed as follows. First, the net input to any node j in the hidden or output layer is calculated from the nodes in the previous layer as follows:
(
w
x
)
b
net
jk
i ij i
j=
∑
+=1
--- (2.8)
where
w
ij is the weight linking the ith node in the previous layer and the jth node in thenext layer.
b
j is the bias term associated with this node andx
i is the output or activationO O2 O3 O4 O5
Input Layer
Hidden Layer
Output Layer
39
value of the ith node from the previous layer. Then, an activation sigmoid function, f, of the net value for each node j in hidden and output layers are calculated:
( )
e
net
net f j j − + = 1 1--- (2.9)
The outputs of the nodes in the hidden layer and the output layer depend on the inputs from previous layer, their activation function and the bias. In the next step, the outputs from the networks are compared with the desired outputs and the error or difference between them is then backpropagated to adjust the weights between layers based on the following generalized delta rule:
(
n)
w
( )
n( ) ( )
nx
nw
ij +1 = ij +ηδ
j i --- (2.10)where
w
ij(
n+1)
andw
ij( )
n are the weight at iteration n+1 and iteration n;n: iteration,
η is the learning rate,
x
i( )
n is the activation value at the ith node in the previous layer,
δ
j( )
n is the backpropagated error of the jth node in the current layer that isdefined as:
( )
O
(
O
)
w
ij ki i j j
j n
∑
=
− =
1
1
δ
δ
--- (2.11)where
O
jis the output of the jth node,
δ
i is the backpropagated error of the ith node in the previous layer,40
The generalized delta rule used to update the weights is computationally slow. Principe et al. (1999) suggest including a memory term (the past increment to the weight) to speed up and stabilize the BP learning. In this momentum learning, the generalized delta rule in Equation 2.10 is modified by taking incremental changes as follows:
(
n+1)
=w
( )
n +( ) ( )
nx
n + ∆w
(
n−1)
w
ij ij ηδ
j i α ij --- (2.12)where α is the momentum constant,
∆
w
ij(
n−1)
is the weight change from the previous iteration.Detailed implementation of MLPs is described by Principe et al. (1999). A number of studies have been performed to apply MLP neural networks to classify remotely sensed data (Kanellopoulos & Wilkinson 1997; Paola & Schowengerdt, 1997; Foody et al. 1995).
2.3.2.2 Kohonen’s Self-Organizing Mapping (KSOM) Neural Network Model
41
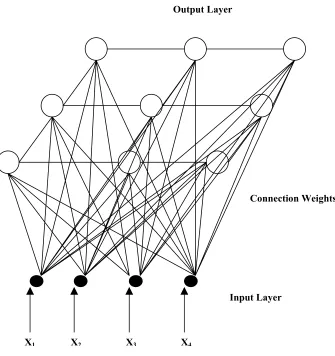
Figure 2. 2 The structure of a Kohonen’s Self-Organization Mapping Neural network with 4 input nodes and 9 output nodes
During the competitive learning, when an input pattern is presented to the KSOM network, the node in the competitive layer with a weight vector closest to the input vector in terms of Euclidean distance is declared as the ‘winning’ node. Only this winning node and the nodes in its neighborhood are allowed to update their weight vectors. It is the spatial neighborhood property that makes KSOM networks different from other competitive networks (Principe et al, 1999). Via the spatial neighborhood property, KSOM networks have the capability to preserve and reveal the inherent topological
X1 X2 X3 X4
Output Layer
Connection Weights
42
relationships in the input data. In remotely sensed classification applications, the topological relationships are demonstrated in a way that the pixels with similar spectral values are assigned to the neighboring output nodes in the competitive layer. The KSOM algorithm (Lippmann 1987; Chen et al. 1999) is described as below:
a) Initialize weights from n inputs to the k output nodes to the interval [0,1] randomly, and set the initial radius of neighborhood Ng(t). Select the iteration
limit for the algorithm, iteration_max.
b) Present new input pattern to network.
c) Compute the Euclidean distance
d
ij( )
t between the input pattern Xiand eachoutput node j using the equation as below
( )
( )
(
)
∑
= −
= n
i i ij
ij
x
tW
td
1
2
--- (2.13)
d) Select the output node with the minimal distance as the winning node.
e) Update the weights of the winning node and all the nodes within its neighborhood
( )
tW
( )
t
( )
t t(
x
( )
tW
( )
t)
W
ij +1 = ij+
N
g η( ) i − ij --- (2.14)where η
( )
t denotes the learning rate at the iteration t, which is usually decreasedas t increases, and Ng(t) the neighborhood radius at the iteration t.
f) Send the next input pattern to the input layer, and then go to step c) until all learning patterns are sent once.
43
h) Increment t by 1, and then go to step b) until t = iteration_max or the average distance between the input pattern and the winning node drops below a specific threshold.
The KSOM algorithm can be viewed as a neural network version of K-means. However, unsupervised KSOM approach has some important characteristics over K -means (Goncalves et al. 1998; Nour & Madey 1996):
Self-organizing and adaptive learning process
Preservation and revelation of inherent topological relationship among input data. Parallel architecture
In many previous studies, KSOM networks have been shown to be effective in remotely sensed classification applications (Babu 1997; Baraldi & Parmiggiani 1995; Bezdek et al. 1992). However, Bezdek et al. (1992) have demonstrated that the performance of the KSOM network model heavily depends on an optimal combination and initialization of the specified parameters.
2.3.3 Multisource image classification using artificial neural networks
44
mandatory to develop effective data fusion techniques to take advantage of the complimentary information from a variety of spatial data sets in multisource classification.
Multisource classifications using statistical methods and ANN approaches are a heavily studied topic in remote sensing (Paola & Schowengerdt 1997; Benediktsson et al.
1990; Benediktsson & Swain 1989). Based on our review, general statements with respect to these two types of fusion techniques are drawn as follows:
Traditional statistical methods such as maximum-likelihood and minimum-distance are generally incapable in multisource classification using remotely sensed data for two reasons: 1) the statistical distributions of multiple source data sets may significantly vary from both classes and data sources and thus are unlikely to be accurately estimated by a multivariate statistical model (Paola & Schowengerdt 1997), and 2) most traditional statistical methods do not have the capability to weight the data sources even though multiple data sources are not equally reliable (Benediktsson et al. 1990). Some advanced statistical methods have been developed and shown to be able to perform very well in multisource classification (Solberg et al. 1996). However, these statistical methods are very complicated requiring the derivation of a sufficiently accurate multivariate statistical model and the proper weighting and modeling of multiple data sources (Benediktsson et al. 1990).
45
approaches can extract sufficient information from the training data to approximate the inherent input-output relationships without the need to estimate statistical distribution models of multiple source data sets. Thus, ANN approaches have become particularly attractive for data fusion. Many studies have shown that ANN approaches have similar or superior classification performance to statistical methods in multisource classifications (Bruzzone et al. 1999; Serpico & Roli 1995; Benediktsson et al. 1990). However, their performance is sensitive to the quality and quantity of collected training data. They may fail to generalize well for those samples poorly represented in training set.
In recent years some hybrid methods have been investigated to combine statistical and neural network models (Bruzzone et al. 1999; Benediktsson & Kanellopoulos 1999; Benediktsson et al. 1997). These hybrid methods are generally very complicated and require analysts to have very good understanding of both the statistical and neural network models.
In summary, both the statistical and ANN techniques have their pros and cons. In practice, the analyst should be clearly aware of their limitations and makes a wise choice that is appropriate for their applications in terms of classification accuracy, feasibility, and cost.
46
that all the images are acquired at the same time, or there is no class change occurring during the time interval (Serpico & Roli 1995). However, this ideal condition is not always satisfied in practice. Significant class changes occurring during the period may cause a great deal of interpretation confusion and result in high misclassification error. The second factor is the effect of the geometrical co-registration of multiple images with different spatial, spectral, and projection systems into one common reference system. Dai and Khorram (1998) point out that the misregistration error has significant effects on multisource analysis such as data fusion and change detection. Large misregistration error may render the fused data useless for classification, even resulting in poorer classification accuracy than that using single remote sensing data.
2.3.4 General discussion and summary
The introduction of ANN is one of the most significant advancements in the field of image classification. Numerous studies have demonstrated that ANN approaches perform well over a range of traditional statistical methods (Carpenter et al. 1997; Foody