DECISION TREE CLASSIFICATION MODEL FOR LAND USE AND LAND COVER MAPPING
Prof. Dr. P.K. Srimani*
1
Professor &
2
Assistant Professor of Computer Science, Government Science College, Bangalore, India
ARTICLE INFO ABSTRACT
Decision Tree
mapping, few studies have already assessed the use of Decision Tree Classifiers. Decision Tree Classifiers have several advantages for remote sensing applications by virtue of
simple, explicit, and intuitive classification structure. In this paper, the Standard Decision Tree algorithms used for Land Cover and Land Use mapping was evaluated and compared using satellite data. Here multi
experimental data. Classification rules were derived from the spectral image using J48, BFTree, REPTree and Simple Cart algorithms with the same set of training samples. Classification done by using these rul
compared and evaluated based on True Positive, False Positive, Prediction Accuracy and Learning Time metrics. Among these, J48 performed the best in all aspects and had
97.34% and Kappa statistics of 0.9685. Further the Decision Tree classified image generated using the J48 algorithm based rules produced an overall accuracy of 87.11% and kappa of 0.8515.
INTRODUCTION
Image classification is one of the primary tasks on satellite images, that is being used to categorize for further analysis such as land management, potential mapping, forecast analysis and soil assessment etc. Image classification is a method by which labels or class identifiers are attached to individual pixels on the basis of their characteristics. These characteristics are generally measurements of their spectral response in various bands. Traditionally, classification tasks are based on statistical methodologies such as Minimum Distance-to-Mean, Maximum Likelihood and Mahalanobis Distance Classification (Mather and Paul,
classifiers are generally characterized by having an explicit underlying probability model, which provides a probability of being in each class rather than simply a classification. The performance of this type of classifier depends on how well data match the pre-defined model (Srimani and Nanditha, 2010). If the data are complex in structure, then to model the data in an appropriate way can become a real problem (Xu al., 2005, Tso and Mather, 2001). In order to overcome this problem, non-parametric classification techniques such as Artificial Neural Network (ANN) and Rule
are increasingly being used. Decision Tree classifiers have, however, not been used widely by the remote sensing community for land use classification despite their non parametric nature and their attractive properties of simplicity,
*Corresponding author:[email protected]
ISSN: 0975-833X
Article History:
Received 28th February, 2012
Received in revised form
17th March, 2012
Accepted 28th April, 2012
Published online 30th May, 2012
Key words: Remote Sensing, Image Classification, Decision Tree,
Land cover and Land Use, Accuracy.
RESEARCH ARTICLE
DECISION TREE CLASSIFICATION MODEL FOR LAND USE AND LAND COVER MAPPING
A CASE STUDY
Prof. Dr. P.K. Srimani*
1and Smt. Nanditha Prasad*
Professor & Director, R&D (CS), BU, DSI, Bangalore, India
Assistant Professor of Computer Science, Government Science College, Bangalore, India
ABSTRACT
Decision Tree classification algorithms have significant potential for land cover and land use mapping, few studies have already assessed the use of Decision Tree Classifiers. Decision Tree Classifiers have several advantages for remote sensing applications by virtue of
simple, explicit, and intuitive classification structure. In this paper, the Standard Decision Tree algorithms used for Land Cover and Land Use mapping was evaluated and compared using satellite data. Here multi-spectral IRS-1D/LISS III image of Heggadadevanakote
experimental data. Classification rules were derived from the spectral image using J48, BFTree, REPTree and Simple Cart algorithms with the same set of training samples. Classification done by using these rules is known as knowledge based classification and the results of these classifiers were compared and evaluated based on True Positive, False Positive, Prediction Accuracy and Learning Time metrics. Among these, J48 performed the best in all aspects and had
97.34% and Kappa statistics of 0.9685. Further the Decision Tree classified image generated using the J48 algorithm based rules produced an overall accuracy of 87.11% and kappa of 0.8515.
Copy Right, IJCR, 2012, Academic
Image classification is one of the primary tasks on satellite images, that is being used to categorize for further analysis such as land management, potential mapping, forecast analysis and soil assessment etc. Image classification is a method by els or class identifiers are attached to individual pixels on the basis of their characteristics. These characteristics are generally measurements of their spectral response in various bands. Traditionally, classification tasks hodologies such as Minimum Mean, Maximum Likelihood and Mahalanobis and Paul, 1987). These classifiers are generally characterized by having an explicit underlying probability model, which provides a probability of being in each class rather than simply a classification. The performance of this type of classifier depends on how well the defined model (Srimani and Nanditha, 2010). If the data are complex in structure, then to model the data in an appropriate way can become a real problem (Xu et Mather, 2001). In order to overcome this parametric classification techniques such as Artificial Neural Network (ANN) and Rule-based classifiers are increasingly being used. Decision Tree classifiers have, however, not been used widely by the remote sensing despite their non-parametric nature and their attractive properties of simplicity,
flexibility, and computational efficiency in handling the non normal, non-homogeneous and noisy data, as well as non linear relations between features and classes, missing values, and both numeric and categorical inputs (Pal
2003, Friedl andBrodley, 1997). The objective of this study was to evaluate the use of decision tree algorithms for classifying land cover and land use on the chosen area. In this paper, we evaluated the performance of a set of decision tree classifier algorithms namely J48
Simple cart on the same training sample (
Based on the performance criteria and evaluation results, classification rules generated from the best algorithm for Land use and land cover classification over the LISS
implemented using Expert Classifier to obtain the classified image of the study area. Further accuracy assessment was performed over the classified image to evaluate the results (Congalton,1991). Although some work is available in this direction, no work is available is with regard to present topic.
STUDY AREA
The study area was Heggadadevanakote
district of Karnataka state in India with Latitude 12°5'23"N and Longitude 76°19'47"E. It has four reservoirs viz., the Kabini, Nugu, Hebbala and Taraka reservoirs. The agriculture in this taluk is rain-fed and irrigated. Major crops of
are cotton, grams, groundnut, jowar, maize, ragi, rice, sugarcane and sunflower.
International Journal of Current Research
Vol. 4, Issue, 05, pp.177-181, May,2012
INTERNATIONAL
DECISION TREE CLASSIFICATION MODEL FOR LAND USE AND LAND COVER MAPPING-
and Smt. Nanditha Prasad*
2D (CS), BU, DSI, Bangalore, India
Assistant Professor of Computer Science, Government Science College, Bangalore, India
classification algorithms have significant potential for land cover and land use mapping, few studies have already assessed the use of Decision Tree Classifiers. Decision Tree Classifiers have several advantages for remote sensing applications by virtue of their relatively simple, explicit, and intuitive classification structure. In this paper, the Standard Decision Tree algorithms used for Land Cover and Land Use mapping was evaluated and compared using satellite Heggadadevanakote taluk was used as an experimental data. Classification rules were derived from the spectral image using J48, BFTree, REPTree and Simple Cart algorithms with the same set of training samples. Classification done by es is known as knowledge based classification and the results of these classifiers were compared and evaluated based on True Positive, False Positive, Prediction Accuracy and Learning Time metrics. Among these, J48 performed the best in all aspects and had a Prediction accuracy of 97.34% and Kappa statistics of 0.9685. Further the Decision Tree classified image generated using the J48 algorithm based rules produced an overall accuracy of 87.11% and kappa of 0.8515.
, Academic Journals. All rights reserved.
flexibility, and computational efficiency in handling the homogeneous and noisy data, as well as non-linear relations between features and classes, missing values, and both numeric and categorical inputs (Pal and Mather, odley, 1997). The objective of this study was to evaluate the use of decision tree algorithms for classifying land cover and land use on the chosen area. In this paper, we evaluated the performance of a set of decision tree classifier algorithms namely J48, BFtree, REPTree, and Simple cart on the same training sample (DeFries et al., 2000). Based on the performance criteria and evaluation results, classification rules generated from the best algorithm for Land use and land cover classification over the LISS-III image were implemented using Expert Classifier to obtain the classified image of the study area. Further accuracy assessment was performed over the classified image to evaluate the results 1991). Although some work is available in this ction, no work is available is with regard to present topic.
Heggadadevanakote taluk in Mysore district of Karnataka state in India with Latitude 12°5'23"N Longitude 76°19'47"E. It has four reservoirs viz., the Kabini, Nugu, Hebbala and Taraka reservoirs. The agriculture fed and irrigated. Major crops of the region cotton, grams, groundnut, jowar, maize, ragi, rice,
MATERIALS AND METHODS
The IRS-ID LISS III image of the above area for February 2005 with a spatial resolution of 23.5m was used for the study. A false color composite (FCC) image was generated using the 3, 2, 1 bands of the satellite data.
[image:2.595.49.275.156.395.2] The survey of India (SOI) toposheets 58A-1/5/9 and 57D-4/8/12 of 1:50000 scales, was used as reference data.
Fig. 1. LISS-III Image of H.D Kote
DECISION TREE CLASSIFIERS
Decision tree classifier, a machine learning algorithm, is a knowledge based data mining technique. It is an efficient tool for land cover and land use classification. It is a hierarchal top-down approach, in which the decision rules are defined by a combination of several features, and a set of linear discriminate functions are applied at each test node, where a binary decision is made for splitting a complex decision into several simpler decisions so as to separate either one class or some of the classes from the remaining classes (Yang et al., 2003, Safavian and Landgrebe, 1991). In this approach, the feature of data is a predictor variable (a variable analogous to the independent variable in linear regression and used for predicting the value of the target variable) whereas the class to be mapped is referred to as target variable. It performs binary recursive partitioning to allocate automatically the maximum information carrying feature for the classification and discards the remaining features at that transitional stage, thereby increasing the computational efficiency (Pal et al., 2003, Pal et al., 2002).
J48 (C4.5 Decision Tree Revision 8)
J48 algorithm is the Weka implementation of the C4.5 top-down decision tree learner proposed by Quinlan. The algorithm uses the greedy technique and is a variant of ID3, which determines at each step the most predictive attribute, and splits a node based on this attribute. Each node represents a decision point over the value of some attribute (Pal and Mather, 2002). J48 attempts to account for noise and missing data. It also deals with numeric attributes by determining
where the position for the placement of thresholds for decision splits. The main parameters that can be set for this algorithm are the confidence threshold, the minimum number of instances per leaf and the number of folds for reduced error pruning (DeFries et al., 2006, Quinlan, 1992).
Best First Tree
BFTree is a best-first decision tree learner and it is a learning algorithm for supervised classification learning. Best-first decision trees represent an alternative approach to standard decision tree techniques such as the C4.5 algorithm since they expand nodes in the best-first order instead of a fixed depth-first order. A method used in the BFT (Best-First Tree) algorithm adds the best split node to the tree in each step. The best node is the node that maximally reduces the impurity among all nodes available for splitting (i.e. not labeled as terminal nodes) (Shi, 2007) (Sam and Matt).
Reduced Error Pruning Tree
REPTree is a simple and a fast decision tree learner. It builds a decision/regression tree using the information gain/variance and the prunes used for obtaining reduced-error pruning (with back-fitting). The algorithm only sorts values for numeric attributes once. Missing values are dealt with by splitting the corresponding instances into pieces (Sam and Matt, Witten and Frank, 2005).
Simple Cart
The CART (Classification and Regression Trees) algorithm was proposed by Breiman et al. A CART tree is a binary decision tree that is constructed by splitting a node into two child nodes repeatedly. A set of observations and associated variables are given. The algorithm finds a way of using variables to partition the observations into homogeneously distributed groups, and use the groups to predict observations (Sam and Matt, Friedl and Brodley, 1997).
generated. The same was verified against the corresponding toposheet. The reference values were recorded in the Accuracy Assessment table. From the error matrix, Overall accuracy and Kappa values were computed by using the user’s accuracy and producers’ accuracy for each class.
RESULTS
Performance Criteria
In this section, Decision tree classifiers namely J48, BFtree, REPTree and Simplecart were evaluated on 2253 samples of training data. To compare the classifiers, TP (True positive), FP (False Positive), Prediction Accuracy and learning time to build the model in seconds for each algorithm were considered. These parameters shown in Table 1 were the most important criteria for considering the best algorithm for classifying the land cover and land use of the considered image. The Prediction Accuracy of the Classifiers was evaluated using 10-fold Cross Validation. Table 1 shows the Evaluation criteria for Decision rules. Besides, it is very important to record Prediction Accuracy (PA Accuracy = Total correctly classified instances/Total instances) * 100) for each algorithm. From Table 1, it was observed that J48 took 1.69 seconds to build the model for Decision Trees. In the selection process, any algorithm is disqualified if it’s PA is too low, despite its outstanding performance in classifying one or more land cover and land use classes. Here two points are to be noted viz., (i) J48 classifier will be considered as the best classifier if the TTBM is not taken into the consideration and (ii) REPTree will be best classifier if the criteria of TTBM|opt
is considered.
Results for Decision Tree Classifier Algorithms
The J48 Classifier achieved the highest Prediction Accuracy of 97.33% in 1.69 secs with 2193 Correctly Classified Instances as shown in Table 1. BFTree had the next highest accuracy result of 96.84% in 0.94 secs among the other Decision trees. REPTree had achieved 94.67% in 0.14 secs and simple cart, 96.13% accuracy in 1.45 secs. BFTree shows the next higher Correctly Classified Instances. The accuracy rate of REPTree classifier was the lowest among the four Tree classifiers. A total of 80 rules was generated by J48 Decision Tree classifier.
Results of J48 Decision Tree Classified Image
Using ERDAS 9.2 knowledge Engineer tool, a knowledge base was created using J48 generated classification rules over
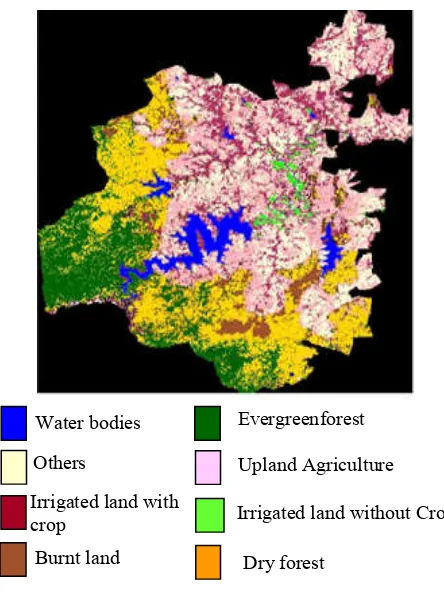
[image:3.595.320.542.118.418.2]the LISS-III image to obtain the decision tree classified image. Figure 2 is the classified image obtained by applying Decision Tree classifier method. Accuracy assessment was carried out over the classified image which resulted in Overall accuracy of 87.11% and kappa of 0.8515
Fig. 2. Classified Image using J48 DTC
Overall Classification Accuracy = 87.11% Overall Kappa Statistics = 0.8515
As shown in Table 2, DTC did not provide satisfactory results in distinguishing Evergreen forest and Irrigated land with crops due to the overlapping of spectral values. However accuracy for Others as well as Upland-agriculture was relatively less because of similar scattering mechanism. Classes with uniform distribution like water bodies, dry forest and burnt land were classified correctly. All the presented results as indicated in Table 3 are above 80% accuracy except the user’s accuracy on Irrigated land without crop (78.57) and
Table1: Evaluation Criteria for Decision Tree Algorithms
Evaluation criteria
Decision Trees classifiers
J48 BF Tree Rep Tree Simple Cart
Time Taken for Building Model (Secs)
1.69 0.94 0.14 1.45
Correctly Classified Instances
2193 2182 2133 2166
Incorrectly Classified Instances
60 71 120 87
Rules Generated
80 108 89 61
Prediction Accuracy
97.33 96.84 94.67 96.13
Water bodies Evergreenforest
Others
Irrigated land with crop
Burnt land
Upland Agriculture
Dry forest
[image:3.595.39.279.441.587.2]Irrigated land without Crop
Table 2. Error Matrix for J48 Decision Tree Classifier
Class Description
Wate
r bodies
Burnt la
nd
Ir
ri
gated
land
withou
t
Crop Ever
g
reen
for
es
t
Dry forest Others Upland
agricult
ure
Ir
ri
gated
land
with
Crop Re
ference
Tot
al
Water bodies 22 0 1 0 0 0 0 0 23
Burnt land 0 19 0 0 1 0 0 0 20
Irrigated Land without Crop
2 0 22 0 0 0 2 2 28
Evergreen forest 0 2 0 32 0 0 0 1 35
Dry forest 0 0 0 2 41 2 0 0 45
Others 0 1 0 0 0 30 4 1 36
Upland Agriculture
0 0 0 0 0 3 35 2 40
Irrigated Land with Crop
0 0 2 2 0 2 1 22 29
Irrigated land with crop (75.86%). The overall accuracy is up to 87.11%. Table 4, indicates Kappa statistics for each class. Based on the above analysis, it can be concluded that this DTC model can fit in an excellent manner the requirement of classifying Land Cover and Land Use mapping of the considered image.
CONCLUSION
Decision tree classifiers can perform automatic feature selection and complexity reduction, while the tree structure gives easily understandable and interpretable information regarding the predictive or generalization ability of the data. DTC computational time is minimal. Some of the popular machine learning Decision tree classifiers were presented in this paper for land cover and land use classification. This classification scheme was applied here to LISS-III data. Eight classes were identified: Irrigated land without crop, Irrigated land with crop, Burntland, Dryforest, Evergreen forest, Upland-agriculture, Waterbodies and Others. Each class was categorized with its own set of classification rules due to its specific scattering behaviour. The results predicted good classification accuracy for each class. The Prediction accuracy of the Classifiers was evaluated using 10-fold Cross Validation. The highest accuracy was obtained by applying the J48 decision tree algorithm with a user-defined training set. In addition, the classifiers were compared based on True Positive, False Positive, Prediction Accuracy and Learning Time metrics. J48 performed better in all metrics and had a prediction accuracy of 97.34 and Kappa statistics as 0.9685
The Decision tree classified image, indicated an Overall Accuracy of 87.11% and Kappa statistics as 0.8515. The study indicated that Decision Tree could provide accurate and efficient methodology for classification of Land use and Land cover mapping by using remote sensing data.
REFERENCES
1. Mather, Paul, M, 1987, Computer Processing of Remotely-Sensed Images, St Edmundsbury Press Ltd., Bury St Edmunds, Suffolk, Wiley and Sons, ISBN: 0471-90648-4.
2. Xu .M, P. Watanachaturaporn, P. K. Varshney, and M. K. Arora, 2005, Decision tree regression for soft classification of remote sensing data, Remote Sensing of Environment, vol. 97, pp. 322-336.
3. Tso. B and P. M. Mather, 2001, Classification Methods forRemotely Sensed Data. London and New York: Taylor & Francis New York.
4. Pal. M and P. M. Mather, 2003, An assessment of the effectiveness of decision tree methods for land cover classification, Remote Sensing of Environment, vol. 86, pp.554-565.
5. Friedl M. A. and C. E. Brodley, 1997, Decision tree classification of land cover from remotely sensed data, Remote Sensing of Environment, vol. 61, pp. 399-409. 6. DeFries. R., Cheung-Wai Chan, J., 2000. Multiple
Criteria for Evaluating Machine Learning Algorithms for Land Cover Classification from Satellite Data. Remote Sensing of Environment, 74: 503-515
7. Congalton. R G., 1991, A review of assessing accuracy of classification of remotely sensed data, Remote sensing Environment, 37,35-46.
8. Pal. M and P. M. Mather , 2002, A comparison of Decision Tree and Back Propogation Neural Network Classifiers for Land Use Classification, Geo Science and remote Sensing Symposium, IEEE International proceedings, Vol–I pp 503-505.
9. Quinlan. J., 1992, C4.5: Programs for Machine Learning Morgan Kaufmann.
[image:4.595.163.421.77.230.2]10. Shi. H, 2007, Best-first decision tree learning.
Table 3. Accuracy Table for J48 Decision Tree Classifier
Class Names Refere
nce Total
Classif ied Total
Number of Correctly Classified
Producers Accuracy
Users Accura cy
Water bodies 24 23 22 91.67 95.65
Burnt land 22 20 19 82.36 95.00
Irrigated Land without Crop
25 28 22 88.0 78.57
Evergreen forest
36 35 32 88.00 91.43
Dry forest 42 45 41 97.62 91.11
Others 37 36 30 81.08 83.33
Upland Agriculture
42 40 35 83.33 87.50
Irrigated Land with Crop
28 29 22 78.57 75.86
Total 256 256 223
Table 4 : Conditional Kappa for Each Class
Class names Kappa
Water Bodies 0.9520
Burnt land 0.9453
Irrigated land without Crop 0.7625
Evergreen forest 0.9003
Dryforest 0.8937
Others 0.8052
Upland Agriculture 0.8505
Irrigated land with Crop 0.7290
[image:4.595.186.395.253.343.2]11. Sam Drazin and Matt Montang, Decision Tree Analysis using WEKA, University of Maimi.
12. Witten. I.; Frank, E. 2005. Data Mining: Practical Machine Learning; Tools and Techniques. 2ed. Morgan Kaufmann, Burlington, MA, USA.
13. P. K. Srimani and Nanditha Prasad, 2010, Analysis and evaluation of classifiers using multi-temporal images in land use and land cover mapping, ACM, ISBN 978-1-4503-0194-7, A2CWiC.
14. C.C. Yang, S. O. Prasher, P. Enright, C. Madramootoo, M. Burgess, P. K. Goel, and I. Callum, 2003, Application of decision tree technology for image classification using remote sensing data, Agricultural Systems, vol. 76, pp. 1101-1117.
15. R.S. Safavian, and D. Landgrebe, 1991, A survey of decision tree classifier methodology, IEEE Transacations of Systems, Man, and Cybernetics, vol. 21, 660-675.