University of Windsor University of Windsor
Scholarship at UWindsor
Scholarship at UWindsor
Electronic Theses and Dissertations Theses, Dissertations, and Major Papers
3-10-2019
Classification of Wind Turbine Blade Performance State Through
Classification of Wind Turbine Blade Performance State Through
Statistical Methods
Statistical Methods
Jones Shen
University of Windsor
Follow this and additional works at: https://scholar.uwindsor.ca/etd
Recommended Citation Recommended Citation
Shen, Jones, "Classification of Wind Turbine Blade Performance State Through Statistical Methods" (2019). Electronic Theses and Dissertations. 7657.
https://scholar.uwindsor.ca/etd/7657
This online database contains the full-text of PhD dissertations and Masters’ theses of University of Windsor students from 1954 forward. These documents are made available for personal study and research purposes only, in accordance with the Canadian Copyright Act and the Creative Commons license—CC BY-NC-ND (Attribution, Non-Commercial, No Derivative Works). Under this license, works must always be attributed to the copyright holder (original author), cannot be used for any commercial purposes, and may not be altered. Any other use would require the permission of the copyright holder. Students may inquire about withdrawing their dissertation and/or thesis from this database. For additional inquiries, please contact the repository administrator via email
Classification of Wind Turbine Blade Performance
State Through Statistical Methods
By
Jones Shen
A Thesis
Submitted to the Faculty of Graduate Studies
through the Department of Mechanical, Automotive and Materials Engineering
in Partial Fulfilment of the Requirements for
the Degree of Master of Applied Science at the University of Windsor
Windsor, Ontario, Canada
January 18, 2019
Classification of Wind Turbine Blade Performance
State Through Statistical Methods
By
Jones Shen
APPROVED BY:
______________________________________________ T. Bolisetti
Department of Civil and Environmental Engineering
______________________________________________ B-A. Schuelke-Leech
Department of Mechanical, Automotive & Materials Engineering
______________________________________________ R. Carriveau, Co-Advisor
Department of Civil and Environmental Engineering
______________________________________________ D. S-K. Ting, Co-Advisor
iii
DECLARATION OF CO-AUTHORSHIP/PREVIOUS PUBLICATIONS
I hereby declare that this thesis incorporates material that is the result of joint research, as
follows:
Thesis Chapter Details
Chapter 2 This thesis also incorporates the outcome of a joint research undertaken in collaboration with Ryan Francis under the supervision of Dr. Lindsay Miller, Dr. Rupp Carriveau, Dr. David S-K. Ting, Dr. Marianne Rodgers, and Mr. J.J. Davis. In all cases, the key ideas, primary contributions, data analysis and interpretation, were performed by the author, and the
contribution of the co-author and Ms. Carina Xue Luo (Leddy Library, University of Windsor) was primarily through the provision of data processing.
Chapter 3 This thesis also incorporates the outcome of a joint research undertaken in collaboration with Milad Rezamand under the supervision of Dr. Rupp Carriveau, Dr. David S-K. Ting, Mr. J.J. Davis, and Dr. Marianne Rodgers. In all cases, the key ideas, primary contributions, data analysis and
interpretation, were performed by the author, and the contribution of the co-author was primarily through the provision of proposing the experimental methodology.
I am aware of the University of Windsor Senate Policy on Authorship and I certify that I
have properly acknowledged the contribution of other researchers to my thesis, and have obtained
written permission from each of the co-author(s) to include the above material(s) in my thesis.
I certify that, with the above qualification, this thesis, and the research to which it refers,
is the product of my own work.
This thesis includes an original paper that has been previously submitted for publication in
peer reviewed journals, as follows:
Thesis Chapter Publication Publication Status
Chapter 2 Jones Shen, Ryan Francis, Lindsay Miller, Rupp Carriveau, David S.K. Ting, Marianne Rodgers, and J.J. Davis, “GIS Visualization of Wind Farm
Operational Data to Inform Maintenance and Planning Discussions,” Wind Engineering
iv
Thesis Chapter Publication Publication Status
Chapter 3 Jones Shen, Milad Rezamand, Rupp Carriveau, David S.K. Ting, J.J. Davis, and Marianne Rodgers, “Improved Condition Monitoring of Wind Turbine Blades through Unsupervised Machine Learning,” Wind Engineering
Submitted
Chapter 4 Jones Shen, Rupp Carriveau, David S.K. Ting, “Condition Monitoring of Wind Turbine Blades through k-means Clustering,” Journal of Solar Energy Engineering
Submitted
I certify that I have obtained a written permission from the copyright owner(s) to include
the above submitted material(s) in my thesis. I certify that the above material describes work
completed during my registration as a graduate student at the University of Windsor.
I certify that, to the best of my knowledge, my thesis does not infringe upon anyone’s
copyright nor violate any proprietary rights and that any ideas, techniques, quotations, or any other
material from the work of other people included in my thesis, published or otherwise, are fully
acknowledged in accordance with the standard referencing practices. Furthermore, to the extent
that I have included copyrighted material iv that surpasses the bounds of fair dealing within the
meaning of the Canada Copyright Act, I certify that I have obtained a written permission from the
copyright owner(s) to include such material(s) in my thesis and have included copies of such
copyright clearances to my appendix.
I declare that this is a true copy of my thesis, including any final revisions, as approved by
my thesis committee and the Graduate Studies office, and that this thesis has not been submitted
v ABSTRACT
As wind turbines continue to age, wind farm operators face the challenge of optimizing
maintenance scheduling to reduce the associated operation and maintenance (O&M) costs. Wind
farm operators typically use conservative maintenance scheduling in order to maximize the uptime
of their wind turbines. In most cases however, maintenance may not be necessary and the
components could operate for longer before repairs are required. This work presents three papers
that collectively focus on providing potentially useful information to aid wind farm operators in
making maintenance decisions. In the first paper, the utilization of Geographic Information
Systems (GIS) to illustrate data trends across wind farms is introduced to better understand an operation’s signature performance characteristics. It is followed by a paper that presents an
improved condition monitoring system for the wind turbine blades through the use of the principal
component analysis (PCA). The final paper introduces another condition monitoring system using
vi DEDICATION
vii
ACKNOWLEDGEMENTS
I would like to acknowledge the guidance, wisdom, and patience provided by my
co-advisors, Dr. Rupp Carriveau, and Dr. David S-K Ting. The support they’ve provided these past
two years have been essential in my personal development. I have truly enjoyed working with
them in the Turbulence & Energy Laboratory, and I have found them to be accommodating and knowledgeable whenever I’ve sought their insight. I also wish to extend thanks to the remaining
members of my committee, Dr. Tirupati Bolisetti and Dr. Beth-Anne Schuelke-Leech, for offering
their expertise on my research. I would like to acknowledge the contributions of Mr. Ryan Francis,
Ms. Carina Luo, Dr. Lindsay Miller who was of great help with the GIS process discussed in
Chapter 2. Additionally, I would like to thank Mr. Milad Rezamand for his contributions to Chapter
3. This research would not be possible without the generous support from our industrial partners,
and I wish to thank Mr. J.J. Davis, Dr. Marianne Rodgers, Mr. John Bridges for their efforts.
This work is part of the YR21 Investment Decision Support Program supported by
progressive industrial partners, the Natural Sciences and Engineering Research Council of Canada
viii
TABLE OF CONTENTS
DECLARATION OF CO-AUTHORSHIP/PREVIOUS PUBLICATIONS ... iii
ABSTRACT ... v
DEDICATION ... vi
ACKNOWLEDGEMENTS ... vii
LIST OF TABLES ... x
LIST OF FIGURES ... xi
CHAPTER 1 ... 1
Introduction ... 1
1. Background ... 1
2. Methodology ... 3
References ... 6
CHAPTER 2 ... 9
GIS Visualization of Wind Farm Operational Data to Inform Maintenance and Planning Discussions ... 9
1. Introduction ... 9
2. Methodology ... 12
3. Results and Discussion ... 15
3.1. Ranking and Mapping of SCADA data ... 15
3.2. Utility of GIS Visualizations ... 19
4. Conclusion and areas for future research ... 20
Acknowledgement ... 22
References ... 22
CHAPTER 3 ... 25
Improved Condition Monitoring of Wind Turbine Blades through Unsupervised Machine Learning ... 25
1. Introduction ... 25
2. Methodology ... 28
3. Results and Discussion ... 35
ix
Acknowledgement ... 43
References ... 44
CHAPTER 4 ... 47
Condition Monitoring of Wind Turbine Blades through k-means Clustering ... 47
1. Introduction ... 47
2. Methodology ... 50
3. Results and Discussion ... 54
4. Conclusion and areas for future research ... 60
Acknowledgement ... 61
References ... 61
CHAPTER 5 ... 65
Conclusions and Recommendations ... 65
1. Summary and Conclusions ... 65
2. Recommendations ... 67
x
LIST OF TABLES
CHAPTER 2: GIS Visualization of Wind Farm Operational Data to Inform Maintenance
and Planning Discussions
Table 2. 1: Wind farm characteristics ... 13
CHAPTER 3: Improved Condition Monitoring of Wind Turbine Blades through
Unsupervised Machine Learning
Table 3. 1: Wind farm characteristics. ... 28
Table 3. 2: SCADA data variables of interest... 29
CHAPTER 4: Condition Monitoring of Wind Turbine Blades through k-means Clustering
Table 4. 1: Wind farm characteristics. ... 50
Table 4. 2: SCADA data variables of interest... 51
xi
LIST OF FIGURES
CHAPTER 1: Introduction
Figure 1. 1: A condition monitoring system’s breakdown to determine the performance state of
blades ... 4
CHAPTER 2: GIS Visualization of Wind Farm Operational Data to Inform Maintenance and Planning Discussions Figure 2. 1: Ranking methodology. ... 12
Figure 2. 2: Wind rose for (a) wind farm 1, (b) wind farm 2, and (c) wind farm 3 measured by on-site meteorological mast. ... 13
Figure 2. 3: Ranking of wind speed and select SCADA variables (from highest to lowest) for select turbines at farm 1. ... 15
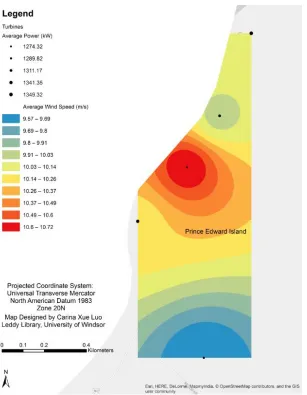
Figure 2. 4: Average wind speed and average power produced forwind farm 1. ... 16
Figure 2. 5: Average wind speed and average power produced for wind farm 2. ... 17
Figure 2. 6: Average wind speed and average power produced for wind farm 3. ... 18
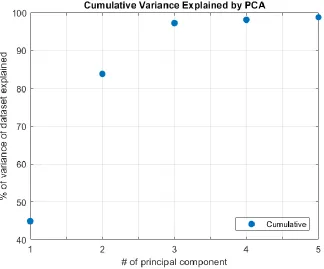
CHAPTER 3: Improved Condition Monitoring of Wind Turbine Blades through Unsupervised Machine Learning Figure 3. 1: Percentage of initial input dataset explained with each additional principal component. ... 36
Figure 3. 2: First and second principal components for each of the 88 wind turbines are plotted against each other. ... 37
xii
Figure 3. 4: The path that the blades of wind turbines (a) 38, (b) 78, (c) 1, and (d) 68 take
respectively from the start of the dataset to the end. ... 39
Figure 3. 5: Power curve comparison for wind turbine 1. ... 40
Figure 3. 6: The path taken by wind turbine 66 that appears to be operating normally, but repairs
were still performed. ... 41
Figure 3. 7: The path taken by wind turbine 17 blades before and after repairs were performed. 42
CHAPTER 4: Condition Monitoring of Wind Turbine Blades through k-means Clustering
Figure 4. 1: Clustering results from monitoring blade SCADA parameters with rotor speed and
blade pitch shown. ... 56
Figure 4. 2: Clustering results from monitoring blade SCADA parameters with wind speed and
power shown. ... 56
Figure 4. 3: Assigned clusters for each day for the first 260 days of the dataset for wind turbine
38... 57
Figure 4. 4: Assigned clusters for each day for the first 260 days of the dataset for wind turbine
47... 58
Figure 4. 5: Assigned clusters for each day for the first 260 days of the dataset for wind turbine
42 with a 50-day moving window. ... 58
Figure 4. 6: Assigned clusters for each day for the first 260 days of the dataset for wind turbine
1 CHAPTER 1
Introduction
1. Background
The global prospects for wind energy technology are very promising. The wind turbine
market is rapidly advancing in terms of technology, increased power production, and decreased
costs [1]. The annual Wind Technologies Market Report released for 2017 by the U.S. Department
of Energy (DOE) highlighted that wind energy will continue to be a competitively priced source
of energy and one of the most economic means of electricity generation [1]. Beyond economics,
wind energy operation has practically zero carbon and water footprint. That said, the major
challenge of reducing operation and maintenance (O&M) costs is ongoing. O&M costs for onshore
and offshore wind turbines account for ~15% and ~35% of their total costs respectively [2], [3].
Due to the continuous aging of wind turbines, wind farm operators face the challenge of
optimizing maintenance scheduling to reduce operating costs. Wind farm operators typically use
conservative maintenance scheduling to maximize the uptime of their wind turbines. In some
cases, however, maintenance may not be necessary, and the components could operate for longer
before repairs are required. Equipping components within the turbine with specialized and invasive
sensors that directly report on structural health can be prohibitively expensive for wind farms.
Thus, the use of abundant and readily available supervisory control and data acquisition (SCADA)
data is appealing to increase the understanding of wind turbines and their components throughout
their operation. A more thorough understanding of the change in behaviour of the turbine
components can aid wind farm operators in making informed maintenance decisions.
2
• To create a simplified method for wind farm operational data analysis for improved understanding of turbine behaviour to aid in maintenance and planning discussions
• To understand the changes in wind turbine blade condition and behaviour throughout its operation by highlighting a method to infer when maintenance is required, and
• To interpret the changes in wind turbine blade condition and behaviour during operation and to determine when maintenance is required by using an alternative method that
addresses weaknesses seen in objective 2.
A survey of available literature shows endless results for methods for analyzing wind farm
operations data to characterize specific component health and conditioning. However, a number
of these studies have been performed using more elaborate techniques ranging from neural
networks to Bayesian estimation and other fuzzy methods to predict turbine component
conditioning, performance, and their remaining useful life (RUL) [4–9]. These techniques tend to
require specialized training or programs that are not easily implemented by owners and operators
of wind turbines. For these reasons, a simplified process that can also be complementary to
pre-existing methods may be valuable to the industry.
Although complicated, the aforementioned methods have proven to be successful in
determining component behaviours to diagnose their operational health. Specifically, condition
monitoring system methods typically use sensors for oil monitoring and vibration analysis to
determine component health [10–12]. Their success is likely in no small part due to the value of
the data provided by direct sensors. However, most wind farm blade populations lack the level of
detailed and direct structural performance data provided by the types of specialized sensors. Wind
turbine blades have been illustrated by Ciang et al [13] and Nivedh [14] that blade failures were
3
analysis methods, in general, have gained significant attention, publications that have applied these
methods to wind turbine blades successfully are very rare [9].
These publications show the extent in which general condition monitoring systems based
on elaborate neural network and fuzzy have been applied to. As the wind turbines continue to
advance, higher reliability targets are emphasized which would require reduced O&M costs to
remain sustainable. Higher reliability with lower operational costs will result in increases of
incentives for investment in clean wind energy. This thesis attempts to address the issue of the
operational state of wind turbine blades through the utilization of readily available SCADA data.
It studies the application of a simplified geographic information (GIS) visualization method, an
unsupervised learning method, specifically principal component analysis (PCA), and a k-means
clustering algorithm to improve on condition monitoring by identifying the blade performance
state to determine whether maintenance is necessary. While the PCA and k-means methods have
been applied in many wind turbine components such as generators and gearbox subcomponents,
such techniques have yet to be applied to turbine blades.
2. Methodology
In order to create a condition monitoring system for turbine blades, its main functions
should first be established. Figure 1 shows a breakdown for determining the performance state of
wind turbine blades using a typical condition monitor. The process is broken down into 2 main
sections: conditioning prediction and blade failure modes. The conditioning prediction consists of
forecasting specific faults before they occur for the blades as well as predicting its remaining useful
life. This section requires very specific failure data which was not available at the time of this
study within the selected wind farms so these processes will not be covered within this thesis. The
4
causes can include damaged blades or varying wind and environmental characteristics within the
wind farms. Chapter 2 focuses on the examination of varying wind characteristics when compared
with performance metrics within wind farms using a simplified ranking and GIS method to
determine what can be inferred (i.e. are the components performing poorly due to high wear or
from wake effects and other varying meteorological effects?) with this easily obtainable
information. Chapters 3 and 4 explores the effects of failing blades which include reduced power
production and rotor speeds as well as changes in the observed blade pitch angles and yaw. Using
statistical methods such as PCA and k-means, the state of the blades can be inferred to determine
the necessity for repairs where changes in observed performance variables can be detected
visually.
To be able to develop an improved condition monitoring system for turbine blades, it is
important to first understand its performance and behaviour under changing operating conditions.
This is first introduced in Chapter 2 where the utilization of simple methods to analyze basic wind
Wind Turbine Blade Performance State
Conditioning Prediction
Fault Prognosis [4, 8]
Remaining Useful Life Prediction
[5-7, 9]
Blade Failure Modes
Causes
Wind Characteristics within Wind Farms
[4, 13-14]
Effects
Reduced Power Output, Rotor Speed
[4, 15, 16, 18]
Differing Blade Pitch Angles and Yaw from the norm [4,
15-17]
5
farm operations data are applied to provide high level insights into the usage history of critical
wind turbine components. With the introduction of the simplified ranking method and GIS
visualizations, results and findings from the application to real-world wind farms are presented.
The process relied on 10-minute averaged SCADA data from a 3-year period acquired from three
wind farms. Wind farm 1 and 2 are located in Southwestern Ontario and farm 3 is located near
the northern coast of Prince Edward Island. The ranking method for the wind turbines based on
usage history can help infer blade and other component wear alongside other pre-existing
techniques. The utility of GIS visualizations was shown to be capable of providing additional long
range, high level insight into the loading history of specific wind turbine components. This
information can increase the level of information available to an operator when considering
potential maintenance decisions.
Chapter 3 focused on the implementation of a SCADA based unsupervised machine
learning method, particularly the principal component analysis (PCA) method for improved wind
turbine blade condition monitoring. With the use of PCA, large measurement datasets of various
SCADA tags can be reduced to new variables that act as linear combinations of select parent
variables. The reduced set of variables (the principal components) can improve the ability to
visualize the data. This technique is then utilized to infer the performance state of the blades to
improve the lead time available to wind farm operators to make informed maintenance decisions.
Building on the research shown in Chapter 3, Chapter 4 sought to provide similar blade
performance state results and inferences using a modified k-means clustering method. The
integration of k-means allows for the clustering of similar data points together using their
Euclidean distance between each point to identify whether the blades are operating normally or
6
set to simulate a condition monitoring system. The results from the monitoring system were
compared to the norm in order to define any deviations as performance abnormalities to determine
whether blade maintenance was necessary.
The analysis performed in this thesis sets a foundation for development of future wind
turbine blade condition monitoring systems and further research on improving their accuracy. The
research presented herein can be improved by performing a sensitivity analysis to examine the
influence of different parent variables on the derived principal components and the k-means
clustering results. That is, which input variables among those available from the SCADA will be
most descriptive of the performance state of the wind turbine blades? As the wind turbine
technology continue to evolves, the demand for improved reliability will also aggressively be
sought after. The analysis prescribed in this thesis serves to act as a stepping stone for future energy
sustainability.
References
[1] R. Wiser and M. Bolinger, “2017 Wind Technologies Market Report,” Lawrence Berkeley National Laboratory, 2017.
[2] Y. Sinha, J. A. Steel, J. A. Andrawus, and K. Gibson, “A SMART Software Package for Maintenance Optimisation of Offshore Wind Turbines,” Wind Eng., vol. 37, no. 6, pp. 569– 577, 2013.
[3] Y. Sinha and J. A. Steel, “Failure Prognostic Schemes and Database Design of a Software Tool for Efficient Management of Wind Turbine Maintenance,” Wind Eng., vol. 39, no. 4, pp. 453– 478, 2015.
7
[5] Y. Zhao, D. Li, A. Dong, D. Kang, Q. Lv, and L. Shang, “Fault Prediction and Diagnosis of Wind Turbine Generators Using SCADA Data,” 2016 North Am. Power Symp. NAPS, pp. 6– 22, 2016.
[6] Y. Zhao, D. Li, A. Dong, J. Lin, D. Kang, and L. Shang, “Fault Prognosis of Wind Turbine Generator Using SCADA Data,” Tongji University, 2016.
[7] M. A. Djeziri, S. Benmoussa, and R. Sanchez, “Hybrid method for remaining useful life prediction in wind turbine systems,” Renew. Energy, pp. 1–15, 2017.
[8] D. Astolfi, F. Castellani, and L. Terzi, “Mathematical methods for SCADA data mining of onshore wind farms: Performance evaluation and wake analysis,” Wind Eng., vol. 40, no. 1, pp. 69–85, 2016.
[9] J. S. Nielsen and J. D. Sørensen, “Bayesian Estimation of Remaining Useful Life for Wind Turbine Blades,” energies, vol. 10, no. 12, pp. 664–677, 2017.
[10] B. Morton, “Understanding Wind Turbine Condition Monitoring Systems.” Renewable NRG Systems, 2018.
[11] P. Tchakoua, R. Wamkeue, M. Ouhrouche, F. Slaoui-Hasnaoui, T. A. Tameghe, and G. Ekemb, “Wind turbine condition monitoring: State-of-the-art review, new trends, and future challenges,” energies, vol. 7, no. 4, pp. 2595–2630, 2014.
[12] H. Luo, C. Hatch, M. Kalb, J. Hanna, A. Weiss, and S. Sheng, “Effective and accurate approaches for wind turbine gearbox condition monitoring,” Wind Energy, vol. 17, no. 5, pp. 715–728, 2013.
[13] C. C. Ciang, J.-R. Lee, and H.-J. Bang, “Structural health monitoring for a wind turbine system: a review of damage detection methods,” Meas. Sci. Technol., vol. 19, no. 12, p. 20.
8
[15] A. Sareen, C. A. Sapre, and M. S. Selig, “Effects of leading edge erosion on wind turbine blade performance,” Wind Energy, vol. 17, no. 10, pp. 1531–1542, 2014.
[16] N. Gaudern, “A practical study of the aerodynamic impact of wind turbine blade leading edge erosion,” J. Phys. Conf. Ser., vol. 524, p. 012031, 2014.
[17] C.-J. Bai and Y.-C. Shiah, “Power-Curve Corrections for Horizontal-Axis Wind Turbine by an Improved Blade Element Momentum Theory,” J. Mech., vol. 33, no. 03, pp. 341–349, 2016.
9 CHAPTER 2
GIS Visualization of Wind Farm Operational Data to Inform Maintenance and
Planning Discussions
Jones Shen1, Ryan Francis1, Lindsay Miller1, Rupp Carriveau1, David S.K. Ting1, Marianne Rodgers2, J.J. Davis3
1 Turbulence and Energy Laboratory, University of Windsor, Windsor, Ontario, Canada 2 Wind Energy Institute of Canada, North Cape, Prince Edward Island, Canada.
3 Kruger Energy, 3285 Chemin Bedford, Montréal, Quebec, Canada
1. Introduction
The reliability of wind turbine components has been of major recent interest to the
renewable energy sector owing to their substantial repair costs and earlier than anticipated failures
[1]. While some causes may be traced back to design or manufacturing defects, many failures are
caused by operational environments that accelerate wear. Where possible, it is desirable to engage
prognostics to help prevent catastrophic failure and the accompanying financial loss to wind farm
operations. To help combat component failures and excessive maintenance costs, many wind farms
implement condition monitoring (CM) systems that use sensors to determine component health
such as oil debris or vibration-based systems to detect faults before they cause further damage [2,
3]. While capable, sophisticated CM systems are not often originally installed in older operations
and may be cost prohibitive to retrofit for others. It is here proposed that basic and potentially
useful insights into turbine health may be gained through simple analysis of turbine Supervisory
Control and Data Acquisition (SCADA) data. These techniques may provide potentially earlier
and complementary warnings to that of conventional CM systems that are geared to report after
faults have already occurred [3]. A number of previous studies have been performed for various
10
Bayesian estimation and other fuzzy methods to predict their conditioning, performance, and their
remaining useful life (RUL) [4–9]. These techniques tend to require specialized training or
programs and are not easily implemented by owners and operators of wind turbines. For these
reasons, a simplified process that can also be complementary to pre-existing methods may be
valuable to the industry.
Wind farm owners and operators are seeking guidance for how to optimize day to day
decisions regarding farm assets. When maintenance or repair situations occur, they are often
tasked with making quick decisions with the goal of minimizing downtime to meet generation
targets. The optimal policies for making these decisions are very complex as they depend on many
factors including the present physical condition of the assets, the replacement technology,
insurance policies, social climates and on uncertain future regulatory and market conditions. The
YR21 project, led by the Universities of Windsor and Western Ontario, aims to consider all factors
to develop an investment decision support system to shepherd owners through the dynamic
operating climate ahead. The advantage of this model lies in connecting reliability modelling and
farm valuation.
As a first step to towards reliability modelling, the study presented here uses a SCADA
data ranking and GIS visualization approach to inform maintenance and planning discussions.
Without more sophisticated, resource intensive options, ranking and GIS visualizations can assist
operators to highlight machines/components to prioritize and/or focus on when assessing
maintenance requirements or administering maintenance budgets. Utilizing the most commonly
accessible data tags from farm SCADA systems, we seek the most appropriate SCADA tags to act
as a metaphorical odometer for wind turbine components. SCADA data contains valuable
11
applied as a tool to optimize condition-based maintenance on a wind farm [4] and to detect
anomalies in operations [6]. SCADA variables of interest such as rotor speed and power output
are incorporated with wind speed to illustrate variations across a wind farm. As farms progress
through their operating lifetime and as downtimes and failures accumulate, this study will be
combined with major component downtime records to seek to identify usage indicators (UI’s); a
simplified approach for improving insight into the usage, and potential wear, experienced by
individual turbines on a wind farm. Such indicators may provide high level insights or starting
points for farm operators tasked with making maintenance decisions.
The GIS visualization approach presented here provides quick reference for the farm and
can inform operators which machines have produced the most power, which are subjected to the
highest winds, as well as which are located downwind of others or along coastal regions. These
parameters can be important in understanding operations and prioritizing maintenance. The
visualization approach can also be used to support wake loss research, which is another important
challenge surrounding wind developments. Turbines that are downwind of the front row machines
can be severely impacted by the wake from those upstream. Losses typically range from 10 – 30%
[10–12] and can be as high as 70% [13].
The aim of this work was to investigate simple methods to analyze basic wind farm
operations data to provide high level insights into the usage history of critical wind turbine
components. There have been many studies using neural networks and other more complex
techniques to predict the remaining useful life (RUL) of specific wind turbine components with
high accuracy, the approaches here are more blunt; but also more accessible. Specifically, we
point to the utility of GIS visualizations in providing additional long range, high level insight into
12
usage history can help infer blade and other component wear alongside other pre-existing
techniques. This information can increase the level of information available to an operator when
considering potential maintenance decisions.
2. Methodology
As a first step to inform operations discussions, the turbines were ranked based on selected
SCADA variables. Figure 2.1 provides an overview of the ranking process. The process relies on
10-minute averaged SCADA data from a 3-year period acquired from three wind farms. Wind
farm 1 and 2 are located in Southwestern Ontario and farm 3 is located near the northern coast of
Prince Edward Island.
Figure 2. 1: Ranking methodology.
The wind farms’ respective wind roses are shown in Figure 2.2 and their features are
summarized in Table 2.1. The wind roses were produced using hourly wind speeds and wind
directional data retrieved from the wind measurement (MET) towers located on each of the wind
farms. This data acts as an input in the software WRPLOT to display the relative frequencies of
wind speeds and directions within each wind farm. Wind farms located in Southwestern Ontario
have dominant winds from the southwest while the winds at the PEI site largely originated from
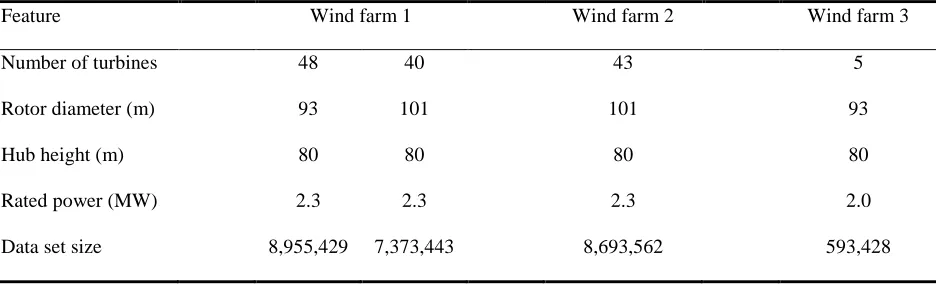
13 Table 2. 1: Wind farm characteristics
Feature Wind farm 1 Wind farm 2 Wind farm 3
Number of turbines 48 40 43 5
Rotor diameter (m) 93 101 101 93
Hub height (m) 80 80 80 80
Rated power (MW) 2.3 2.3 2.3 2.0
Data set size 8,955,429 7,373,443 8,693,562 593,428
The SCADA data consists of operational tags of interest which include wind speed, rotor
speed, pitch control, and power output. These tags were chosen for the study because of their
relation to the performance of wind turbines and their potential to act as health indicators [4]. The
data is then pre-processed to filter outliers. In this study, certain data points were labeled as
outliers. These included any curtailed power outputs as well as instances of no power output when
the wind speed is below the rated cut-in speed as these reductions in power for a given a wind
speed are not related to the degradation of the wind turbine components [3]. (b)
(a) (c)
14
In some regions it is common for system operators to curtail wind energy production at
times of low demand. This can be done by adjusting the blade pitch angle, resulting in a reduction
of power production for a given wind speed. This reduction in power could be misinterpreted as
result of turbine degradation [3, 14], and therefore, it is important that the input SCADA data is
filtered during instances where output power is being curtailed.
The processed SCADA variables are then totaled or averaged for each tag from the period
of 2013 to 2016. These SCADA values are then compiled into a pool consisting of all wind turbines
where each tag is ranked from greatest to least for inspection.
To visualize the more notable trends between SCADA variables, maps were created using
inverse distance weighted (IDW) interpolation with the help of Carina Luo from Leddy Library of
the University of Windsor. IDW interpolation is a deterministic method for multivariate
interpolation that assigns values to unknown points by calculating a weighted average of the values
available at known points. With this in mind, the main author provided wind speeds and power
outputs measured at each individual wind turbine from the SCADA as it can then be utilized to
make predictions for other unmeasured locations within the same wind farm, resulting in
geographic information system (GIS) maps with a continuous wind speed prediction surface or
contour covering the entire study area. This would allow for the main author to analyze the
underlying relationships between the wind speeds and power production throughout the wind farm
15
3. Results and Discussion
3.1. Ranking and Mapping of SCADA data
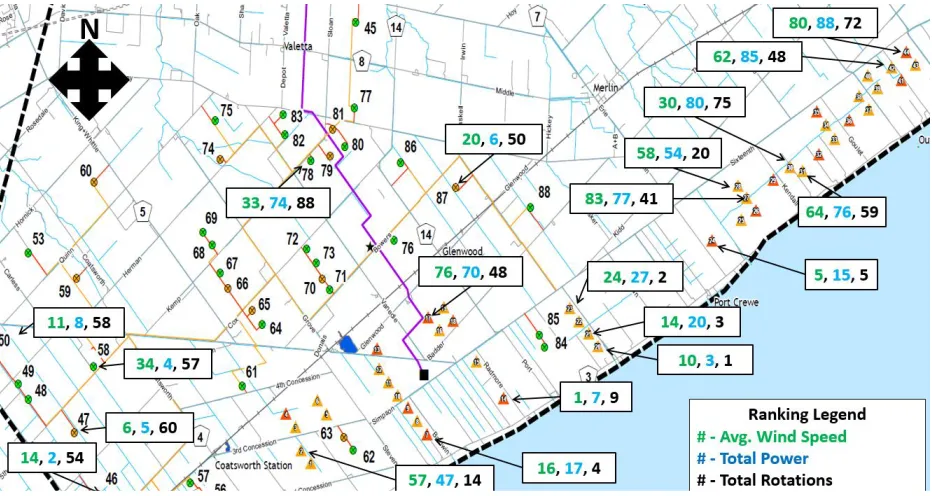
The turbines were ranked from highest to lowest based on the selected SCADA variables.
For example, the ranking of SCADA variables is visually presented for wind farm 1 in Figure 2.3.
Average wind speeds, total power production, and total blade rotations are depicted for selected
turbines across the farm to provide a spatially representative sample. Preliminary
observation-based evaluation shows that the turbines that are first to face the prevailing winds, in this case,
South westerlies, produce higher total power on average than those downwind. For example,
turbine 54, 46, 47, 58, and 50 are ranked 1, 2, 5, 4, 8 respectively for total power whereas turbine
44, 42, and 30 are ranked 88, 85, and 80 respectively. This confirms the general findings from
wake loss models that have demonstrated the impacts of wakes from upstream turbines on the
performance of those downwind [15].
16
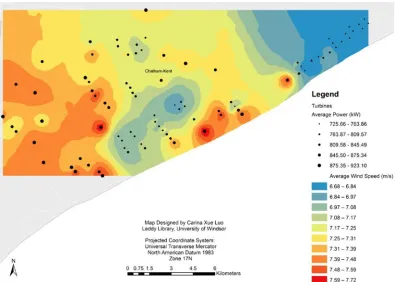
Figure 2.4 presents spatially interpolated GIS maps of wind farms 1 to illustrate the
corresponding average wind speeds experienced and average power produced.
The contours represent the average wind speed experienced throughout the farm and the dots
represent the location of each individual turbine with the size of the dot corresponding to the
average power production. The GIS map illustrates that higher power production is spatially
correlated with higher wind speeds. These higher values were focused around the southwestern
region of the wind farm which was also in good agreement with the wind rose of the wind farm
shown in Figure 2.2a. For average power produced, the highest ranked turbine produces 1.15
times (101m rotor) and 1.12 times (93m rotor) that that of the lowest ranked turbines. These values
are consistent with recent literature stating that the turbines downwind typically produce 10 – 20%
less than the front-row machines [10, 11].
17
Figure 2.5 depicts the relationship between the average wind speeds experienced and the
average power production on wind farm 2. The map displays similar trends to those observed in
wind farm 1, specifically that higher power production is spatially correlated with higher wind
speeds. For farm 3, the ratio between the highest and lowest producing turbine is 1.25, higher than
that at farm 1.
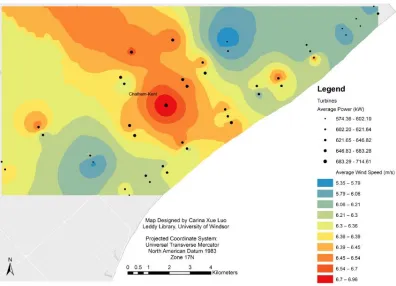
The average wind speed and average power produced in wind farm 3 is presented in Figure
2.6. The relation between the average wind speed and the average power produced was not clearly
discernable. This is most clearly represented by the wind turbine located in the centre of wind
farm 3 as shown in Figure 2.6, where the turbine experiencing the highest average wind speed
within the wind farm produced the lowest average power in the wind farm. The reason for this is
18
for this turbine. Although the sample size is small, the ratio of the highest to lowest producing
machine is 1.06.
Taken together, the GIS maps illustrate confirmation that high winds produce higher power.
This is not unexpected, however, the range of speeds and average powers and variation across the
farms were not previously established. This analysis also uncovered the importance of
19
comparisons when the turbine downtime is considered. This could apply to other differences in
turbine characteristics. The maps are also consistent with previous wake loss model research.
3.2. Utility of GIS Visualizations
Informing maintenance discussions and planning
The GIS maps serve to inform maintenance discussions and planning. When presented to
the farm operators, many discussions were stimulated. The visual representations provide easily
interpretable information to any audience and can assist in understanding turbine and farm
behaviours. For example, if a subset of turbines are experiencing a common issue, such as blade
deterioration, the maps can point to potential influencers such as exposure to high winds or
environmental conditions such as being located close to a body of water. Although this approach
cannot conclusively determine the cause, it may serve as a starting point to direct further
investigation. For example, at farm 3, two of the turbines experienced major component failures
at year 7. The map provided in Figure 2.6 started a conversation around what potential variables
contributed to their failure. The turbines that experienced the failures were the highest producing
turbines on the farm and experienced the highest average RPM. These alone may not explain the
failure, but could potentially inform future maintenance and planning.
As mentioned, wind farm operators can be required to curtail their production during times
of low demand. The maps can serve as a quick reference to determine which machines have been
producing more or experiencing higher winds and could therefore inform the decision of which
machines to curtail. This strategy could extend the useful life of the machines and ultimately, the
20
Lastly, it is common for operators to share experiences with other operators for the purpose
of uncovering causes of unexpected downtime or repair situations. The maps can also be used to
compare farm characteristics and to identify turbines that are exposed to similar conditions
between wind farms.
Future site planning
The maps can also be used for future site planning. Although wake models are available,
actual demonstrated cases of wake impacts and turbine layout can validate or improve models or
potentially uncover additional variables for consideration. This could ultimately improve wind
farm layout optimization. The GIS visualizations can also inform extension or repower planning
at an existing wind farm. Familiarity with the machines, their layout, and operating characteritics
can assist operators with selecting which machines might be suitable for retrofits or repowering
and which may be best to decommission.
4. Conclusion and areas for future research
A simplified yet versatile ranking method for inferring usage and providing high level
insight into the loading history of wind turbines has been presented. The ranking method can
improve wind farm operators’ understanding by inferring usage which is valuable as it can increase
the amount of information available when considering potential maintenance decisions. Future
work should focus on evaluating the correlations between the SCADA variables and major
component repairs or downtime. At this point in the YR21 study, the participating farms did not
have substantial downtime hours or repairs, and therefore, the statistical power was too low to
provide clear correlation analysis. If correlations between SCADA variable rankings and
21
developed to provide a simple, yet easily accessible tool to infer wear and inform O&M
discussions.
The GIS visualizations also confirmed the results of wake loss models. The row of turbines
first to face predominant winds consistently produced more power (between 12 – 25%) than those
that were downstream of these machines. This effect was not well observed at farm 3 due to the
small number of turbines on the farm although a 6% variation was still observed between the
highest and lowest producing turbines. These findings support the importance of optimizing
turbine layout to achieve maximum production for the farm.
The next step to this research work is to collaborate with the wind farms to produce detailed
and specific blade downtime hour logs to support the development of a usage indicator (UI). Future
works will also include the incorporation of other SCADA parameters relating to the health of
major components. Of course, a potential UI cannot be applied to serial defects and may not be
broadly application across farms (i.e. the SCADA variables that correlate with downtime at one
farm, may not correlate at another). Environmental operating conditions will also influence the
relationship between usage and wear and will need to be considered for broader applicability.
These limitations will be carefully considered in the development of an informative and robust UI.
GIS visualizations of wind speed and average power were produced for the three farms.
The maps present a simple compilation of information for comparison including impact of spacing,
rotor size, coatings, wind speed, power production, layout, and proximity to water bodies.
Although some of the relationships are intuitive, for example, higher winds produce higher average
22
Future work will also use the GIS maps to focus on the impacts of land use features
including neighbouring wind farms, trees, and other nearby uses such as golf courses. The impact
of lake breezes, which could possibly enhance fluctuations in wind speed and direction as well as
convection in the region, leading to accelerate wear on components, should also be considered.
Previous research has demonstrated wind turbine wear and damage caused by sudden changes in
wind speeds and direction experienced by coastal turbines [16]. All three farms are exposed to
water bodies which could present an opportunity to study this effect further.
The SCADA data ranking and GIS visualizations, when presented to the farm operators,
resulted in increased knowledge and familiarity of their turbines and the operating and
environmental characteristics of their farm. In the absence of elaborate and costly specialized
systems, these tools can provide insight into maintenance and planning discussions that could
ultimately improve operations and drive profitability.
Acknowledgement
This work was supported in part by Carina (Xue) Luo of the Leddy Library, University of
Windsor. The authors would also like to acknowledge that this work is part of the YR21 Investment
Decision Support Program supported by progressive industrial partners, the Natural Sciences and
Engineering Research Council of Canada (NSERC), and the Ontario Centres of Excellence.
References
[1] R. Wiser and M. Bolinger, “2016 Wind Technologies Market Report,” U.S. Department of Energy (DOE), 2016.
23
[3] E. Lapira, D. Brisset, H. D. Ardakani, D. Siegel, and J. Lee, “Wind turbine performance assessment using multi-regime modeling approach,” Renew. Energy, vol. 45, pp. 86–95, 2012. [4] C. S. Gray, F. Langmayr, N. Haselgruber, and S. J. Watson, “A Practical Approach to the Use of SCADA Data for Optimized Wind Turbine Condition Based Maintenance,” EWEA Offshore Wind Amst., p. 10, 2011.
[5] Y. Zhao, D. Li, A. Dong, D. Kang, Q. Lv, and L. Shang, “Fault Prediction and Diagnosis ofWind Turbine Generators Using SCADA Data,” 2016 North Am. Power Symp. NAPS, pp. 6–22, 2016.
[6] Y. Zhao, D. Li, A. Dong, J. Lin, D. Kang, and L. Shang, “Fault Prognosis of Wind Turbine Generator Using SCADA Data,” Tongji University, 2016.
[7] M. A. Djeziri, S. Benmoussa, and R. Sanchez, “Hybrid method for remaining useful life prediction in wind turbine systems,” Renew. Energy, pp. 1–15, 2017.
[8] D. Astolfi, F. Castellani, and L. Terzi, “Mathematical methods for SCADA data mining of onshore wind farms: Performance evaluation and wake analysis,” Wind Eng., vol. 40, no. 1, pp. 69–85, 2016.
[9] J. S. Nielsen and J. D. Sørensen, “Bayesian Estimation of Remaining Useful Life for Wind Turbine Blades,” energies, vol. 10, no. 12, pp. 664–677, 2017.
[10] P. Sørensen and T. Nielsen, “Recalibrating wind turbine wake model parameters – validating the wake model performance for large offshore wind farms,” Eur. Wind Energy Assoc. EWEA Conf. Exhib., 2006.
[11] R. J. Barthelmie et al., “Modelling and measuring flow and wind turbine wakes in large wind farms offshore,” Wind Energy, vol. 12, no. 5, pp. 431–444, 2009.
[12] P. McKay, R. Carriveau, and D. Ting, “Wake impacts on downstream wind turbine performance and yaw alignment,” Wind Energy, vol. 16, no. 2, pp. 221–234, 2012.
[13] J.-Å. Dahlberg, “Assessment of the Lillgrund Windfarm,” Vattenfall, 2009. [Online]. Available: https://corporate.vattenfall.se/globalassets/ sverige/om-vattenfall/om-oss/var-verksamhet/vindkraft/lillgrund/assessment. pdf.
[14] D. McLaughlin, P. Clive, and J. McKenzie, “Staying Ahead of the Wind Power Curve,” Renew. Energy World, vol. 13, no. 2, 2010.
24
25 CHAPTER 3
Improved Condition Monitoring of Wind Turbine Blades through
Unsupervised Machine Learning
Jones Shen1, Milad Rezamand1, Rupp Carriveau1, David S.K. Ting1, J.J. Davis2, Marianne Rodgers3
1 Turbulence and Energy Laboratory, University of Windsor, Windsor, Ontario, Canada 2 Kruger Energy, 3285 Chemin Bedford, Montréal, QC, Canada
3 Wind Energy Institute of Canada, 21741 PE-12, Tignish, PE, Canada
1. Introduction
With the wind turbine technology rapidly evolving year after year [1], wind farm operators
face the challenge of upkeeping their machines in order for them to compete against newer models
in terms of performance. However, by being very conservative with maintenance to maximize
their turbine uptimes, there may be instances where the machines may not need repairs. With
unnecessary maintenance, it needlessly increases operation and maintenance (O&M) costs [2], [3].
The biggest culprit for the O&M costs tend to be blades where they have the greatest repair costs
within the turbine (up to 15-20% of the total turbine cost) [4]. To reduce this cost, the modes of
blade failures as well as methods in determining the need for repairs are examined to create a
possible solution.
Ciang et al [4] and Nivedh [5] showed that wind turbine blade failures were among the
most common components to fail within the entire turbine assembly. Many wind farm operators
are observing blade deterioration sooner than original manufacturer specifications. It can be
difficult for manufacturers to anticipate all environmental challenges a blade will operate under,
including meteorological conditions, pollution, varying precipitations and saline air. These
26
and structural discontinuities may arise, reducing life expectancy [6]. It was observed by Sareen
et al [7], [8] and Gaudern [9] that eroded blades can cause severe lift reductions and drag increases.
Sareen et al's results showed a 6-500% drag increase and a loss in annual energy production of up
to 25% depending on the level of erosion present on the blade. Beyond this, there are catastrophic
failure mechanisms in blades which have led to the collapse of entire machines [4]. With the
concept of a CM system introduced in Chapter 2, a form of predictive maintenance can be deployed
within wind farms to help improve wind turbine blade reliability and reduce O&M costs. These
approaches can take advantage of the lead times provided by the predictions of faults being made
in early stages of component health degradation [3].
This study introduces the use of a statistical approach for the condition monitoring of wind
turbine blades. CM systems typically use sensors for oil monitoring and vibration analysis to
determine component health [10]–[12]. Most often these components are drivetrain elements.
Fortunately, the science of diagnosing the state health of bearings and gears is quite advanced. Its
success is likely in no small part due to the value of the data provided by these direct sensors. Luo
et al [12] and Siegel et al [13] were able to utilize vibrational data from subcomponents of their
test cases to develop effective condition monitoring algorithms. However, most wind farm blade
populations lack the level of detailed and direct structural performance data provided by the types
of specialized sensors. Therefore, vibrational data for blades that may have a more potential in
diagnosing its state is mostly not available. Subsequently, farms are looking for ways to leverage
abundant and readily available supervisory control and data acquisition (SCADA) data. While
SCADA data is collected at nearly all farms, in many cases it is not being used to its full potential.
Gray and Watson [14] proposed the use of SCADA performance data combined with an
27
therefore, the risk of failure. With the application of the physics of failure (PoF) approach, a
detailed assessment of the wind turbine system can be made by identifying potential failures
modes, the acting loads and modelling of the damage kinetics in order to highlight critical
operating conditions. The PoF is capable of performing rapid calculations due to its simplicity and
is also able to account for variability of load capacity, this methodology opens channels for real
time damage calculations. Bangalore et al [15] introduces an anomaly detection method using an
artificial neural network (ANN) based condition monitoring system. Their work improves the data
preprocessing and post-processing from previous publications to improve the confidence in the
SCADA-based CM system process. Adaptive neuro-fuzzy interference system (ANFIS) models were employed to determine if specific wind turbine components’ condition can be considered
healthy or unhealthy in the work of Schlechtingen and Santos [16]. The ANFIS model utilizes a
combination of concepts from ANNs and fuzzy logic that enables anomaly detection. It also works
towards determining a root cause for such anomalies based on simple If-Then statements. An
unsupervised machine learning method to detect anomalies within generator performance metrics
was applied successfully in China to perform generator fault prediction, remaining useful life
(RUL) estimation and fault type diagnosis using SCADA data [17], [18]. By forecasting an
anomaly operation index (AOI) using an ARIMA model, the proportion of unhealthy instances to
all instances over a given period was determined which highlighted the probability of performance
degradation over time. Methods based on principal component analysis (PCA) have also proven
to be quite capable in developing wind turbine fault detection strategies and differentiating
between healthy and unhealthy component conditions [19]–[21]. With the use of PCA, large
measurement datasets of various SCADA tags can be reduced to new variables that act as linear
28
can improve the ability to visualize the data. This is often achieved through the use of clustering
methods that group similarly behaving points and scatters others. Most of these applications
focused on components with available SCADA variables that could be associated with their
performance (i.e., generator temperature, bearing vibrations, failure histories, etc.).
Following the studies cited in [19]–[21], a SCADA data based, PCA technique for wind
turbine blade condition monitoring is developed. This technique is utilized to infer the performance
state of the blades as there is no such data point or value that can quantify the damage or the state
of the blades. Multiple instances of abnormalities or outliers in the data points will allow for the
classification that the blades are in need of repairs. This can improve the lead time available to
wind farm operators to make informed maintenance decisions.
2. Methodology
2.1 Data Collection
SCADA data was collected by the main author for a period of 12 months from an 88 turbine
farm in Southwestern Ontario, Canada as shown in Table 3.1. Table 3.2 shows the 10-minute
averaged SCADA data variables of interest provided by each of the wind turbines.
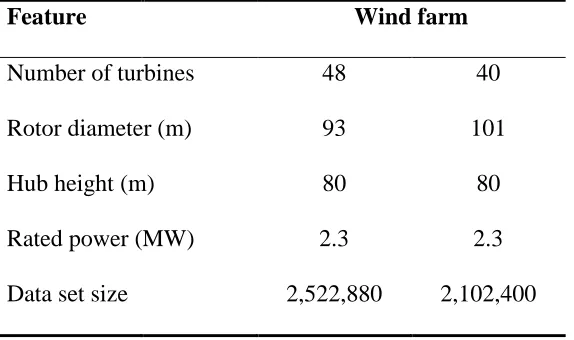
Table 3. 1: Wind farm characteristics.
Feature Wind farm
Number of turbines 48 40
Rotor diameter (m) 93 101
Hub height (m) 80 80
Rated power (MW) 2.3 2.3
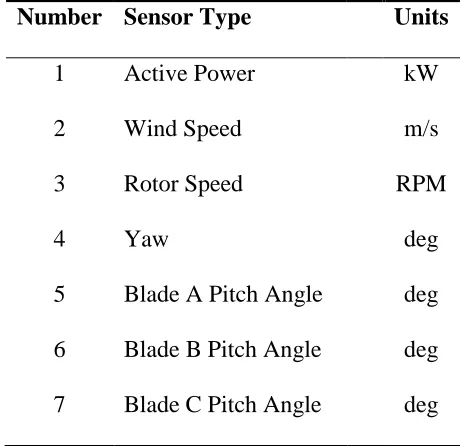
29 Table 3. 2: SCADA data variables of interest.
Number Sensor Type Units
1 Active Power kW
2 Wind Speed m/s
3 Rotor Speed RPM
4 Yaw deg
5 Blade A Pitch Angle deg
6 Blade B Pitch Angle deg
7 Blade C Pitch Angle deg
2.2 Variable Selection
Successful representative dimensionality reduction is influenced by the strength of the
relationship between the principal components and the original parent variables. Subsequently, the
selection of appropriate parent variables is critical to the PCA process. The SCADA data variables
chosen for this study were active power output, wind speed, rotor speed, yaw, and blade pitch. The
turbine active power, wind speed, and rotor speed were chosen as changes in their SCADA values
can be observed due to the decaying geometry of the blades caused by leading edge erosion or
other types of structural discontinuities [8], [9], [22]. The yaw and blade pitch angles also
experience changes as their optimal angles for maximum power output will differ due to the
eroding blade geometries [8], [9], [22], [23]. The use of derating to limit loads on damaged blades
will also alter the rotor speed and blade pitch at the cost of reduced power production [24]. With these variables, they may serve as features that may reflect the blade’s performance health state
30 2.3 Data Pre-Processing
Preprocessing required that the data be filtered for errors and curtailment values. SCADA
records are often impacted by periodic instrument error. Further, within the region of this study, it
is common for wind farm operators to curtail wind energy production when the demand is low.
Curtailment can be performed by adjusting the blade pitch angles which results in a decrease of
electrical power production for a given wind speed. [25], [26] highlights that this loss of power
output could be misunderstood as being a result of blade performance abnormalities or
degradation, which therefore, confirms the importance of filtering these instances from the data.
The 10-minute averaged SCADA data was then averaged across a day to form a daily
average. Thus, each data point corresponds to a daily average of each SCADA variable for each
wind turbine.
2.4 Principal Component Analysis (PCA) Model
PCA is popular when dimensionality reduction and feature extraction is required [27], [28].
It can extract a small number of latent variables, namely the scores T (𝑡1, 𝑡2, . . . , 𝑡𝑃). These are
positioned to best explain the greatest variance in the initial input data matrix X with dimensions
of (𝑁 × 𝑃). Here, N is the number of samples and P is the number of variables or features. The
transformed data is linearly independent and are referred to as the principal components which
represents a combination of all the features within the input dataset [21]. Before implementing the
PCA, it is vital to first normalize and standardize the dataset. This is done by subtracting the mean
value of each feature from the input data while scaling each dimension so that they are in the same
31
The principal components are typically obtained by computing eigenvectors U through the use of
Singular Value Decomposition (SVD) of the covariance matrix S (𝑆 = 𝑚1 ∑𝑛𝑖=1(𝑥(𝑖))(𝑥(𝑖))𝑇). One
must first calculate the eigenvalues λ (λ1,λ2, . . . ,λP) of the covariance matrix S which can be
solved using the equation,
|𝑆 −λ𝐼| = 0 (1)
where the eigenvalues λ represent the variances of each principal component and the sum of the
variances equals the total sum of the variance of the original variables. With the eigenvalues
determined, the following equation can be used to calculate the corresponding eigenvectors 𝑈 = {𝑢𝑖}:
𝑈′𝑆𝑈 =𝜆 (2)
The eigenvectors U represent the loadings which indicate the influence (i.e., load or weight) of
each of the original variables in forming the principal components, T, as well as explaining how
the variables are correlated with the principal components. To calculate the principal components
T using the original dataset X (𝑁 × 𝑃) and eigenvectors U, the following relationship can be used:
𝑇 = 𝑋𝑈 (3)
Since the PCA has the effect of concentrating most of the original dataset within the first few
principal components, it is ideal to eliminate later components as they may be dominated by noise
[19].
In this application, our interest is in capturing the health degradation of turbine blades by
32
components is to summarize as much of the initial information as possible with a smaller variable
set for ease of interpretation. With the assumption made that the majority of the blades function
mostly in a normal state and that faults rarely occur, the largest and heavily dense cluster may
represent blades operating in a normal state [17]. Therefore, instances deviating away and located outside of this dense cluster may represent blades operating in an abnormal or “unhealthy”
condition which is deemed as a blade failure for this study. The inferences of the blade
performance states are hindcasted with historical blade maintenance reports to determine its
accuracy. Abnormality in the blade performance state can be observed from the gradual
accumulation of leading edge erosion, lightning strike damage, molding surfaces due to trapped
precipitation, icing, bird strikes, etc. Boundaries for the normal and abnormal clusters are assigned
to create a consistent method of differentiating between the two states. According to a similar
method applied to generators [17], blade state changes from normal to abnormal is considered a
progressive process rather than instantaneous. Thus, a singular instance of an abnormality may not
represent degradation as anomalous environmental operating conditions can force components
outside their normal performance specification. Repetitive instances of these abnormal states for a
given set of wind turbine blades could however be declared as operation in an abnormal state.
However, being classified as abnormal may not necessarily be a blade failure, but rather a deviation
from the design performance characteristics so farm operators can then choose to investigate
further into the identified abnormality.
The selected SCADA variables have shown to be interdependent with one another where
they are inherently correlated with each other. This is not a surprise as the performance of various
assemblies within the turbine are at least somewhat dependent on one another. For this study, each
33
deteriorate from the norm [8], [9], [22], [23], [24]. The wind speeds will likely be the only variable
to remain constant, but it can be used as a reference point to compare normal and abnormal
instances (i.e. expected outputs for a given wind speed might not be produced when blades are
operating abnormally). Performing the PCA will create the most compact representation that can
reconstruct these observable changes. However, there may be merit in removing some variables
thought to be measuring the same latent aspects as the group of variables. The potential redundancy can cause the PCA to overemphasize the variables’ contributions. Because of this, no linear
regression was used to identify the state of the blades since an important condition for regression
is that independent variables should be used. The state of the blades were therefore, not predicted,
but rather inferred by statistically clustering blade performance instances.
Typically, when a given wind speed is measured, there is, for example, an expected power
output by the turbine. However, as the state of the blades deteriorate, a substantial decrease in
power output can be observed given the same wind speed for normal operating blades. If the
ranking and GIS method in Chapter 2 was applied to this data, it can highlight the lower power
produced by that specific turbine compared to other machines in similar operating conditions
without being able to pinpoint whether the cause was due to damage or environmental conditions.
With the PCA method, it can be inferred as blade damage if consistent abnormal data points are
observed whereas vary environmental anomalies may appear as singular abnormal instances. The
method’s steps for the model are summarized as follows:
Step 1: Cluster all instances within the top two principal components.
Step 2: Designate boundaries to differentiate normal and abnormal instances.
34
Algorithm 1 presents the detailed procedure for the inference of the wind turbine blade state:
Algorithm 1
1. Setting a Training set: 𝑥(1), 𝑥(2), … , 𝑥(𝑚)
2. Standardizing (Normal Standard Distribution):
• Calculating mean: 𝜇𝑗 =𝑚1 ∑𝑚𝑖=1𝑥𝑗(𝑖)
• Calculating standard deviation: 𝜎𝑗 = √1
𝑚∑ (𝑥𝑗
(𝑖)− 𝜇 𝑗)2 𝑚
𝑖=1
• Replacing each 𝑥𝑗(𝑖) with 𝑥𝑗
(𝑖)−𝜇 𝑗
𝜎𝑗
3. PCA (reducing data from n-dimensions to k-dimensions):
• Computing covariance matrix: 𝑆 =𝑚1 ∑𝑛𝑖=1(𝑥(𝑖))(𝑥(𝑖))𝑇
• Computing eigenvectors of covariance matrix by using SVD (Singular Value
Decomposition) algorithm: [𝑈, 𝑆, 𝑉] = 𝑠𝑣𝑑(𝑆)
• Employing Alternating Least Squares (ALS) algorithm to find the best rank-k approximation
PCA algorithm returns the principal component coefficients for the N by P data matrix
X. Rows of X correspond to observations and columns to variables. Each column of
COEFF contains coefficients for one principal component. The columns are in
descending order in terms of component variance (LATENT).