University of Windsor University of Windsor
Scholarship at UWindsor
Scholarship at UWindsor
Electronic Theses and Dissertations Theses, Dissertations, and Major Papers
2014
An Interactive Approach to Software Visualization for
An Interactive Approach to Software Visualization for
Customization
Customization
Manpreet Singh Kaler University of Windsor
Follow this and additional works at: https://scholar.uwindsor.ca/etd
Recommended Citation Recommended Citation
Kaler, Manpreet Singh, "An Interactive Approach to Software Visualization for Customization" (2014). Electronic Theses and Dissertations. 5161.
https://scholar.uwindsor.ca/etd/5161
This online database contains the full-text of PhD dissertations and Masters’ theses of University of Windsor students from 1954 forward. These documents are made available for personal study and research purposes only, in accordance with the Canadian Copyright Act and the Creative Commons license—CC BY-NC-ND (Attribution, Non-Commercial, No Derivative Works). Under this license, works must always be attributed to the copyright holder (original author), cannot be used for any commercial purposes, and may not be altered. Any other use would require the permission of the copyright holder. Students may inquire about withdrawing their dissertation and/or thesis from this database. For additional inquiries, please contact the repository administrator via email
An Interactive Approach to Software Visualization for Customization
By
Manpreet Singh Kaler
A Thesis
Submitted to the Faculty of Graduate Studies through the School of Computer Science in Partial Fulfillment of the Requirements for
the Degree of Master of Science at the University of Windsor
Windsor, ON, Canada
2014
An Interactive Approach to Software Visualization for Customization
by
Manpreet Singh Kaler
APPROVED BY:
______________________________________________ A. Azab
Dept. of Industrial and Manufacturing Systems Engineering
______________________________________________ L. Rueda
School of Computer Science
______________________________________________ X. Yuan
School of Computer Science
iii
DECLARATION OF ORIGINALITY
I hereby certify that I am the sole author of this thesis and that no part of this thesis has
been published or submitted for publication.
I certify that, to the best of my knowledge, my thesis does not infringe upon anyone’s
copyright nor violate any proprietary rights and that any ideas, techniques, quotations, or
any other material from the work of other people included in my thesis, published or
otherwise, are fully acknowledged in accordance with the standard referencing practices.
Furthermore, to the extent that I have included copyrighted material that surpasses the
bounds of fair dealing within the meaning of the Canada Copyright Act, I certify that I
have obtained a written permission from the copyright owner(s) to include such
material(s) in my thesis and have included copies of such copyright clearances to my
appendix.
I declare that this is a true copy of my thesis, including any final revisions, as approved
by my thesis committee and the Graduate Studies office, and that this thesis has not been
iv
ABSTRACT
The Software Product Line (SPL) provides software customization by composing several
different web services together. When further supported by Service-Oriented Architecture
(SOA), SPL offers unprecedented advantages for reusing software artifacts in mass
customization of software applications, leading to radically reduced time, cost, and effort
of software development. A Petri-Net based visualization system for the software
customization has been developed in our research group.
This thesis works on enhancement of the prior work by introducing an interactive
approach of software visualization for software customization. The proposed approach
segregates the users based on their interaction with the system and the best suited
visualizations are selected and displayed for the users. In this thesis an interactive
framework based on Contextual Control Model has been proposed. A usability study has
been conducted to validate the improvements in the usability of the proposed system
v
DEDICATION
vi
ACKNOWLEDGEMENTS
I would like to thank and express my sincere gratitude to my supervisor Dr. Xiaobu
Yuan, for his support, guidance and encouragement. His valuable hints and stimulating
suggestions has always helped me proceed with this thesis. Without his support and
guidance, this work would be impossible.
I would also like to thank Dr. Ahmed Azab and Dr. Luis Rueda, for being in the thesis
committee and spending their valuable time in providing me with encouraging feedback.
My special thanks goes to my parents and my sister for their patience and love they
provided to me during all times. Finally I would like to thank my friends Akansha,
Arshdeep, Harsh, Pawan, Ravinder, Ranjeet and Sahil for their encouragement and moral
support.
I would like to thank University of Windsor students who participated in the study of my
vii
TABLE OF CONTENTS
DECLARATION OF ORIGINALITY ... iii
ABSTRACT ... iv
DEDICATION ...v
ACKNOWLEDGEMENTS ... vi
LIST OF TABLES ...x
LIST OF FIGURES ... xi
Chapter 1 Introduction and Motivation ...1
1.1Introduction 1 1.2Motivation 2 1.3 Problem Statement 3 1.4 Contributions 4 1.5 Structure of the Thesis 6 Chapter 2 Software Customization ...7
2.1. Traditional Software Engineering Methodology 7 2.2. Software Product Line 9 2.2. Service Oriented Architecture 11 2.3 Integrating SOA and SPL 14 2.4. Requirement Engineering 16 2.5. Requirement Elicitation 17 Chapter 3 Software Visualization ...24
viii
3.2. Visual Representations 26
3.3. Software Visualization Techniques 28
3.4. Different Types of Visualizations 31
3.4.1. Petri Net Based Visualization ...31
3.4.2. Directed Graph Based Visualization ...32
3.4.3. Requirement Model Based Visualization ...33
3.4.4. Block Based Visualization ...34
Chapter 4 Proposed Interactive Approach of Visualization ...35
4.1. Introduction 35 4.3. The Structure of the Proposed Method 36 4.4. Contextual Control Model 37 4.5. Different Types of Users 40 4.6. Proposed Algorithm 43 Chapter 5 Implementation And Usability Study ...46
5.1. Implementation 46 5.2. Usability Study 55 5.3. Proposed Usability Testing Method 58 Chapter 6 Usability Study Results ...60
6.1. Introduction 60
6.2. Task Description 61
6.3. Requested Task 62
ix
6.4.1 Learnability ...64
6.4.2. Efficiency ...66
6.4.3. Error Rate ...67
6.4.4. User Satisfaction ...68
6.4.5. Necessity ...69
6.4.6. Problems ...71
6.4.7. Overall Opinion ...72
Chapter 7 Conclusion and Future Work ...75
7.1. Conclusion ...75
7.2. Future Work ...76
APPENDICES ...77
Appendix A. Questionnaire for Interactive Visualization Interface ...77
Appendix B. Questionnaire for Existing Interface ...78
Appendix C. Task Sheet for Existing System...79
Appendix D. Task Sheet for Interactive System...80
Appendix E. System Class Diagram ...81
REFERENCES ...82
x
LIST OF TABLES
3.1. Comparison of different visualization techniques ...30
6.1. Distribution of participants in the test according to their academic level ...60
xi
LIST OF FIGURES
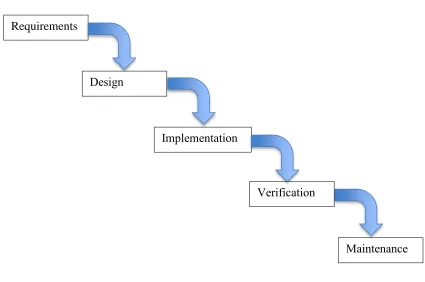
2.1. The Waterfall Model ...8
2.2. Basic Components of SOA ...13
2.3. Requirement model instantiated with book locating service ...22
3.1.An example of Petri Net ...31
3.2.An example of Directed Graph ...33
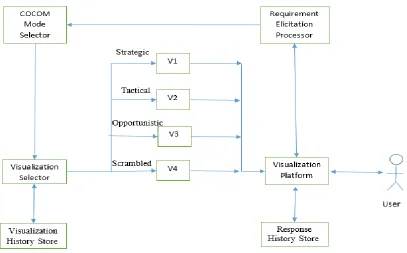
4.1.Structure of Proposed Method ...37
4.2.Internal Structure of Contextual Control Model ...39
4.3.Proposed System Architecture ...43
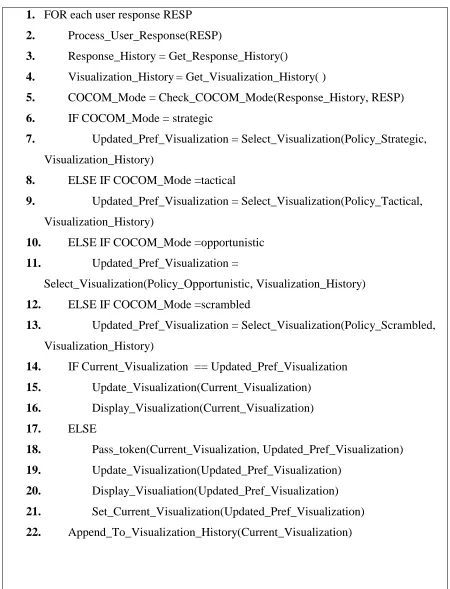
4.4.Pseudo Code of the System...44
5.1.DialogueInterface.java Class ...47
5.2.XMLModifier.java Class ...48
5.3.Dialogue Manager Interface ...49
5.4.Petri Net Based Visualization ...51
5.5.Directed Graph Based Visualization ...52
5.6.Requirement Model Based Visualization ...53
5.7.Block Based Visualization ...54
6.1.Comparison of Easiness and Score ...65
6.2.Comparison of Easiness and Understandability ...66
6.3.Comparison of Efficiency ...67
xii
6.5.Comparison of Satisfaction ...69
6.6.Necessity Comparison ...71
1
Chapter 1
Introduction and Motivation
1.1
Introduction
During the initial stages of the evolution of software development there was not much
emphasis on the reusability of the software artefacts. The cost of the software for a
computer system was negligible compared to the cost of the hardware used. But with the
evolution of the more and more complex software systems the reusability of the software
artefacts has become much more important consideration.
The software has become much more critical part of any computer system. The reason for that is the flexibility of software in modifying the system and also software’s strength in
adding a new functionality to the system, which perhaps it would be difficult to be
performed without it and only by means of modifying the hardware. Due to this increase
in the size and complexity of the software system there is a need to cut down the cost and
effort involved in deepening and customizing these systems. Therefore, in order to make the system production’s process much more efficient, the concept of Software Product
Line Engineering is used [22].
Using the Software Product Line different software applications and other software
products can be developed by building reusable software artefacts and reusing these
software artefacts. By using SPL, some advantages can be gained such as reduction of
development cost and time, enhancement of quality, coping with evolution and
2
There is also a need to make this development process less complex and more user
friendly. The users using these systems have varying levels of knowledge and can be
from different domains. Software Visualizations can be used to improve the
understanding of the system and thus improving the overall usability of the system.
Recently so many software visualization techniques and tools are available but it is
critical to choose the most suitable one for a suitable activity in software development
process to do the most effective visualization for a specific software system [21].
1.2
Motivation
In last few decades the software development process has changed radically. The
software development process has come long way from the software systems with a few
lines of code to the software systems with millions of lines of codes. Although the
software systems have grown bigger and bigger and are now gigantic but as we can see
in most cases there are a lot of software systems that are not so different from others
when we see them at lower levels. These similarities at smaller level can be used to
develop the reusable software components or artefacts which can be used to combine and
develop a more complex software system. Software product line (SPL) engineering is a
paradigm to develop software applications with reusable software assets, which are
tailored to individual customers' needs [18]. This approach helps in reducing the
development costs of the software systems as we do not have to reinvent the wheel every
time.
By reusing services, and adopting SOA-based methods in SPL engineering, especially the
3
[22], the goal of automating software development could be achieved. A system based
on this approach has been developed in our research group which uses Software
Visualizations to help the user interact better with the system. But this does not help all
users as all the users can never have same level of understanding of the system they are
trying to develop. This motivates me to conduct a research on this particular technology
and solve the challenges associated with an interactive human computer interaction.
1.3 Problem Statement
In software industry due to the increased complexity and the large size of the software
systems now a day, the emphasis is on the reusability of the code. The code written for
one software system or an application is reused for a similar application and code is not
completely written from scratch.
SOA concept is used in Software Product Line; it will make a mass customization of
software application by reusing software artefacts which can be very beneficial, specially
time-wise and effort-wise. In Software Product Line the concept of Service Oriented
Architecture is used to develop automated software system for selection and matching of
reusable services to create new applications. The services are loosely coupled in order to
allow them to communicate with each other. The services can be composed based on the
selection, so that the best possible services.
Based on this fact, beforehand, Petri-Net based interface has been developed in our
research group [17], which interacts with the user who wants to do software
customization, in natural language and does the requirement elicitation process
4
provide the user with the visualizations. The ontology represents the knowledge of the
product features as well as their business logic. It represents the commonalities and
variabilities among a group of related artefacts and in this way it directs the dialogue
system to perform requirement elicitation [17].
The problem here is that the system can be used by a wide variety of users and amount of
knowledge of these users vary widely. The visualization system based solely on Petri-Net
is not very helpful for the users with lesser technical knowledge or the users who are
more interested in the business aspect of the software. The level of expertise, knowledge
and domain of interest vary widely across these users. But Software visualization for all
these users are same and reveal same sort of information. Therefore different types of
users should be studied and as per the needs of these users different visualization methods
best suited to their level and domain knowledge should be chosen. This research
identifies the need to study different types of users and the best suited visualization
methods for these users.
In the end a usability study of the system should be conducted to study the usefulness and
efficiency of the system and to justify the use of new method. The system should be
investigated to check if it improves the learnability, efficiency, and user satisfaction of
the system and reduces the error rate.
1.4 Contributions
This thesis presents an interactive approach of software visualization for software
customization. The purpose of this method is to enhance the usability of the system, and
5
developing the software systems using the traditional development techniques. The
introduction of the interactive approach will reduce the effort spent on working with the
system which further leads to reducing the time and cost spent. The interactive software
visualization will be implemented in the graphical interface of the system, thus improving
the usability of the system.
The users are segregated into four groups based of their level of knowledge about the
software development and software customization process. The Contextual Control
Model (COCOM) is used for the classification of the users based on their actions. These
users will be provided different types of visualization interfaces as per their knowledge.
The software customization based on Software Product Line is still in initial stages and
the effort involved in the process is huge. The interactive user based approach of software
visualization for the software customization will decrease the effort, time and cost of the
process of software customization. It will allow the users with lesser knowledge of
software development process to customize software for them or to understand the flow
of the software being developed.
The Interactive approach of software visualization improves the human computer
interaction by providing different visualizations to different users for the better
understanding. It provides users a framework which is more friendly and interactive in
nature, thus improving the overall user experience.
A usability study will be conducted on real users to compare the existing system and the
proposed system, and to check whether the proposed system enhances the user
6
1.5 Structure of the Thesis
The aim of this study is to outline the interactive approach of software visualization for
software customization. In chapter 2, a literature review and survey is presented on
software customization. Traditional Software engineering methodology, Software
Product Line, Service Oriented Architecture, integration of SOA and SPL along with
Requirement Engineering and Requirement Elicitation is discussed.
Chapter 3 discusses the central elements of Software Visualization. Visual
Representations, Software Visualizations Techniques and Different Methods of
Visualizations are described in detail. Chapter 4 describes the proposed Interactive
Approach of Software Visualization for Software Customization. The structure of the
approach is also discussed. Contextual Control Model and segregation of users on the
basis of this model is described in detail along with the algorithm for the interactive
approach.
In Chapter 5 implementation and proposed usability study for the verification of the
system is discussed. Chapter 6 details the results and analysis of the usability study
conducted in order to check the usability of the interactive visualization system. Chapter
7
Chapter 2
Software Customization
2.1. Traditional Software Engineering Methodology
No matter how software development is performed or what approach is taken the
essential task involved is problem solving. The way developers solve problems is
generally the same no matter what the problem is or the approach taken. Problem solving
involves four essential activities: requirements - gathering and documenting details about
the problem; analysis - understanding the problem in enough detail to ensure a correct
solution; design - finding and specifying an optimal solution to the problem; and
implementation (if needed) - implementing the solution in whatever form it takes [57].
The essential problem in software development is how to implement, using certain
technologies and within certain constraints, a particular information processing system.
Although there are associated problems of understanding the domain these are generally
non-software related. It can be argued that no matter what paradigm or approach is taken
to software development each of the problem solving activities has to be undertaken to
some extent. In essence, every developer goes through the requirements, analysis, design,
and implementation cycle, be it over an extended period, a week, a day, an hour or
minutes, and whether or not they document the results, discuss them with others on a
whiteboard, or just consider them informally within their head. There is no escaping these
activities [57].
A software development lifecycle (SDLC) gives a high level perspective of how the
8
team doing software development [57]. The most popular traditional model used is
Waterfall Model. The Waterfall SDLC was presented by Dr. Winston W. Royce as a
method for software development. It involves sequentially completing each phase in full
and then moving on to the next phase. In case of this Waterfall Model the progress is
often seen as flowing steadily downwards and hence it is named waterfall method.
The waterfall model is the most commonly used traditional model for the software
development and software customization. The figure 2.1 shows the waterfall model
structure:
Figure 2.1. The Waterfall Model Requirements
Design
Implementation
Verification
9 The sequential phases in Waterfall model are [57]:
• Requirement Gathering and analysis: All possible requirements of the system to
be developed are captured in this phase and documented in a requirement specification
doc.
• System Design: The requirement specifications from first phase are studied in this
phase and system design is prepared. System Design helps in specifying hardware and
system requirements and also helps in defining overall system architecture.
• Implementation: With inputs from system design, the system is first developed in
small programs called units, which are integrated in the next phase. Each unit is
developed and tested for its functionality which is referred to as Unit Testing.
• Integration and Testing: All the units developed in the implementation phase are
integrated into a system after testing of each unit. After the integration the entire system
is tested for any faults and failures.
• Maintenance: There are some issues which come up in the client environment. To
fix those issues patches are released. Also to enhance the product some better versions
are released. Maintenance is done to deliver these changes in the customer environment.
2.2. Software Product Line
During the initial stages of the evolution of software development there was not much
emphasis on the reusability of the software artifacts. The cost of the software for a
computer system was negligible compared to the cost of the hardware used. But with the
evolution of the more and more complex software systems the reusability of the software
10
Traditionally, the software used to be applied on products was very small and simple. In
order to modify and produce a new product, it used to be much easier and cheaper to
copy, transport or replace the software than the hardware. The main focus of generating a
product was on the hardware and software did not used to play a key role in product
generation [26].
However, now, software plays a very critical role in any system. The reason for that is the flexibility of software in modifying the system and also software’s strength in adding a
new functionality to the system, which perhaps it would be difficult to be performed
without it and only by means of modifying the hardware. Therefore, in order to make the system production’s process much more efficient, the concept of Software Product Line
Engineering will be addressed [25].
Software Product line is a paradigm to develop software applications and software
products, by building reusable parts and reusing them. For this purpose mass
customization is being used which means large production of goods with taking into account the customer’s individual requirements. For this purpose, we should focus on
commonalities and differences in the applications (in terms of requirements, architecture,
components and test artifacts) of the product line to be modeled in a common way [25].
By using SPL, some advantages can be gained such as reduction of development cost and
time, enhancement of quality, coping with evolution and complexity and etc [25].
Software Product Line Engineering Paradigm consists of two processes: Domain
Engineering and Application Engineering. Domain Engineering establishes a platform
and defines commonalities and variabilities of the product line. Our main focus in this
11
product line engineering in which the commonality and the variability of the product line
are defined and realized. [25].
Application Engineering derives the application from the platform, which is built by
domain engineering. Application engineering is the process of software product line
engineering in which the applications of the product line are built by reusing domain
artefacts and exploiting the product line variability [25].
Although lots of research has been conducted on benefits of using Software Product
Lines for software development and how to scope and define and develop product lines
but only few approaches and tools are available for product derivation and the way utilize
the product line [26].
Compared to the effort spending on developing and modeling the software product lines,
little support is available for enhancing their utilization in practice,. Without effective
approaches to utilize the product lines, particularly the automated approaches, SPL could
not be widely accepted in industry. In other words, they will be of more academic value
than practical value [23].
2.2. Service Oriented Architecture
Service Oriented Architecture is a software architectural model used for automation of
service composition. Service Oriented Architecture separates single business software
automation logic into several smaller units of logic. These smaller units are simpler,
distinct and distributed in nature. Loose coupling, abstraction and reusability of business
12
“Service Oriented Architecture is an information technology architectural approach that
supports the creation of business processes from functional units defined as services.”
[27].
In Service Oriented Architecture the reusability of code is considered of great importance
and thus all the smaller individual units of logic can be reused in several different
applications. A single or a group of these smaller units of logic which can work
independently are termed as Services. Service Oriented Architecture provides several
techniques for composing these services to build a complete business process. Service
Composition is the process of combining services based on the service selection.
Services are modules of business or application functionality. Service Oriented
Architecture consists of services, which are shared and reusable on an IT network and
they communicate with each other. This communication can either be held by data
passing between services or by coordination of two or more services for doing a common
activity [28].
In Service Oriented Architecture the reusability of code is considered of great importance
and thus all the smaller individual units of logic can be reused in several different
applications. A single or a group of these smaller units of logic which can work
independently are termed as Services. Service Oriented Architecture provides several
techniques for composing these services to build a complete business process. Service
Composition is the process of combining services based on the service selection.
Generally most of the approaches use SOAP.
13
1. Service Provider
The Service Provider is the component responsible for creating and publishing a service
to a registry. It also makes the service available to the other components through the
internet.
2. Service Requestor
The Service Requestor performs service discovery on the service registry to find the
needed service and then access that service.
3. Service Broker
The Service Broker component aides service providers and service requestors to find
each other by acting as the registry of services.
Figure 2.2 Basic Components of SOA
Service Broker
Service
Requestor ProviderService
Locate Publish
14
These SOA agents perform find, bind and publish operations. Service provider develops and publishes services’ descriptions and their access information in service registry.
Service requester tries to find the most suitable service in the service registry and by
means of available access information in service registry, will bind the required service to
the service provider to invoke required services [30]. Service Oriented Architecture helps
in achieving loose coupling between the services, abstraction and reusability of business
functionalities [30].
2.3 Integrating SOA and SPL
One of the major benefits claimed for SOA is the flexible building of IT solutions that
can react to changing business requirements quickly and economically. SOA promises a
vision where service providers offer their services and service requesters search and
discover these services based on their business needs. In SOA, service providers are
usually decoupled from service requesters, thus requesters and providers can change
independently of each other. In addition, application development is usually done by
assembling services rather than developing components and code. Further,
inter-organization collaboration can occur in a decentralized and highly distributed manner. As
a result, variability in SOA has different challenges to deal with than in non-SOA
systems [24].
Although, there are many differences between typical software product lines and
service-oriented architectures, SPL concepts can be used to model SOA variability. Since
services in SOA could be used by different clients with varying functionality, SOA
15
oriented systems can be modeled asservice families, similar to the concept of SPL. The
main goal of SPL is the reuse-driven development of SPL member applications by using
reusable assets from all phases of the development life cycle. This goal is similar to the
goal of SOA where flexible application development is a common theme [26].
However, SOA lacks in supporting high customization and systematic planned reuse. It
means that it is possible to use certain services for software development but if any
changes happen to the order or participants of service composition services, which are not
designed to be highly customizable and reusable, would not support variability. Thus SPL
engineering, which basically has the principle of variability, customization and
systematic planned reuse, can be used to aid SOA for better functionality and achieve
these benefits [18]. Furthermore, the integration of SPL and SOA concepts give the
ability of reusing existing services instead of continuously developing them from scratch
[27].
Combining Service Oriented Architecture and Software Product Line improves the
practical implementations of the Software Product Line. It makes the software
development process more efficient and improves the quality of the final software
product. It decreases development costs and effort, improve time to market, application
customized to specific customers or market segment needs and competitive advantages
[18]. The integration of SPL and SOA concepts give the ability of reusing existing
services instead of continuously developing them from scratch [27].
As a conclusion for this part the concepts of SPL and SOA are in no way mutually
16
2.4. Requirement Engineering
Requirement engineering is recognized as the most critical part of the entire software
development process [32]. Typically, over 40% of errors in a software project are from
requirement, while they need 10 more times of costs to repair than other errors. “Requirements Engineering (RE) is the systematic process of developing requirements
through an iterative cooperative process of analyzing a problem, documenting the
resulting observations in a variety of representation formats, and checking the accuracy of the understanding gained.” [31].
Traditional process-based or scenario-based requirement engineering methods predefine a
group of processes and corresponding guidelines. And the requirement engineering
activities and deliverables are carried out following the guidelines [31]. However, it is
very often that when the processes are ongoing, some important information is not
available yet. So, engineers have to repeat the processes, which results in project delay
and additional cost [32].
The process based requirement engineering methods predefine a group of processes and
corresponding guidelines, and the requirement engineering activities and deliverables are
carried out following these guidelines. But in most of the cases the requirements cannot
be frozen before the initiation of the development phase. Moreover very often during
these processes some important information is not available. In these cases the process is
required to repeat when this information is available, this increases the cost of
development and also delays the project.
Distinguished from traditional process-driven requirement engineering,
17
performed under the direction of domain knowledge. As a result, hidden information can
be retrieved and used to direct the requirement engineering process. The outcome is
expected to be more mature and complete, and rework can be dramatically reduced [32].
Ontology based requirement engineering is a knowledge-driven requirement engineering
method which has following major advantages:
1. It provides formal representation for both requirement documents and
knowledge
2. It describes the problem domain with varying degrees of formalization and
expressiveness
3. It is well suited as an evolutionary approach
4. It is used to support requirements management and improve requirement artefacts’ traceability [33].
The previous thesis from the same research group, which has been conducted by Zhang
[15], is titled as “An Interactive Approach of Ontology-Based Requirement Elicitation”.
In that project a requirement elicitation approach has been proposed for SOA-based SPL
engineering as a programming model for realizing the interactive requirement
engineering [15].
2.5. Requirement Elicitation
One of the essential tasks of Requirement Engineering during software engineering is
Requirement Elicitation. Researches show that a major cause of problems in software
18
of software product line, which is a software developments paradigm, is requirement
elicitation process, which shows the commonalities and differences of the requirements
[26].
There are different techniques that can be used for requirement elicitation. These
techniques are either conversational which is mainly conducted by interviews with two or
more people, observational which can be done by observing people when they are
carrying out their routine job, analytic which means exploring existing documentation or
knowledge gained from either conversation or observation and synthetic which is
combining conversation, observation and analytic methods into a single method. In
practice these techniques are not adequately applicable [32].
In [33] it is mentioned that useful, useable and desirable software products are created
using interaction design. Software developers do not benefit from interaction design
though. The tools that software developers use for developing are insufficient and not
appealing for them. Although the importance of using Human-Computer Interaction
(HCI) concept in Software Development Process (SDP) is not very clear for many
software developers, HCI experts have been tried to show that the integration between
these two, can cause better user satisfaction derived from a user-centered SDP [34].
However, conducting an interactive software engineering paradigm is still an issue.
One possible idea is to take advantage of both SOA and SPL concepts. SOA can be used
in order to make it easier for the software engineers by introducing services as loosely
coupled software functionalities eliminating the lower-level complexity. On the other
hand SPL is useful for managing the variable software engineering. In interactive
19
assets and implementing the candidate application by composing the ordered services
[15].
The previous thesis from the same research group, which has been conducted by Zhang
[15], is titled as “An Interactive Approach of Ontology-Based Requirement Elicitation”.
In that project a requirement elicitation approach has been proposed for SOA-based SPL
engineering as a programming model for realizing the interactive requirement
engineering [15].
The proposed interactive model is a dialogue-based system, which interacts with users in
a natural language. The way dialogue system works is, it extracts and analyses the
expressions produce by human-beings users in order to accomplish a task and generates
an expression in a natural language for the user accordingly. Therefore, dialogue system
can be a convenient way for human-machine interaction.
In the previous proposed dialogue system, slot-filling tasks is considered for the
requirement elicitation process, in which the user knows about the goals and has the
information about doing the task. These tasks will be done based on knowledge base of
the dialogue system. Ontology represents the common knowledge within a domain. It
means that it provides shared vocabulary to construct the concepts, objects and their
properties and relations of a domain or a task, which can cause common understanding of
the structure of information between people or software agents. By using ontology, the
common concepts of a domain can be defined by experts and the knowledge can be used
by people with any background and without professional training [15].
To develop ontology, the concepts in the domain should be defined, and a hierarchical
20
also should be defined. At the end the instances and the values for slots of instances
should be filled [41].
The model developed in the previous project, integrates the requirement engineering
knowledge with service-oriented knowledge. Since SOA encapsulates application
functionalities into loosely coupled services, software applications can be implemented
by discovering, composing and invoking services in SOA. The ontology of services
makes automatic service discovery and composition possible [50]. In ontology there
exists a class called ServiceProfile, which contains the characteristics of services and is used to match with the client’s requests. It happens in this way that for the reason of
discovering services, the ServiceProfile of the requestor automatically will be matched with the provider’s ServiceProfile through semantic capability matching [50] and if the
matching succeeds the desired services are found.
In the domain of requirement elicitation the requirements can be classified into three
categories of function, quality and softgoal. Each of these categories have different roles
in the system and also for all of them another factor called rank is defined which is
needed to direct the requirement elicitation process and is expressed in the ontology
model. Functions are the functionalities in the system that the user can order. Quality is a
non-functional constraint that imposed on a function. Softgoals are non-functional
constraints impose on the whole system environment. In between each of these three
types of requirements, some relationships exist such as generalize, decompose, rely,
contradict, associate, hasRank and invalid. These relationships will be discussed briefly
21
Generalize relationship is defined to show that an instance of function, quality and
Softgoal is also an instance of requirement.
When requirement 𝑥 decomposes to y, y is a less complex requirement of the
same type as x.
Requirement x relies on requirement y it means that realization x relies on
implementation of y.
When requirement x and requirement y contradict it means they are not supposed
to be realized with each other in the product software at the same time.
Function x associates with quality y.
HasRank relationship shows that requirement x has a unique rank r.
Invalid relation ship shows that there is an invalid relationship between
requirements x and y.
For instantiating the ontology model, first all these relationships should be established
between the available requirements and the following procedure will show the
instantiation of the ontology [15]:
1. The main functions which are the roots of the decomposition tree will be
identified
2. If any children of the root contribute to the composition with their parent, they
should be decomposed by the Decompose relationship and if the children of
children are also decomposable the same story should be repeated on them till
there is no composition between parents and children.
3. All the quality constraints should be found and the associate relationship
22
4. Sofgoals should be identified and decomposed.
5. Rely and contradict relationships should be established
6. A rank should be assigned to each of the requirements based on their
importance.
Based on what has been discussed a graph as Figure 2.1 will be produced.
Figure 2.3. Requirement model instantiated with book locating service [19]
The requirements will be offered to the user one by one based on the rank assigned to
them and the user should choose from them. If the requirement is essential it will be
picked automatically and regardless user’s opinion. The functions will be evaluated first
and after that all the qualities and evaluation of softgoals will be followed. All the
23
requirement ‘A’, the requirement ‘B’ which has the rely relationship with the requirement ‘A’ will be dropped as well. If a requirement ‘C’ is decided to be picked by the user and
another requirement ‘D’ has the contradict relationship with the requirement ‘C’ will be
24
Chapter 3
Software Visualization
3.1. Software Visualization
Card et al. define visualization as “the use of computer supported, interactive, visual
representations of data to amplify cognition” [5]. In simple words Visualization is the
graphical/visual representation of any knowledge to make the understanding easier.
Visualization aids in simplifying the complex ideas for better understanding.
Software Visualization is the process of producing the visual image of a software system
for the better understanding. There are different aspects of a software system which can
be visualized, generally the structure of the software, major algorithm, simpler
components of the software or the runtime behavior are visualized.
Software Visualization can be defined as “a representation of computer programs,
associated documentation and data that enhances, simplifies and clarifies the mental
representation the software engineer has of the operation of a computer system” [36]. The
use of software visualization helps in the easier understanding of the software system and
thus it reduces the effort and time spent on different phases of the software development
and software customization. By means of visualization, developers and stakeholders can
obtain an overall point of view of the software structure, software logic or explain and
communicate with the development process [39]. Generally, software visualization is
mainly used for program behavior exhibition, logical debugging and performance
debugging but it is fundamentally concerned with software comprehension [37]. By
25
understanding of the system can be more promising than textual representation of the
software [39].
Software visualization needs not be attractive or impressive but it should evoke visual
understanding for better software comprehension. Software Visualization facilitates the
human understanding and effective use of computer programs by relying on the crafts of
typography, graphic design, animation, cinematography, and interactive computer
graphics [36]. In overall graphical visualization can provide so many other benefits faster
learning, faster use and problem solving, more charming etc. [37].
The major problem in the implementation of the software visualization a wide variety of
applications is the lack of scalability and flexibility. Most of the visualizations
implemented these days are specific to the needs of that particular project or software.
The software visualizations implemented for a specific scenario are not easily
transferrable to another scenario.
The visualization of a software deals with the representation of the software component
in some visual form. For a different application the visualization needs to be changed
according to the needs of the new systems. To solve this problem a few generalized
software visualizations have been created so that they can be used across different areas.
But in case of these generalized software visualizations, generally the visualization is too
general to be practically implemented in a certain area of application. In order to use
these generalized visualizations a lot changes are required to use these in a specific area.
The efforts needed to be put into this are generally way too much compared to the
26
Software is an intangible object which cannot be physically seen or felt. Software
Visualization deals with the representation of the intangible software entities in the form
of something tangible [10]. In software system we have a large amount of information,
and it is hard to decide what information software visualization needs to represent in
order to make the software comprehension easier.
The Software Visualization should be designed in such a way that it can provide all the
required information in such a visual format which makes the information easy to
understand. The level of detail should be decided such that the information provided
through the visualization should neither be too general nor too specific.
3.2. Visual Representations
Software is an intangible object which cannot be physically seen or felt. Software
Visualization deals with the representation of the intangible software entities in the form
of something tangible [10]. In software system there is large amount of information, and
it is hard to decide which information software visualization needs to represent in order to
make the software comprehension easier.
The Software Visualization should be designed in such a way that it can provide all the
required information in such a visual format which makes the information easier to be
understood. The level of detail should be decided such that the information provided
through the visualization should neither be too general nor too specific. Generally a
single visualization is used for different users, but this provides information which is too
27
There are number of visualization techniques available for implementing software
visualization. Different types of visual elements like points, lines, shapes, trees, graphs,
texts, textures can be used to represent different entities and attributes. In some cases
more than one visualization technique can be applied for a system [9].
There are different perspectives of the visual representations on the basis of which we can
categorize different software visualization techniques. The visualizations can be static or
dynamic based on the nature of the visual technique used. The static visualization do not
comprehend the changes on runtime. An example of static visualization is view of the
source code with colors [9]. Dynamic visualization changes over every time based on
information from the analysis of execution of a program [10] and the data generated at
the runtime such as data flow or control flow [7].
On the basis of the number of dimensions most commonly visualizations are Two
Dimensional or Three Dimensional. Two-dimensional software visualization tools mainly
involve graph or treelike representations, which may contain many nodes and arcs. In
some cases there can be too much information which cannot be easily represented in two
dimensions, in these cases the need of extra spatial dimension is required, which makes
the visual representation of the information much easier [56].
The best suited visualization technique should be chosen keeping mind the target users
for the visualization, the complexity of the visualization, and goal of the visualization.
The level of knowledge and experience of the users should be considered while using a
particular type of visual representation. The usages and limitations of the existing system,
which is going to be visualized, should also be investigated [56]. The technique that
28
3.3. Software Visualization Techniques
The main purpose of using visualization in a system is to make it more comprehensible
and easy to use for the users. The visualizations help users to have a more clear and
precise point of view of the system while spending lesser time on the system. It will
happen in this way that instead of reading the comments and memorizing the structure of
the system, users will see the flow of the system dynamically while working with the
text-based system. With the use of the visualizations users have an overview of the
system in front of them. Different visualizations can provide different information about
the users or they can provide the same information in different ways. These different
visualizations can be used for different types of users to provide them the information
they need and which helps them using the system more efficiently and effectively while
decreasing the number of errors or mistakes made by the users while using the system.
The dialogue-based software is used in requirement elicitation phase of software
development process. In a dialogue-based software system the user interacts with the
software by responding to the software with the best possible inputs. The system is SOA –based and so in order to make the requirement elicitation process easier for the user with
the help of visualization, the visualization should be selected keeping in mind that it
should be well suited for the SOA-based systems. Service Oriented Architecture (SOA)
has a layered architecture so in many papers [18, 27, 28, 29] it is discussed that the appropriate approach for SOA visualization is a layered approach. It is one of the SOA’s
advantages that multiple perspectives within an organization can be taken into account
29
layer, the flow of the activities, which are being processed in the system, can be shown.
The next layer can visualize the services and the relationships between them. Even more
layers such as application layer which shows the implementation of the functionalities
provided by services in the service layer in more details, can be used depending on the
level of abstraction and the type of users [9].
The required visualization methods should be dynamic in order to show the flow of the
system. Also, because in some parts of the system some services have the same rank to be
evaluated the chosen visualization technique should be able to show the concurrency and
parallelism. Because SOA is used in this system, then it should provide a layered design
for visualization. For choosing the number of dimensions for the system, both two and
three-dimensional can be chosen depending on the level of details needed to be
illustrated. The main objects, which should be visualized, are few tasks such as
Evaluation, Pre-Evaluation, Picking (Yes) and Abandoning (No), that are repeatedly
being performed in the system. There is a flow in the system, which shows the order of
firing of the tasks in the system. This flow should be clearly presented to the users. Also
existing services, which are the very requirements that are going to be elicited, should be
depicted.
Complexity is another major factor while choosing a suitable visualization technique. The
complexity of the used visualization should be such that the visualization should be
self-explanatory and the process of understanding the visualization should not be time
consuming or should not require too much effort on the part of the user. But the
complexity can be relative in case of human computer interactions. Different users with
30
based on their expertise. So the visualizations should be chosen in such a way that they
are suitable for a large group of users.
Many graphical visualization techniques exist that can depict the concept and the
workflow of the interactive requirement elicitation system. A list of the most suitable
techniques, which can be used to visualize the workflow of software systems along with
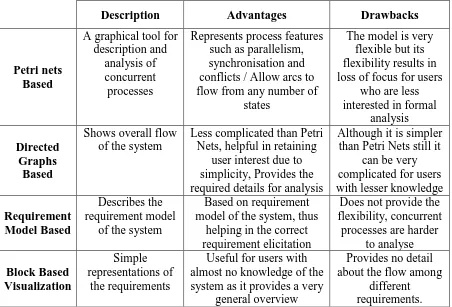
their advantages and limitations, is shown in Table 3.1.
Description Advantages Drawbacks
Petri nets Based
A graphical tool for description and
analysis of concurrent processes
Represents process features such as parallelism, synchronisation and conflicts / Allow arcs to flow from any number of
states
The model is very flexible but its flexibility results in loss of focus for users
who are less interested in formal
analysis
Directed Graphs
Based
Shows overall flow of the system
Less complicated than Petri Nets, helpful in retaining
user interest due to simplicity, Provides the required details for analysis
Although it is simpler than Petri Nets still it
can be very complicated for users with lesser knowledge
Requirement Model Based
Describes the requirement model
of the system
Based on requirement model of the system, thus
helping in the correct requirement elicitation
Does not provide the flexibility, concurrent
processes are harder to analyse Block Based Visualization Simple representations of the requirements
Useful for users with almost no knowledge of the system as it provides a very
general overview
Provides no detail about the flow among
different requirements.
31
3.4. Different Types of Visualizations
3.4.1. Petri Net based Visualization
Petri net is a type of visual communication tool same as flow chart or other software
development diagrams but the main advantage of Petri net is, it can be used to analyze and simulate the concurrent and dynamic activities of systems” [24]. Petri nets are a very
well-known formalism technique for demonstrating the workflow behavior of the system.
Petri-net for the first time was presented by C.A.Petri in 1962 and since then lots of
researches focused on petri nets. The ability to clearly represent the concurrency related
concerns like parallelism, synchronization and etc. in a graphical way is one of the best
advantages of petri nets [25].
Figure 3.1. An example of a Petri net [26]
Petri-net has initial marking 𝑀0 and two types of nodes called places and transition,
which are illustrated by circles and rectangles respectively. An arc will connect each
place to a transition and each transition to a place. A marking is assigned to each place
demonstrates the number of tokens existing in that place. If marking of a place is zero, it
means that place is empty.
There are some rules, which are known as firing rules and are applicable to a petri-net
32
1. A transition t is called enabled when there is at least one token in each input
place p of t.
2. An enabled transition t will be fired when its associated event occurs.
3. The firing of enabled transition t removes one token from each input place p
of t and adds one token to each output place p of t [24].
A petri net is a 3-tuple <P, T, W> where:
𝑃 = {𝑝1, 𝑝2, 𝑝3, … , 𝑝𝑚} is a finite set of places
𝑇 = {𝑡1, 𝑡2, 𝑡3, … , 𝑡𝑚} is a finite set of transitions
𝐹 ⊆ (𝑃 × 𝑇) ∪ (𝑇 × 𝑃) is a set of arcs from a place to a transition or from
a transition to a place (flow relationship) [24].
3.
4.2. Directed Graph Based Visualization
A graph is defined as a representation of a set of objects where some pairs of these
objects are connected to each other. The interconnected objects are known as vertices and
the connections between these vertices are called edges. A graph in which each graph
edge is replaced by a directed graph edge is called directed graph. The directed graphs do
not have multiple edges or loops.
An arc e = (x,y) is considered to be directed from x to y; y is called the head and x is
called the tail of the arc; y is said to be a direct successor of x, and x is said to be a direct
predecessor of y. If a path made up of one or more successive arcs leads from x to y,
then y is said to be a successor of x, and x is said to be a predecessor of y. The arc (y,x) is
33
Figure 3.2. An example of a Directed Graph
3.4.3. Requirement Model Based Visualization
The requirement model provides the overview and structure of the requirement elicitation
process in this system. The requirement model can be used for explaining the requirement
elicitation process graphically. So a requirement based visualization method can used to
provide the overview of the requirements and their relationships with each other.
The Requirement Model Based Visualization provides an effective method for the
graphical visualization of the system. This visualization very helpful for the users to
understand the requirements of the system and they can easily keep track of all the
requirements and their relationships (which requirement is dependent upon other
requirement or which requirement is essential or which requirements have to be selected
in tandem). It gives an easier overview of the requirements and makes it easier for the
user to know which requirements have been selected and which requirements have been
34
3.4.4. Block Based Visualization
Simple visualization methods can provide the user with the basic information about the
system while hiding the complexity of the system from the user. A visualization can be
regarded as simple if it is self-explanatory to most of the users. The visualization should
fundamentally provide a user an overview of the system and the current status or progress
that has been made at that point of time.
The Block based visualization can be used for this purpose. In case of the Block Based
visualization the basic operations or actions are represented as simple blocks. In case of
the requirement elicitation system, a block based visualization method can be used such
that the requirements are represented by these simple blocks. The block based
visualization provides an overview of all the requirements and does not deal with the
connection and links between these requirements. The user is given an overview of which
requirement has been selected and which requirement has been dropped.
35
Chapter 4
Proposed Interactive Approach of Visualization
4.1. Introduction
In any Software Development Life Cycle or Software Product Line Engineering there are
many users working on a single software system. These users work in different groups or
teams, each team has an assigned work, and members of a team have similar work. These
users work on different aspects of the software systems. In the Software Product Line
System based on SOA the mass software customization is made easier by using the
smaller software artefacts as the building blocks for the software system.
In the previous research conducted by Vida Sadri Petri Net Based Visualization is used in
the system to help the users interact with the dialogue-based system. As mentioned in the
[16] the main group of people who are going to take advantage of this visualization
should be software developers. However, it is a good idea to make it also easy for people
with business background to use this software in order to develop their required systems
by themselves. In this thesis, the main focus is to limit the visualization to the people with
computer background specially software developers. It is a difficult job to keep both
groups with diverse expectations from the system satisfied.
The system has been tried to be designed in a way that, working with it, be as easy as
possible even for people with no specific experience in working with computers.” So in
the Petri-Net Based Visualization system the main emphasis is on the users who have
knowledge about the software systems as well as some experience with the development
36
research that the system was not as useful for the people with lesser knowledge about the
software development process.
4.3. The Structure of the Proposed Method
The interactive visualization approach has to be included as the part of the previously
developed system. The Petri Net based system based system designed previously by Vida
Sadri [17] consists of five components: Dialogue Interface, Graphical Visualization, I/O
Controller, Dialogue Manager and Knowledge Base. The Interactive Visualization
component will be added to the system between Graphical Visualization and I/O
Controller components.
In the previous system the answers were passed from the Graphical Visualization
component to the I/O Controller. But in the new system the answer will be passed
through the Interactive Visualization component. The Interactive Visualization
component decides the best suitable visualization for the user. The graphical visualization
component will provide the user with that particular visualization. The answer form the Interactive visualization will be passed to the I/O controller. The user’s answer is
accepted and passed to Dialogue Manager if it matches with the saved answer options, if
not user is asked to enter correct answer. The user’s answer will be converted to the
format that can be processed by the machine and will be passed to the dialogue manager.
The dialogue manager will consult the ontology knowledge base and will generate an
answer subsequently. This answer will be passed to the I/O controller and visualization
37
the changes occur in the system on the graphical interface. These changes will be shown
by token moves and color changes in the visualizations and background services.
Figure 4.1. Structure of Proposed Method
4.4. Contextual Control Model
Contextual Control Model was developed by Hollanagel to control and analyze team
behavior based on cognitive modes. In this model the system decides what action to take
next according to the context of the situation. The behavior is analyzed at macro level
instead of the micro level [56].
Interactive Visualization Graphical Visualization Dialogue Interface
Ontology Knowledge Base I/O Controller
38
A contextual control model implies that actions are determined by the context rather than
by any inherent relations between them. The focus of a contextual control model is
therefore on how the choice of next action is controlled rather than on whether certain
sequences are more proper or likely than others.
There are four different modes for the control. These are:-
1. Scrambled
The choice of next action is completely unpredictable or haphazard. Scrambled
control characterizes a situation where there is little or no thinking involved in
choosing what to do.
2. Opportunistic
The next action is chosen from the current contest alone based on the salient
features rather than on more durable intentions or goals. The person does very
little planning or anticipation, perhaps because the contest is not clearly
understood.
3. Tactical
Performance is based on some kind of planning, hence more or less it follows a
known procedure or rule. Planning is however of limited scope and the needs

![Figure 2.3. Requirement model instantiated with book locating service [19]](https://thumb-us.123doks.com/thumbv2/123dok_us/1410800.1173679/35.612.156.491.234.526/figure-requirement-model-instantiated-book-locating-service.webp)
![Figure 3.1. An example of a Petri net [26]](https://thumb-us.123doks.com/thumbv2/123dok_us/1410800.1173679/44.612.110.526.369.444/figure-an-example-of-a-petri-net.webp)


![Figure 4.2: Internal structure of Contextual Control Model [56]](https://thumb-us.123doks.com/thumbv2/123dok_us/1410800.1173679/52.612.122.457.228.426/figure-internal-structure-contextual-control-model.webp)