ABSTRACT
CONNELLY, COLLEEN MARIE. Discovery and Application of Small Molecule Regulators of MicroRNA Function. (Under the direction of Alexander Deiters).
MicroRNAs (miRNAs) are small non-coding RNAs that act as post-transcriptional gene regulators and have been shown to control many biological processes including embryonal development, cell differentiation, apoptosis, and proliferation. Recently, variations in the expression of certain miRNAs have been linked to a wide range of human diseases, including cancer and viral infections, identifying miRNAs as potential targets for drug discovery. Several tools have been developed to control the function of individual miRNAs and have been applied to study their biogenesis, biological role, and therapeutic potential; however, these common methods face obstacles as probes to explore the role of miRNAs in human disease and as potential therapeutic agents. The research presented here attempts to expand on the available tools to study miRNA biogenesis and function. Small molecule modifiers of miRNAs could be useful tools to explore the detailed mechanisms of miRNA biogenesis, regulation, and misregulation in disease and can further serve as lead structures for the development of new therapeutic agents. Thus, cell-based reporter assays to discover RNA-specific modifiers of miRNA function were developed. These assays were successfully applied to the identification of small molecule modifiers of 21 and miR-122, which were optimized through structure-activity relationship studies and secondary assays. In addition, the mechanism of action of these small molecule modifiers and their potential as therapeutic agents against various cancers and hepatitis C viral infection were investigated.
Discovery and Application of Small Molecule Regulators of MicroRNA Function
by
Colleen Marie Connelly
A dissertation submitted to the Graduate Faculty of North Carolina State University
in partial fulfillment of the requirements for the degree of
Doctor of Philosophy
Chemistry
Raleigh, North Carolina 2014
APPROVED BY:
_______________________________ ______________________________ Dr. Alexander Deiters Dr. Gavin Williams
Co-chair of Advisory Committee Co-chair of Advisory Committee
________________________________ ______________________________
ii DEDICATION
To my amazing parents Lisa and Kevin Connelly for their constant support and unconditional love.
To my sisters and best friends Taran and Leslie for their inspiration, motivation, and most importantly their ability to make me laugh no matter what the circumstances.
To the beautiful new addition to our family, my niece Aranel Natalie.
To my entire family for their motivation, support, and understanding, even when I couldn’t make it home for holidays and special events.
iii BIOGRAPHY
iv ACKNOWLEDGMENTS
v Rajendra, James, Jihe, Christoph, Jordan, Elwin, and Sarah, thank you for your valuable time and your hard work.
For their friendship, encouragement and inspiration, I would like to thank all of the past and present members of the Deiters Group. They have made my time in graduate school so much more fulfilling, entertaining, and bearable. In particular, I would like to thank my girls Kalyn, Jessica, Little Girl, Jeane, Qingyang, Meryl, Laura, Ji, Yan, and Jie, for always being there for venting, laughing, dancing, and drinking. I also want to thank the boys, specifically Rajendra, Doug, Alex P., Matt, Jihe, Sander, James, Andrew, Hank, Harry, and Chad. A special shout out to the orphans at NCSU for getting through the past semester together. Additionally, I would like to thank all the members of the Melander, Williams, Ghiladi, Comins, and Yoder labs for always lending a helping hand and allowing me to use their equipment.
I will be forever grateful to my amazing family and friends who have shown me vast amounts of love, support, and understanding. They have made my life enjoyable and meaningful. I thank you all from the bottom of my heart.
vi TABLE OF CONTENTS
LIST OF TABLES ... x
LIST OF FIGURES ... xi
LIST OF SCHEMES ... xxxiv
CHAPTER 1: INTRODUCTION TO MICRORNAS ... 1
1.1 MicroRNA Biogenesis and Function ... 2
1.2 MicroRNAs in Disease ... 4
1.3 Endogenous Regulation of MicroRNAs ... 7
1.4 Oligonucleotides as Tools for MicroRNA Regulation ... 12
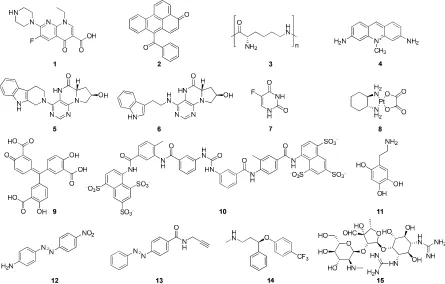
1.5 Small Molecules as Tools for MicroRNA Regulation ... 17
1.5.1 Small Molecule Modifiers of MicroRNA Function as Molecular Probes ... 18
1.5.2 Small Molecule Modifiers of MicroRNA Function as Potential Therapeutics ... 19
1.5.3 Discovered Small Molecule Inhibitors and Activators of MicroRNA Function ... 20
CHAPTER 2: SMALL MOLECULE REGULATION OF MICRORNA MIR-21... 29
2.1 Introduction to MicroRNA miR-21 ... 29
2.1.1 miR-21 in Cancer ... 30
2.2 Previous work: Development of a Reporter Assay for miR-21 Function and its Application to the Discovery of the First Small Molecule Inhibitors of miR-21 ... 33
2.3 Structure Activity Relationship Studies of the Discovered miR-21 Inhibitor 13 ... 44
2.4 Discovery of Small Molecule Inhibitors of miR-21 through High-throughput Screening ... 48
2.4.1 Validation of Potential Ether-amide miR-21 Inhibitors... 51
2.4.2 Validation of Potential N-acylhydrazone miR-21 Inhibitors ... 53
2.4.3 Validation and SAR Studies of the Oxadiazole miR-21 Inhibitors ... 62
2.3.4 Validation and SAR Studies of the Aryl-amide miR-21 Inhibitors ... 74
2.5 Investigations into the Mechanism of Action of the miR-21 Inhibitors ... 85
2.5.1 Recovery of Inhibition by Transfection of Precursor miR-21 ... 85
2.5.2 Target Identification Experiments for the miR-21 Inhibitor 13... 88
2.5.3 Target Identification Experiments for the miRNA Inhibitor 35 ... 106
2.6 Application of Small Molecule Inhibitors of miR-21 as Therapeutics ... 111
vii 2.6.2 Combination Treatments of the miR-21 Inhibitors with Chemotherapeutic Agents
from the COMBO Screening Library ... 118
2.6.3 Combination Treatments of the miR-21 Inhibitors with Chemotherapeutic Agents Based on Previous Literature Reports... 123
2.6.4 Assessment of Combination Treatments of the miR-21 Inhibitors with Chemotherapeutic Agents using Clonogenic Assays ... 126
2.7 Summary and Outlook ... 132
2.8 Experimental ... 134
CHAPTER 3: SMALL MOLECULE REGULATION OF MICRORNA MIR-122... 142
3.1 Introduction to MicroRNA miR-122 ... 142
3.1.1 miR-122 in Hepatocellular Carcinoma ... 143
3.1.2 miR-122 in Hepatitis C Virus Infection ... 144
3.2 Design and Development of a Luciferase Based Sensor for Endogenous miR-122 .. 146
3.3 Discovery of Small Molecule Modifiers of miR-122 ... 154
3.3.1 Pilot Screening for Inhibitors and Activators of miR-122 ... 154
3.3.2 Validation of miR-122 Modifiers through Secondary Assays ... 166
3.4 Structure-Activity Relationship Studies ... 170
3.4.1 SAR Studies on the miR-122 Small Molecule Inhibitor 139 ... 171
3.4.2 SAR Studies on the miR-122 Small Molecule Inhibitor 140 ... 176
3.4.3 SAR Studies on the miR-122 Small Molecule Activator 141 ... 185
3.5 High-throughput Screening for Small Molecule Modifiers of miR-122 ... 189
3.5.1 Development of a Stable Cell Line for High-throughput Screening ... 191
3.5.2 Optimization of qRT-PCR Assay Conditions in Huh7 cells ... 199
3.5.3 High-throughput Screening for Small Molecule Inhibitors of miR-122 ... 207
3.5.4 High-throughput Screening for Small Molecule Activators of miR-122 ... 220
3.6 Summary and Outlook ... 231
3.7 Experimental ... 232
CHAPTER 4. SMALL MOLECULE MODIFIERS AS TOOLS TO EXPLORE MIR-122 REGULATION AND THERAPEUTIC POTENTIAL ... 261
4.1 Investigations into the Mechanism of Action for the miR-122 modifiers ... 261
4.1.1 Analysis of the Small Molecule Interaction with pre-miR122 ... 261
viii
4.1.3 Analysis of the Small Molecule Interaction with the miR-122 Promoter ... 291
4.2 Application of Small Molecule Modifiers of miR-122 as Therapeutics... 296
4.2.1 Application of the Small Molecule Inhibitors of miR-122 to the Reduction of Hepatitis C Virus Replication ... 296
4.2.2 Application of the Small Molecule Activator of miR-122 to the Treatment of Hepatocellular Carcinoma ... 299
4.3 Summary and Outlook ... 302
4.4 Experimental ... 304
CHAPTER 5: DEVELOPMENT OF REPORTER ASSAYS FOR ADDITIONAL DISEASE-REALTED MICRORNAS ... 316
5.1 Development of Reporter Assays for miR-221 and miR-222 Function and Pilot Screening for Small Molecule Inhibitors of miR-222 ... 317
5.1.1 Introduction to miR-221 and miR-222 ... 317
5.1.2 Reporter Assay Development and Validation... 321
5.1.3 Pilot Screening for Small Molecule Inhibitors of miR-222 ... 331
5.1.4 Summary and Outlook ... 343
5.2 Design and Development of a Luciferase Based Sensor for Endogenous miR-155 .. 346
5.2.1 Introduction to miR-155 ... 346
5.2.2 Reporter Assay Development and Validation for Small Molecule Screening .... 347
5.2.3 Summary and Outlook ... 357
5.3 Design and Development of a Luciferase Based Sensor for Endogenous miR-27b .. 357
5.3.1 Introduction to miR-27b ... 357
5.3.2 Reporter Assay Development and Validation for Small Molecule Screening .... 358
5.3.3 Summary and Outlook ... 361
5.4 Experimental ... 362
CHAPTER 6: SPATIOTEMPORAL CONTROL OF MICRORNA FUNCTION USING LIGHT-ACTIVATED ANTAGOMIRS ... 373
6.1 Introduction to MicroRNA Antisense Agents ... 373
6.2 Development of Light-Activated Antagomirs ... 374
6.2.1 Introduction to Molecular Caging ... 375
6.2.2 Design and Synthesis of Light-Activated Antagomirs ... 376
ix
6.5 Summary and Outlook ... 392
6.6 Experimental ... 393
CHAPTER 7. SMALL MOLECULE SCREENING FOR INHIBITORS OF HFQ-BINDING SRNAS IN ESCHERICHIA COLI ... 400
7.1 Introduction to Hfq-binding small RNAs ... 400
7.1.1 Introduction to E. coli Spot 42 sRNA ... 404
7.2 Design and Development of a Reporter Assay for Spot42 Function ... 406
7.3 Validation of the Reporter Assay for Small Molecule Screening... 409
7.4 Pilot Screening for Small Molecule Inhibitors of Spot42 ... 416
7.5 Summary and Outlook ... 420
7.6 Experimental ... 422
x LIST OF TABLES
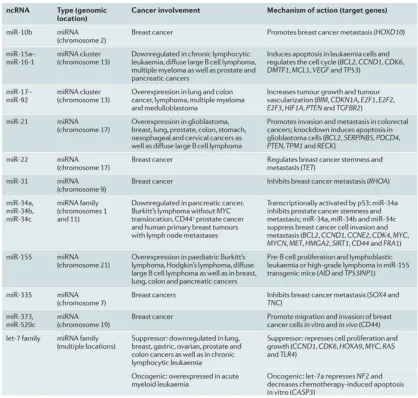
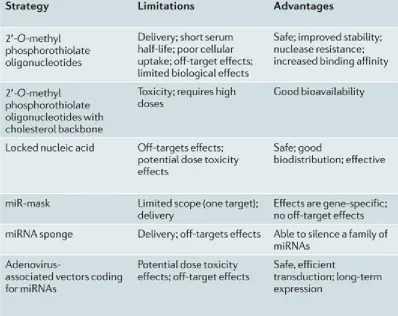
Table 1.1. Select microRNAs that are misregulated in cancer. Adapted by permission from Macmillan Publishers Ltd: Nat. Rev. Drug Discov. 2013, 12, 847...7 Table 1.2. Limitations and advantages of oligonucleotide based tools for microRNA
regulation. Adapted by permission from Macmillan Publishers Ltd: Nat. Rev. Drug Discov., 2010, 9, 775...17 Table 4.1 Protein identification results for mass spectrometry analysis of rhodamine-labeled target proteins excised from a 2-D gel (data provided by Nedyalka Dicheva, UNC Michael Hooker Proteomics Center)...285 Table 4.2. Protein identification results for mass spectrometry analysis three separates
xi LIST OF FIGURES
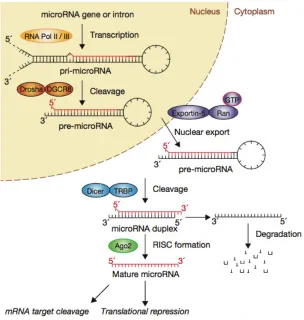
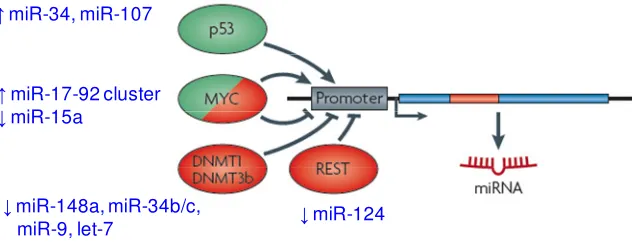
Figure 1.1. The miRNA pathway depicting the transcription and processing of miRNAs and the miRNA induced translational repression of target mRNAs. Adapted by permission from Macmillan Publishers Ltd: Nat Cell Biology, 2009, 11, 3, 228. ... 4 Figure 1.2. Many transcription factors regulate miRNA expression in a tissue-specific or developmental-specific manner. Transcriptional activators or repressors are shown in green and red, respectively. Examples of the miRNAs regulated by each transcription factor are indicated in blue. MYC stimulates expression of the miR-17-92 cluster in lymphoma cells, but inhibits expression of several tumor suppressor miRNAs (e.g., miR-15a). p53 stimulates the expression of miR-34 and miR-107, which enhances cell cycle arrest and apoptosis. The RE1 silencing transcription factor (REST) is down-regulated upon differentiation, allowing for high miR-124 expression in post-mitotic neurons. Transcription of miR-148a, miR-34b/c, miR-9 and let-7 are dependent on their gene promoter methylation status, which is regulated by the DNMT1 and DNMT3b DNA methyltransferases. Adapted by permission from
Macmillan Publishers Ltd: Nat. Rev. Genet. 2010, 11, 597-610. ... 10 Figure 1.3. Common chemical modifications of AMOs include a 2ʹ-methoxy group (2ʹ -OMe), a 2ʹ-fluorine atom (2ʹ-F), a methylene bridge connecting the 2′-O and 4′-C of the ribose ring (LNA) and a phosphorothioate linkage (PS RNA). Base is either a purine motif (adenine or guanine) or a pyrimidine motif (cytosine, uracil, thymine). ... 14 Figure 1.4. Small molecule modifiers of the miRNA pathway. Compounds that modulate miRNA or siRNA processing in a general fashion include enoxacin (1), anthracene derivative 2, poly-L-lysine (3), trypaflavine (4), ATP analogs 5 and 6, 5-fluorouracil (7), oxaliplatin (8), aurintricarboxylic acid (9), suramin (10), and oxidopamine (11). Specific small molecule inhibitors of miRNAs include the diazobenzene miR-21 inhibitors 12 and 13, fluoxetine (14), and streptomycin (15). ... 27 Figure 2.1. NesCre8 mir-21LSL-Tetoff mice were engineered to conditionally express miR-21 in the absence of doxycyline. NesCre8 mir-21LSL-Tetoff mice were taken off doxycycline at birth and within 2 months, adults developed signs of lymphoma such as swollen lymph nodes (lymphadenopathy). After the development of signs of lymphoma, the mice were fed
xii presence of a small molecule inhibitor of miR-21 function, the luciferase expression is
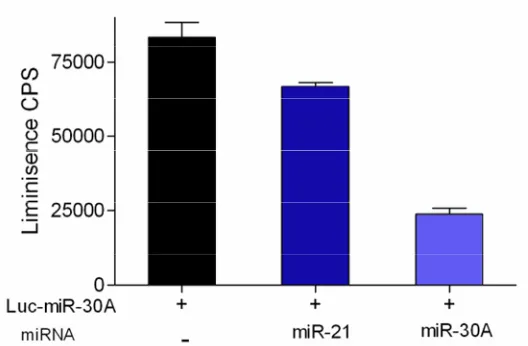
restored and an increase in luminescence is detected. ... 34 Figure 2.3. Assessment of the developed reporters to detect endogenous 21 and miR-30A. Due to the elevated expression of miR-21, HeLa cells stably transfected with construct containing the miR-21 target sequence displayed reduced firefly luciferase expression compared to the control plasmid containing no miRNA binding sequence. Adapted with permission from Angew. Chem. Int. Ed. 2008, 47, 7482. ... 35 Figure 2.4. Determination of the specificity of the developed reporters for the specific target miRNA. Luciferase expression was significantly reduced in cells expressing exogenous 30A and the Luc-30A reporter compared to cells that contained the mismatched miR-21/Luc-miR30A combination. Adapted with permission from Angew. Chem. Int. Ed. 2008, 47, 7482... 36 Figure 2.5. Inhibitors 12 and 13 of microRNA miR-21 discovered from the screening of a library of small molecules using a luciferase-based assay system in HeLa cells. Adapted with permission from Angew. Chem. Int. Ed. 2008, 47, 7482. ... 37 Figure 2.6. Compounds assayed to elucidate an improved miR21 inhibitor. The blue
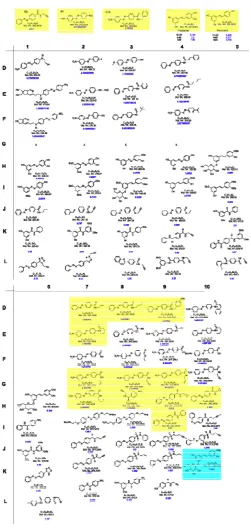
numbering indicates the fold increase in activity relative to a DMSO control. The most active compounds are indicated by blue and yellow shading. Experiments performed by Dr.
Douglas Young. ... 38 Figure 2.7. A. Change in the luciferase signal of the stably transfected HeLa cells treated with 13 (10 µM) relative to a DMSO control. B. Dose-response curve for 13 revealing an EC50 value of 2 µM. The error bars indicate the standard deviation determined from three
independent measurements. Adapted with permission from Angew. Chem. Int. Ed. 2008, 47, 7482... 39 Figure 2.8. qRT-PCR measurements of mature or primary miRNA levels in cells treated with 13 (10 µM) relative to a DMSO control (100% expression). The error bars indicate the standard deviation determined from three independent measurements. Adapted with
permission from Angew. Chem. Int. Ed. 2008, 47, 7482. ... 40 Figure 2.9. Combination treatment of cell lines with 13 and the anti-cancer agents curcumin and 5-fluorouracil. A. Cell viability of A172 cells treated with 13 (1 µM or 10 µM) and either curcumin (16) or 5-fluorouracil (17) at concentrations 10 to 1000-fold lower than their IC50 values. B. Cell viability of A172 or HEK 293T cells treated with 13 (10 µM) and
xiii 18 were synthesized with modifications to the benzyl (shown in blue) and amide (shown in red) functionalities. The numbers represent the relative activity normalized to 13 within the same luciferase assay. Experiments were performed in triplicate and the standard deviations of three independent assays were calculated. Analogs were synthesized by Matt Stephens. . 47 Figure 2.11. Structures of potential small molecule inhibitors identified from a NIH high-throughput screen in HeLa-miR21-Luc cells. ... 50 Figure 2.12. Structure-activity investigation of the potential miR-21 inhibitor 31 identified from the NIH HTS. Modifications were made to the phenyl substituents (variations to the original structure are shown in blue) and the benzothiazole (shown in blue). The numbers represent the relative activity normalized to the miR-21 inhibitor 13 within the same luciferase assay. Experiments were performed in triplicate and standard deviations of three independent assays were calculated. Analogs were synthesized by Meryl Thomas and Laura Gardner. ... 52 Figure 2.13. Activities of the N-acylhydrazones 33 and 34 identified from the NIH HTS as potential miR-21 inhibitors and the structurally similar 49. The numbers represent the
activity normalized to the miR-21 inhibitor 13 within the same luciferase assay. Experiments were performed in triplicate and standard deviations of three independent assays were
calculated. Synthesis was performed by Meryl Thomas. ... 53 Figure 2.14. Secondary assays of the potential miR-21 inhibitor 49. A. Bright Glo Luciferase Assays of HeLa-miR21-Luc and HeLa-linker-Luc cells treated with 49 or 13 at 10 µM in triplicate in a 96-well format. The luciferase signal was normalized to a DMSO control. B. MTT cell proliferation assay of HeLa cells treated with 49 or 13 at 10 µM in triplicate in a 96-well format. The cell viability for small molecule treated cells was normalized to a DMSO control (100% expression). The error bars indicate the standard deviation determined from three independent measurements. ... 55 Figure 2.15. Structure-activity investigation of the miR-21 inhibitor 49 through
xiv Figure 2.17. Assessment of the specificity of the hydrazone miR-21 inhibitors. A. Bright Glo Luciferase Assays of HeLa-miR21-Luc and HeLa-miR30A-Luc cells treated with the
hydrazones at 10 µM in triplicate in a 96-well format. The luciferase signal was normalized to a DMSO control. B. qRT-PCR measurements of mature miR-21, miR-20a, miR-24, and miR-27b levels in HeLa cells treated with the hydrazones 49 and 54 (10 µM). The expression of each miRNA for small molecule treated cells was normalized to a DMSO control (100% expression) and RNU19 expression using the 2-∆∆Ct method. The error bars indicate the standard deviation determined from three independent measurements. ... 61 Figure 2.18. Activities of the oxadaizoles 35 and 36 identified from the NIH HTS as
potential 21 inhibitors. The numbers represent relative activity normalized to the miR-21 inhibitor 13 within the same luciferase assay. Experiments were performed in triplicate and standard deviations of three independent assays were calculated. Synthesis was
performed by Laura Gardner. ... 62 Figure 2.19. Dose-response curve for 35 revealing an EC50 value of 0.15 µM. The error bars
indicate the standard deviation determined from three independent measurements. ... 63 Figure 2.20. Bright Glo Luciferase Assays of HeLa-miR21-Luc and HeLa-linker-Luc cells treated with DMSO, 13, or 35 at 10 µM in triplicate in a 96-well format. The luciferase signal was normalized to a 1% DMSO control. The error bars indicate the standard deviation determined from three independent measurements. ... 64 Figure 2.21. A. Structure of the re-synthesized FLuc inhibitor PCT-124 (60). B. In vitro FLuc assay of the miR-21 inhibitors 13 and 35 compared to the known FLuc inhibitor 60. The luciferase signal was normalized to a 1% DMSO control. The error bars indicate the standard deviations determined from three independent measurements. ... 65 Figure 2.22. A. Bright Glo Luciferase Assay of HeLa-miR30A-Luc cells treated with 35 or 13 at 10 µM in triplicate in a 96-well format. The luciferase signal was normalized to a 1% DMSO control. B. MTT cell proliferation assay of HeLa cells treated with 35 or 13 at 10 µM in triplicate in a 96-well format. The cell viability for small molecule treated cells was normalized to a DMSO control (100% expression). The error bars indicate standard
xv Figure 2.24. A. Structure of the miR-21 inhibitor 35, indicating the parts of the molecule that were altered in the SAR study, including the substituted phenyl (indicated in red), the central amine (green), and the thiophene (blue) functionalities. B. Structure-activity investigation of 35 through modifications to the phenyl ring (variations to the original structure are shown in red). The numbers represent the relative activity normalized to 35 within the same miR-21 luciferase assay. All assays were conducted in triplicate and error represents standard deviation from the three independent experiments. Analogs were synthesized by Laura Gardner and Meryl Thomas. ... 71 Figure 2.25. Structure-activity investigation of the miR-21 inhibitor 35 through
modifications to the thiophene ring (variations to the original structure are shown in blue). The numbers represent the relative activity normalized to 35 within the same miR-21 luciferase assay. All assays were conducted in triplicate and error represents standard deviation from the three independent experiments. Analogs were synthesized by Meryl Thomas. ... 72 Figure 2.26. Structure-activity investigation of the miR-21 inhibitor 35 through removal of the amino group (variations to the original structure are shown in green). The numbers represent the % activity normalized to 35 within the same miR21 luciferase assay. All assays were conducted in triplicate and the error represents the standard deviation from the three independent experiments. Analogs were synthesized by Meryl Thomas. ... 74 Figure 2.27. Luciferase assay results for the aryl-amides 37, 38, 82, and 83. The numbers represent the activity normalized to 13 within the same miR-21 luciferase assay, where the activity of 13 is set to 100%. Experiments were performed in triplicate and the standard deviations of the three independent assays were calculated. Synthesis was performed by Meryl Thomas. ... 75 Figure 2.28. A. Structures and activities of the aryl-amides 39 and 84. The numbers
xvi standard deviation from the three independent experiments. Analogs were synthesized by Matt Stephens... 80 Figure 2.30. Structure-activity investigation of the miR-21 inhibitor 84 through modification of the cyclohexene substituents (variations to the original structure are shown in red). The numbers represent the expression of miR-21 relative to a DMSO control within the same qRT-PCR assay. All assays were conducted in triplicate and the error represents the standard deviation from the three independent experiments. Analogs were synthesized by Matt
Stephens. ... 82 Figure 2.31. Structure-activity investigation of the miR-21 inhibitors 84 and 101 (variations to the original structure are shown in red and blue). The numbers represent the expression of miR-21 relative to a DMSO control within the same qRT-PCR assay. All assays were conducted in triplicate and the error represents the standard deviation from the three
independent experiments. Analogs were synthesized by Matt Stephens. ... 84 Figure 2.32. Recovery of the inhibitory activity of the miR-21 inhibitors 13 and 35 through transfection of a Pre-miR-21 Precursor. A. Bright Glo Luciferase assay of HeLa-miR-21-Luc cells transfected with Pre-miR-21 or Pre-miR-122 Precursor using X-tremeGENE siRNA transfection reagent. B. Bright Glo Luciferase assay of HeLa-miR-21-Luc cells transfected with Pre-miR-21 or Pre-miR-122 Precursor and treated with DMSO, 13, or 35 for 48 hours. All experiments were conducted in triplicate and the data was normalized to the
X-tremeGENE transfection control. The error bars indicate standard deviations determined from three independent experiments. ... 87 Figure 2.33. Representation of the affinity chromatography approach to target identification. A pulldown probe (shown as a green triangle) is immobilized on a resin (shown in gray). The resin is incubated with cell lysate containing the target protein (shown in red) and
non-specific proteins. Unbound proteins are then removed through a series of washes. The target protein is then eluted by incubation of the resin with an excess of the unmodified active compound. The target protein is then purified and analyzed by mass spectroscopy to identify the protein. Adapted with permission from Angew. Chem. Int. Ed. 2013, 52, 2744. ... 90 Figure 2.34. Structure-activity investigation of the miR-21 inhibitor 13 through modification of the para substituent to find a suitable pulldown probe. The numbers represent the activity normalized to 13 within the same luciferase assay. Experiments were performed in triplicate and the standard deviations of the three independent assays were calculated. Analogs were synthesized by Christoph Grohmann and Elwin Janssen. ... 91 Figure 2.35. Representation of the photoaffinity labeling between a small molecule
xvii functional tag (shown in yellow) or contain a functional group that can be readily reacted with a detectable/functional tag. The target protein can then be purified and analyzed by mass spectroscopy to identify the protein. ... 93 Figure 2.36. Structure-activity investigation of the miR-21 inhibitor 18 through modification of the para substituent (indicated in blue) to find a suitable photoprobe for photoaffinity labeling experiments. Modifications to the amide moiety (indicated in red) were made to find a negative control small molecule. The numbers represent the activity normalized to 13 within the same luciferase assay. Experiments were performed in triplicate and standard deviations of three independent assays were calculated. Analogs were synthesized by Matt Stephens. ... 96 Figure 2.37. qRT-PCR measurements of mature miR-21 levels in HeLa cells treated with 13, 18, or the photoprobes for photoaffinity labeling (10 µM). The % expression of miR-21 for small molecule treated cells was normalized to a DMSO control (100% expression) and RNU19 expression using the 2-∆∆Ct method. The error bars indicate the standard deviation determined from three independent qRT-PCR measurements. ... 98 Figure 2.38: Structures of the synthesized rhodamine-azide (127) and fluorescein-azide (128) that will be used as either detectable or functional tags for visualization and/or
xviii denatured, 124 (20 µM). A. Samples labeled with the rhodamine-azide. B. Samples labeled with the fluorescein-azide. Fluorescence was imaged on a Typhoon 7000 phosphorimager. ... 105 Figure 2.42. Structure-activity investigation of the miR-21 inhibitor 35 through
modifications to the phenyl (variations to the original structure are shown in red) and the thiophene (variations to the original structure are shown in blue) functionalities. The numbers represent the relative activity normalized to 35 within the same miR-21 luciferase assay. All assays were conducted in triplicate and the error represents the standard deviation from the three independent experiments. Analogs were synthesized by Laura Gardner and Meryl Thomas. ... 109 Figure 2.43. qRT-PCR measurements of mature miR-21 levels in HeLa cells treated with the photoprobes 137 and 138 and the parent compound 35 (10 µM). The levels of miR-21 for small molecule treated cells were normalized to a DMSO control (100% expression) and RNU19 expression using the 2-∆∆Ct method. The error bars indicate the standard deviation determined from three independent qRT-PCR measurements. ... 111 Figure 2.44. MTT cell proliferation assay of HEK293T, HeLa, A172, MCF-7, and MDA-MB-231 cells. A. Cells treated with 13 at 1, 10, 20, 50, 100, or 200 µM (1% DMSO final concentration) in triplicate in a 96-well format. B. Cells treated with 35 at 1, 10, 20, 50, 100, or 200 µM (1% DMSO final concentration) in triplicate in a 96-well format. The cell
viability for small molecule treated cells was normalized to a DMSO control (100% expression). The error bars indicate the standard deviation determined from three
xix Figure 2.47. A. MTT Assay of HCT-116 cells treated with 13 or 35 (10 µM) in combination with 5-fluorouracil (0, 1, 10, 100, 500, or 5000 µM) for 48 hours. B. Caspase-Glo 3/7 Assay of HCT-116 cells treated with 13 or 35 (10 µM) in combination with 5-fluorouracil (500 µM) for 48 hours. The error bars indicate the standard deviation determined from three
independent measurements. ... 122 Figure 2.48. MTT cell proliferation assays of cell lines treated in combination with 13 or LG-157 and anti-cancer agents. A. A549 cells treated with 13 or 35 (10 µM) and doxorubicin (0, 0.1, 1, or 10 µM). B. PC-3 cells treated with 13 or 35 (10 µM) docetaxel (0, 1, 10, 20, 50, or 100 nM). C. MCF-7 cells treated with 13 or 35 (10 µM) and topotecan (0, 0.1, 1 µM). D. HL-60 cells treated with 13 or 35 (10 µM) and cytarabine (0, 0.1, 1, 2, or 5 µM). The cell viability for small molecule treated cells was rmalized to a DMSO control (100%
expression). The error bars indicate the standard deviation determined from three
independent measurements. ... 126 Figure 2.49. Clonogenic assay of HCT-116 cells treated with 1 µM of 5-fluorouracil (5-FU) and 10 µM of the miR-21 inhibitors 13 and 35 for 10-14 days. The relative colony count was normalized to a DMSO negative control. The error bars indicate the standard deviation from three independent experiments. Experiments were performed by Sander Myoung. ... 129 Figure 2.50. Clonogenic assay of A549 cells treated with 10 nM doxorubicin (Dox) and 10
µM of the miR-21 inhibitors 13 and 35 for 10-14 days. The relative colony count was normalized to DMSO control. The error bars indicate the standard deviation from three independent experiments. Experiments were performed by Sander Myoung. ... 131 Figure 3.1. After entry into the cell, the HCV genome functions in three main roles:
translation, replication, and packaging into nascent virions. MicroRNA miR-122 is necessary for RNA replication and may stimulate translation of the viral polyprotein. Adapted by permission from Macmillan Publishers Ltd: Nature 2005, 436, 933. ... 146 Figure 3.2. Critical path of the small molecule screening approach, including the assay development, primary screening, secondary screening, and validation experiments to
discover potent and specific small molecule modifiers of miR-122... 148 Figure 3.3. A. Vector map of the psiCHECK-miR122 plasmid that was developed as an endogenous sensor for miR-122 based on the psiCHECK-2 vector. The complementary sequence for mature miR-122 was inserted in the multi-cloning site at the 3′ terminus of the Renilla gene between the SgfI and PmeI restricton sites to create the reporter construct
xx Figure 3.4. Validation of the psiCHECK-miR122 vector for the detection of miR-122 in both Huh7 and HeLa cell lines. The error bars represent the standard deviation from three
independent experiments. Adapted with permission from J. Am. Chem. Soc. 2010, 132, 7976. ... 152 Figure 3.5. Co-transfection of psiCHECK-miR122 with a 2′-OMe miR-122 antagomir at 50 and 250 pmol using X-tremeGENE siRNA transfection reagent in Huh7 cells. The error bars represent the standard deviation from three independent experiments. Adapted with
permission from J. Am. Chem. Soc. 2010, 132, 7976. ... 153 Figure 3.6. Initial hits of small molecule inhibitors of miR-122 identified from the screening of 1364 compounds in Huh7 cells transfected with psiCHECK-miR122. The numbers
represent relative luciferase units (RLU) normalized to a 1% DMSO control and the standard deviation is derived from three independent assays. ... 156 Figure 3.7. Validation of small molecules 139 and 140 as miR-122 inhibitors. A significant increase in Renilla luciferase expression is observed when Huh7 cells transfected with psiCHECK-miR122 are treated with the miR-122 antagomir or compounds 139 and 140 (10
µM). Virtually no change in Renilla luciferase expression is observed in Huh7 cells
psiCHECK-xxi miR122 are treated with the compound 141 (10 µM). Within error, no effect on Renilla luciferase expression is observed in Huh7 cells transfected with psiCHECK-control. The relative luciferase units were normalized to the corresponding DMSO signals. The error bars represent the standard deviation from three independent experiments. Adapted with
permission from J. Am. Chem. Soc. 2010, 132, 7976. ... 162 Figure 3.12. Determination of miRNA specificity of compound 141 (10 µM) using miR-21 and miR-122 luciferase reporter assays. Compound 141 induced only a small
down-regulation of luciferase levels in the miR-21 reporter assay, suggesting that it is not a general activator of the miRNA pathway. The error bars represent the standard deviation from three independent experiments. ... 163 Figure 3.13. Cell viability assay of Huh7 cells treated with 141 at 10 µM. The cells were assayed for viability using a MTT assay after 48 h of exposure. The percent viability for small molecule treated cells was determined relative to the DMSO control, where DMSO treatment represents 100% viability. The error bars represent the standard deviation from three independent experiments. ... 164 Figure 3.14. A. Structures of the topoisomerase II inhibitors doxorubicin and etoposide. B. Dose response curves for amonafide (141), doxorubicin, and etoposide in Huh7 cells stably transfected with psiCHECK-miR122. All assays were conducted in triplicate and the relative luciferase units were normalized to a DMSO control. The error bars represent the standard deviation from three independent experiments. ... 166 Figure 3.15. A. Dose response curves for inhibitors 139 and 140 in Huh7 cells transfected with psiCHECK-miR122. B. Dose response curve for the miR-122 activator 141. All assays were conducted in triplicate and normalized to a DMSO control. The error bars represent the standard deviation from three independent experiments. Adapted with permission from J. Am. Chem. Soc. 2010, 132, 7976. ... 167 Figure 3.16. Quantitative RT-PCR of miR-122 and pri-miR-122 in Huh7 cells, and miR-21 in HeLa cells after A. Exposure to the miR-122 inhibitors 139 and 140 at 10 µM and B. Exposure to the miR-122 activator 141 at 10 µM. All experiments were conducted in
triplicate and the data was normalized to a DMSO control. Adapted with permission from J. Am. Chem. Soc. 2010, 132, 7976. ... 170 Figure 3.17. Structure of the miR-122 inhibitor 139, indicating the parts of the molecule that were altered in the SAR study. ... 171 Figure 3.18. Structure-activity investigation of the miR-122 inhibitor 139 through
xxii represent the standard deviation from the three independent experiments. Analogs were synthesized by Christoph Grohmann. ... 173 Figure 3.19. Structure-activity investigation of the miR-122 inhibitor 139 through
modifications to the naphthalene functionality (variations to the original structure are shown in blue). The numbers represent the % activity normalized to 139 in the psiCHECK-miR122 assay in Huh7 cells. All assays were conducted in triplicate and the error bars represent the standard deviation from the three independent experiments. Analogs were synthesized by Christoph Grohmann. ... 174 Figure 3.20. Structure-activity investigation of the miR-122 inhibitor 139 through
modifications of the initial analogs 142, 143, and 145 (variations to the original structure are shown in red and blue). The numbers represent the % activity normalized to 139 in the psiCHECK-miR122 assay in Huh7 cells. All assays were conducted in triplicate and the error bars represent the standard deviation from the three independent experiments. Analogs were synthesized by Christoph Grohmann. ... 175 Figure 3.21. Structure-activity investigation of the miR-122 inhibitor 139 through
modifications of the initial analogs 142, 143, 144, and 145 (variations to the original structure are shown in red and green). The numbers represent the % activity normalized to 139 in the psiCHECK-miR122 assay in Huh7 cells. All assays were conducted in triplicate and the error bars represent the standard deviation from the three independent experiments. Analogs were synthesized by Christoph Grohmann. ... 176 Figure 3.22. Structure of the miR-122 inhibitor 140, indicating the functionalities that were altered in the SAR study. ... 177 Figure 3.23. Structure-activity investigation of the miR-122 inhibitor 140 through
modification of the trans-decahydroquinoline motif (variations to the original structure are shown in red). The numbers represent the activity normalized to 140 within the same
luciferase assay. Experiments were performed in triplicate and the standard deviations of the three independent assays were calculated. Analogs were synthesized in collaboration with Meryl Thomas. * indicates a structure published in J. Am. Chem. Soc. 2010, 132, 7976. ... 182 Figure 3.24. Structure-activity investigation of the miR-122 inhibitor 140 through
modification of the sulfonamide linkage (variations to the original structure are shown in green). The numbers represent the activity normalized to 140 within the same luciferase assay. Experiments were performed in triplicate and the standard deviations of the three independent assays were calculated. Analogs were synthesized by Meryl Thomas. ... 183 Figure 3.25. Structure-activity investigation of the miR-122 inhibitor 140 through
xxiii assay. Experiments were performed in triplicate and the standard deviations of the three independent assays were calculated. Analogs were synthesized by Meryl Thomas. ... 185 Figure 3.26. Structure of the miR-122 activator 141, indicating the functionalities that were altered in the SAR study. ... 186 Figure 3.27. Structure-activity investigation of the miR-122 activator 141 through
modifications to the amino group (red) and the CH2CH2N(CH3)2 side-chain (blue). The
numbers represent relative luciferase units (RLU) normalized to a DMSO control in the psiCHECK-miR122 assay in Huh7 cells. Experiments were performed in triplicate and the standard deviations of the three independent assays were calculated... 188 Figure 3.28. A. Cell viability assay of Huh7 cells treated with increasing concentrations of G418. Luminescence units were normalized to untreated cells and are represented as percent cell viability. 500 µg/mL of G418 was used in the selection of stable Huh7-psiCHECK-miR122 clones. B. Relative luminescence units (RLU) of Huh7-psiCHECK-Huh7-psiCHECK-miR122 clones A-Q transfected with a miR-122 antagomir in a 96-well format. All assays were conducted in triplicate and were normalized to a control containing only transfection reagent. Error bars represent standard deviations from three independent experiments. From these clones, the Huh7-psiCHECK-miR122 cell line G was selected based on the level of luciferase
expression and the response to miR-122 antagomir transfection. Adapted with permission from J. Biomol. Screen. 2012, 17, 822... 193 Figure 3.29. A. Relative luminescence units (RLU) of Huh7-psiCHECK-miR122 cells treated with increasing concentrations of DMSO. All assays were conducted in triplicate in a 96-well format. B. Luciferase assay dose response curves for Huh7-psiCHECK-miR122 cells transfected with either a miR-122 or miR-21 antagomir in a 96-well format. All assays were conducted in triplicate and were normalized to a control containing only transfection reagent. Adapted with permission from J. Biomol. Screen. 2012, 17, 822. ... 195 Figure 3.30. A. Dose-dependent response of relative luciferase units (RLU) for
Huh7-psiCHECK-miR122 cells treated with increasing concentrations of the miR-122 inhibitors 140 and 228 and the inactive analog 203. B. Dose-dependent response of absolute Renilla luminescence units for Huh7-psiCHECK-miR122 cells treated with increasing concentrations of the miR-122 inhibitors 140 and 228 and the inactive analog 203. All assays were
conducted in triplicate in a 384-well format and were normalized to a DMSO control. Error bars represent standard deviations from three independent experiments. Adapted with
xxiv Figure 3.32. Critical path flow chart for the HTS performed by the Broad Institute’s Probe Development Center. ... 208 Figure 3.33. Results of the HTS performed in Huh7-psiCHECK-miR122 cells by the Broad Institute’s Probe Development Center. A. Activity data for all small molecules screened in the primary assay, where each point represents one compound. B. Activity comparison of two replicates (A and B) for each compound. Data was provided by Kate Hartland (BIPDeC). ... 210 Figure 3.34. Screening flow chart indicating the number of compounds that successfully passed each round of screening, leading to the identified miR-122 inhibitor 229. ... 212 Figure 3.35. Structures of potential miR-122 inhibitors provided by the BIPDeC. The
numbers beginning in TV are the vial barcode for each compound provided by the Broad Institute. The numbers beginning in BRD are the Broad Institute’s identification numbers. ... 213 Figure 3.36. Luciferase assays of Huh7-psiCHECK-miR122 cells, Huh7 cells transfected with psiCHECK-Empty, and HeLa-miR21-Luc cells treated with potential miR-122
inhibitors provided by the BIPDeC. Compounds are identified by the vial barcode provided by the Broad Institute. * indicates compounds that were further assessed through dose-response experiments. All assays were conducted in triplicate and normalized to a DMSO control. The error bars represent the standard deviation from three independent experiments. ... 214 Figure 3.37. Structures of miR-122 inhibitors discovered from the screening of 32 potential hits identified by the HTS. The numbers beginning in TV are the vial barcode for each compound provided by the Broad Institute. The numbers beginning in BRD are the Broad Institute’s identification numbers. The blue numbers represent the activity at 10 µM
normalized to 140 within the same Huh7-psiCHECK-miR122 assay. EC50 values are shown
xxv and the data was normalized to the expression of a control RNA, RNU19, and a DMSO control. ... 219 Figure 3.40. Results of the primary HTS performed in Huh7-psiCHECK-miR122 cells by the Broad Institute’s Probe Development Center. A. Activity data for all small molecules screened in the primary assay, where each spot represents a single compound. B. Activity comparison of two replicates (A and B) for each compound. Data was provided by Kate Hartland (BIPDeC). ... 221 Figure 3.41. Screening flow chart indicating the number of compounds that successfully passed each round of screening, leading to the miR-122 activators 240 and 241. ... 223 Figure 3.42. Structures of the potential miR-122 activators provided by the BIPDeC. The numbers beginning in TV are the vial barcode for each compound provided by the Broad Institute. The numbers beginning in BRD are the Broad Institute’s identification numbers. The blue numbers represent relative luciferase units (RLU) normalized to a DMSO control in the Huh7-psiCHECK-miR122 assay. Experiments were performed in triplicate and the standard deviations of the three independent assays were calculated... 225 Figure 3.43. Structures of the potential miR-122 activators that were discovered from the screening of 22 hits identified by the HTS. The compounds led to reductions in Renilla luciferase expression in Huh7-psiCHECK-miR122 cells. The numbers beginning in TV are the vial barcode for each compound provided by the Broad Institute. The numbers beginning in BRD are the Broad Institute’s identification numbers. The blue numbers represent relative luciferase units (RLU) normalized to a DMSO control in the Huh7-psiCHECK-miR122 assay. Experiments were performed in triplicate and the standard deviations of the three independent assays were calculated. ... 227 Figure 3.44. A. Dose response curve for the potential miR-122 activator 244 in
Huh7-psiCHECK-miR122 cells. B. Dose response curve for the potential miR-122 activator 245 in Huh7-psiCHECK-miR122 cells. All experiments were conducted in triplicate in a 96-well format and were normalized to a DMSO control. Error bars represent standard deviations from three independent experiments. ... 228 Figure 3.45. A. Luciferase assays of Huh7-psiCHECK-miR122, HeLa-miR21-Luc, or Huh7 cells transfected with psiCHECK-control (psiCHECK-Empty) treated with the potential miR-122 activators 244 and 245 at 10 µM in triplicate for 48 h. B. MTT cell proliferation assay of Huh7 cells treated with the potential miR-122 activators 244 and 245 at 10 µM in triplicate for 48 h. All experiments were conducted in triplicate in a 96-well format and were
normalized to a DMSO control. Error bars represent standard deviations from three
xxvi Figure 3.46. Quantitative RT-PCR measuring mature 122, let-7a, 155, and miR-221 expression in Huh7 cells after exposure to the potential miR-122 activators 244 and 245 at 10 µM. All experiments were conducted in triplicate and the data was normalized to the expression of the control RNA, RNU6B, and a DMSO control. ... 231 Figure 4.1. A. Melting curves of pre-miR-122 ± tobramycin (248) (left). Differentiation of the melting curves (right) revealed an RNA-small molecule interaction, stabilizing the RNA in the presence of 248 (Tm = 71 °C) versus the absence of 248 (Tm = 62 °C). B. Melting
curves of pre-miR-122 ± the small molecule inhibitor 139 (left). Differentiation of the melting curves (right) revealed identical melting temperatures in the absence (Tm = 60 °C)
and presence (Tm = 60 °C) of 139. C. Melting curves of pre-miR-122 ± the small molecule
inhibitor 140 (left). Differentiation of the melting curves (right) revealed identical melting temperatures in the absence (Tm = 61 °C) and presence (Tm = 61 °C) of 140. D. Melting
curves of pre-miR-122 ± the small molecule activator 141 (left). Differentiation of the
melting curves (right) revealed almost identical melting temperatures in the absence (Tm = 60
°C) and presence (Tm = 61 °C) of 141. Adapted with permission from J. Am. Chem. Soc.
2010, 132, 7976... 263 Figure 4.2. Recovery of the inhibitory activity of the miR-122 inhibitors 139 and 140
through transfection of a Pre-miR-122 Precursor. A. Dual Luciferase assay of Huh7-psiCHECK-miR122 cells transfected with Pre-miR-122 or Pre-miR-21 Precursor using X-tremeGENE siRNA transfection reagent. B. Dual Luciferase assay of Huh7-psiCHECK-miR122 cells transfected with Pre-miR-122 or Pre-miR-21 Precursor and treated with DMSO, 139, or 140 for 48 hours. All experiments were conducted in triplicate and the data was normalized to the X-tremeGENE transfection control. The error bars indicate standard deviations determined from three independent experiments. ... 267 Figure 4.3. Structural modifications performed on 140 to install functionalities necessary for photoaffinity labeling experiments. The modifications from the initial structure are shown in red and blue. The numbers represent the activity normalized to 140 within the same Huh7-psiCHECK-miR122 luciferase assay. Experiments were performed in triplicate and the standard deviations of the three independent assays were calculated. Analogs were
synthesized by Meryl Thomas. ... 272 Figure 4.4. Analog of 140 to be used as a negative control photoprobe for photoaffinity labeling experiments (variations to the original structure of 140 are shown in red, green, and blue). The numbers represent the activity normalized to 140 within the same
Huh7-psiCHECK-miR122 luciferase assay. Experiments were performed in triplicate and the standard deviations of the three independent assays were calculated. Synthesis was
xxvii Figure 4.5. Structures of the synthesized rhodamine-azide (127), fluorescein-azide (128), and biotin-azide (265) that will be used as either detectable or functional tags for visualization and/or purification of the target protein. Synthesis was performed by Meryl Thomas. ... 274 Figure 4.6. Representation of the photoaffinity labeling approach. After an overnight
incubation with the photoprobe 253, Huh7 cells will be irradiated with UV light inducing photo-crosslinking between the small molecule and its target protein (shown in blue). The cells will then be lysed and a click reaction will be performed between the alkyne of the small molecule and a rhodamine-azide that will render the probe/protein complex fluorescent thereby facilitating the identification of the protein. The target protein will then be purified and analyzed by mass spectrometry. ... 275 Figure 4.7. Fluorescence imaging of a 12% SDS-PAGE gel of protein samples isolated from Huh7 cells treated with DMSO, the miR-122 inhibitor 140, the photoprobes 253 and 263, or the negative control 264. Lane 1: Ladder, Lane 2: DMSO, Lane 3: 140 (50 µM), Lane 4: 253 (10 µM), Lane 5: 253 (10 µM) + 140 (50 µM), Lane 6: 263 (10 µM), Lane 7: 264 (10 µM). Fluorescence was imaged on a phosphorimager. The two fluorescently labeled proteins are indicated by a red box. ... 277 Figure 4.8. Silver Stained 12% SDS-PAGE gel of protein samples isolated from Huh7 cells treated with the photoprobe 253, labeled with the biotin-azide, and purified with various amounts of streptavidin resin. Lane 1: Ladder, Lane 2: 80 µL of streptavidin resin, Lane 3: 100 µL of streptavidin resin, Lane 4: 120 µL of streptavidin resin, Lane 5: 160 µL of
streptavidin resin. ... 279 Figure 4.9. Imaging of a 12% SDS-PAGE gel of protein samples isolated from Huh7 cells treated with the photoprobe 253, labeled with the fluorescein-azide, and purified with various amounts of anti-fluorescein antibody and protein A/G agarose beads. Lane 1: Ladder, Lane 2: 300 µg of total protein and 1:4 antibody/agarose bead ratio, Lane 3: 300 µg of total protein and 1:2 antibody/agarose bead ratio, Lane 4: 250 µg of total protein and 1:4 antibody/agarose bead ratio, Lane 5: 250 µg of total protein and 1:2 antibody/agarose bead ratio. Fluorescence was imaged on a phosphorimager. ... 281 Figure 4.10. Imaging of 12% SDS-PAGE gels after 2-D gel electrophoresis. A. Fluorescence imaging and silver staining of a 2-D gel containing proteins isolated from Huh7 cells treated with the photoprobe 253 and labeled with the rhodamine-azide 127. B. Fluorescence imaging of the 2-D gel containing proteins isolated from Huh7 cells treated with the photoprobe 253 and labeled with the rhodamine-azide 127 that was submitted for analysis by mass
xxviii 2: Ladder. B. Fluorescence imaging of a 2-D gel containing proteins isolated from Huh7 cells treated with the photoprobe 253 and labeled with the rhodamine-azide 127 (right).
Fluorescence imaging of the Western blot (middle). Colorimetric HRP detection of β-tubulin by Western blot (right). The fluorescently labeled proteins are indicated by a red box. ... 286 Figure 4.12. A. Small molecule β-tubulin inhibitors show activity in the psiCHECK-miR122 assay in Huh7 cells. An increase in Renilla luciferase expression is observed when Huh7 cells expressing the psiCHECK-miR122 reporter are treated with colchicine, vinblastine, vincristine, and nocodazole starting at 100 nM. B. Relatively no change in Renilla luciferase expression is observed in Huh7 cells transfected with the psiCHECK-control plasmid. The relative luciferase units were normalized to the corresponding DMSO signals. The error bars represent the standard deviation from three independent experiments. ... 288 Figure 4.13 Fluorescence imaging (left) and Coomassie Blue staining (right) of a 12% SDS-PAGE gel after 2-D gel electrophoresis of a protein sample isolated from Huh7 cells treated with the photoprobe 253 and labeled with the rhodamine-azide 127. The fluorescently
labeled target proteins are indicated by a red box. ... 289 Figure 4.14. A. Vector map of the pGL3-basic plasmid (Promega). The miR-122 promoter sequence was inserted in the multi-cloning site upstream of the firefly luciferase gene between the KpnI and XhoI restriction sites to create the reporter construct pGL3-basic-miR122 promoter. B. Vector map of the pGL3-control plasmid (Promega). ... 292 Figure 4.15. Bright Glo Luciferase assay of Huh7 cells transfected with pGL3-control, pGL3-basic, or pGL3-basic-miR122 promoter using Lipofectamine 2000. All experiments were conducted in triplicate and the data was normalized to cells transfected with
Lipofectamine 2000 only. The error bars represent the standard deviation from three
independent experiments. ... 293 Figure 4.16. Dual Luciferase assay of Huh7 cells co-transfected with control, pGL3-basic, or pGL3-basic-miR122 promoter and pRL-TK using Lipofectamine 2000. The firefly luciferase readings were normalized to the Renilla luciferase readings to give relative luciferase units (RLUs). All experiments were conducted in triplicate and the data was normalized to cells treated with a DMSO control. The error bars represent the standard deviation from three independent experiments. ... 296 Figure 4.17. Effects of miR-122 inhibitors 139 and 140 (10 µM) on HCV replication in Huh7 cells. Both compounds induced a substantial reduction of viral RNA in infected cells. All experiments were conducted in triplicate and the data was normalized to a DMSO
xxix infected cells. All experiments were conducted in triplicate and the data was normalized to the 18s rRNA expression and the non-treated control. Error bars represent the standard deviation of three independent experiments. Experiments were performed by the Randall lab (University of Chicago). ... 299 Figure 4.19. Effect of the miR-122 activator 141 (10 µM) on caspase-3 and caspase-7
activity in HepG2 and Huh7 cells. An increased caspase-3/7 level is observed in HepG2 cells due to activation of miR-122. This increase is more prominent in HepG2 cells than Huh7 cells, because of the different basal levels of miR-122 in either cell line. All experiments were conducted in triplicate and the data was normalized to a DMSO control. Adapted with permission from J. Am. Chem. Soc. 2010, 132, 7976. ... 301 Figure 4.20. Effects of the miR-122 activator 141 on HepG2 and Huh7 cell viability. HepG2 and Huh7 cells were treated with 141 at 10 and 20 µM for 48 hours and then assayed with the Cell-Titer Glo assay system. At 10 µM of 141, a reduced cell viability of ~20% in HepG2 cells and only a minimal reduction in cell viability in Huh7 cells was observed. All
experiments were conducted in triplicate, and the data was normalized to a DMSO control. Adapted with permission from J. Am. Chem. Soc. 2010, 132, 7976. ... 302 Figure 5.1. Assay for miRNA function via control of luciferase expression by a miRNA target sequence in the 3′-UTR. The presence of the complementary miRNA in cells
transfected with the reporter construct leads to decreased luciferase expression. ... 317 Figure 5.2. Vector map of the pmirGLO plasmid that was used to develop sensors for miR-221/222. The vector has both a firefly and a Renilla luciferase gene allowing for an internal control for cell number and cell viability. The complementary sequence for a mature miRNA can be inserted in the multi-cloning site (MSC) at the 3′ terminus of the firefly luciferase gene between the NheI and SalI restriction sites to create reporter constructs for
miR-221/222. ... 324 Figure 5.3. Validation of the 221/222 reporter constructs for the detection of miR-221/222 in the PC-3 cell line. A. Dual Luciferase Assay of PC-3 cells transfected with
psiCHECK-control, psiCHECK-miR221, and psiCHECK-miR222. B. Dual Luciferase Assay of PC-3 cells transfected with pmirGLO-control, pmirGLO-miR221, and pmirGLO-miR222. The error bars represent the standard deviation from three independent experiments. ... 327 Figure 5.4. A. Co-transfection of psiCHECK-miR221 or psiCHECK-control with a 2′-OMe miR-221 antagomir at 10 pmol using X-tremeGENE siRNA transfection reagent in PC-3 cells. B. Co-transfection of psiCHECK-miR222 or psiCHECK-control with a 2′-OMe miR-222 antagomir. C. Co-transfection of pmirGLO-miR221 or pmirGLO-control with a 2′-OMe miR-221 antagomir. D. Co-transfection of pmirGLO-miR222 or pmirGLO-control with a 2′ -OMe miR-222 antagomir. The error bars represent the standard deviation from three
xxx Figure 5.5. Results of the pilot screen of the Diversity Set II performed in PC-3 cells
transfected with psiCHECK-miR222. Activity data for all small molecules screened in the primary assay, where each point represents one compound. Compounds that were re-assayed in the psiCHECK-miR222 assay at 10 µM in triplicate are indicated in orange. Compounds that were re-assayed in the psiCHECK-miR222 assay in dose-response are indicated in red. Compounds that were eliminated as hits due to previous small molecule screens for failing secondary assays using the psiCHECK-control plasmid are shown in purple (NSC 79139 and NSC 158959). ... 333 Figure 5.6. A. Structures of potential miR-222 inhibitors identified from the screening of 1364 compounds in PC-3 cells transfected with psiCHECK-miR222. B. Dose response curves for the potential inhibitors 266, 267, 268, and 269 in PC-3 cells transfected with psiCHECK-miR222. C. Dose response curves for potential inhibitors 266, 267, 268, and 269 in PC-3 cells transfected with psiCHECK-control. All assays were conducted in triplicate in a 96-well format and were normalized to a DMSO control. The error bars represent the
standard deviation from three independent experiments. ... 335 Figure 5.7. A. Structures of potential miR-222 inhibitors identified from the screening of 1364 compounds in PC-3 cells transfected with psiCHECK-miR222. B. Dose response curves for the potential inhibitors 270, 271, and 272 in PC-3 cells transfected with
xxxi µM). All assays were conducted in triplicate in a 96-well format and were normalized to a DMSO control. The error bars represent the standard deviation from three independent experiments. ... 343 Figure 5.11. A. Dual Luciferase Assay of Raji cells transfected with psiCHECK-control and psiCHECK-miR155 using X-tremeGENE siRNA transfection reagent, validating the
psiCHECK-miR155 reporter construct for the detection of miR-155 in the Raji cell. B. Dual Luciferase Assay of Raji cells transfected with pmirGLO-control and pmirGLO-miR155 using X-tremeGENE siRNA transfection reagent. The error bars represent standard
deviations from three independent experiments. ... 351 Figure 5.12. Dual Luciferase Assay of Raji cells transfected with the pmirGLO-control, pmirGLO-miR155, and pmirGLO-miR155-2 constructs using X-tremeGENE siRNA transfection reagent. The error bars represent standard deviations from three independent experiments. ... 352 Figure 5.13. Validation of the psiCHECK-miR155 reporter construct for the detection of miR-155 in the Raji cell line and co-transfection of both the psiCHECK-miR155 plasmid and the psiCHECK-control plasmid with an Anti-miR miR-155 Inhibitor at 20 nM using X-tremeGENE siRNA transfection reagent. The error bars represent the standard deviation from three independent experiments. ... 354 Figure 5.14. Validation of the miR-27b reporter plasmids in 4175 cells. A. Dual Luciferase Assay of 4175 cells transfected with psiCHECK-control and psiCHECK-miR27b constructs and co-transfection with an Anti-miR miR-27b Inhibitor (50 pmol) using X-tremeGENE siRNA transfection reagent. B. Dual Luciferase Assay of 4175 cells transfected with pmirGLO-control and pmirGLO-miR27b constructs and co-transfection with an Anti-miR miR-27b Inhibitor (50 pmol) using X-tremeGENE siRNA transfection reagent. The error bars represent standard deviations from three independent experiments. ... 361 Figure 6.1. The synthesized NPOM-caged 2′OMe uridine phosphoramidite 274 used in the synthesis of photocaged miR-21 and miR-122 antagomirs. ... 378 Figure 6.2. Validation of the Huh7-psiCHECK-miR122 reporter assay specificity for the miR-122 antagomir. Adapted from Mol. BioSyst. 2012, 8, 2987 with permission from The Royal Society of Chemistry. ... 382 Figure 6.3. Validation of the psiCHECK-miR21 reporter assay specificity for the miR-21 antagomir. Adapted from Mol. BioSyst. 2012, 8, 2987 with permission from The Royal Society of Chemistry... 382 Figure 6.4. UV irradiation time course of the caged miR-122 antagomir in
xxxii antagomir function. The error bars represent standard deviations from three independent experiments. Adapted from Mol. BioSyst. 2012, 8, 2987 with permission from The Royal Society of Chemistry... 383 Figure 6.5. Light-activation of miR-122 inhibition and subsequent luciferase expression by decaging of a miR-122 antagomir in Huh7 cells. Cells were transfected with the caged and non-caged miR-122 antagomir, and UV irradiation (365 nm, 25 W) for 5 min efficiently activated antagomir function. The error bars represent standard deviations from three independent experiments. Adapted from Mol. BioSyst. 2012, 8, 2987 with permission from The Royal Society of Chemistry. ... 384 Figure 6.6. UV irradiation time course of the caged miR-21 antagomir in Huh7 cells
transfected with a luciferase reporter for miR-21 function. Irradiation (365 nm, 25 W) for 2 or 5 min efficiently activated antagomir function. The error bars represent standard
xxxiii bright field images are shown. Adapted from Mol. BioSyst. 2012, 8, 2987 with permission from The Royal Society of Chemistry. ... 392 Figure 7.1. Overview of bacterial gene regulation by Hfq-binding sRNAs. Genes encoding trans-encoded antisense sRNAs (red) are located separately from the genes encoding their target RNAs (blue). Trans-encoded sRNAs bind to the 5ʹ-UTR of target mRNAs with limited complementarity and can negatively regulate expression by blocking ribosome binding (left panel) and/or targeting the sRNA-mRNA duplex for degradation by RNases (middle panel). Trans-encoded sRNAs can also stimulate gene expression by preventing the formation of an inhibitory structure in the mRNA, which sequesters the ribosome-binding site (RBS) (right panel). Adapted from Cell 2009, 136, 615 with permission from Elsevier. ... 402 Figure 7.2. The developed assay for Spot 42 function through silencing of a lacZ
translational fusion. Expression of the nanC::lacZ translational fusion is under control of an L-arabinose inducible PBAD promoter. Spot 42 expression is under control of an IPTG
inducible PLac promoter. In the presence of Spot 42, expression of lacZ is downregulated
resulting in a decrease in β-galactosidase activity. In the absence of Spot 42 or when Spot 42 is inhibited by a small molecule, the lacZ expression is restored leading to an increase in β -galactosidase activity. ... 408 Figure 7.3. Miller assay to quantify β-galactosidase activity of E. coli harboring the lacZ reporter and either pBRplac or pSpot42 induced with IPTG only, L-arabinose only, or both IPTG and L-arabinose in triplicate in a 96-well format. Error bars represent standard
xxxiv LIST OF SCHEMES
Scheme 3.1. General synthesis of the analogs 170-201 of the miR-122 inhibitor 140. 170: R1 = R2 = H, 171: R1 = H R2 = methyl, 172: R1 = H R2 = propyl, 173: R1 = H R2 = butyl, 174: R1 = H R2 = hexyl, 178: R1 = H R2 = isobutyl, 180: R1= H R2 = allyl, 181: R1 = H R2 =
propargyl, 189: R1 = cyclohexyl, 192: R1 = tetrahydroquinoline, 193: R1 = H R2 = phenyl, 194: R1 = H R2 = 4-aminophenyl, 195: R1 = H R2 = 4-nitrophenyl, 198: R1 = H R2 = 3,5-dimethoxyphenyl, 199: R1 = H R2 = benzyl. For final compound structures see Figure 3.22. ...178 Scheme 3.2. General synthesis of the nitro (216-221) and amino analogs (222-226) of the miR-122 activator 141. ...187 Scheme 3.3. Synthesis of the analog 227 of the miR-122 activator. The structure was
simplified by the removal of the amino group. The results from the psiCHECK-miR122 assay in Huh7 cells are shown as relative luciferase units (RLU) normalized to a DMSO control. The standard deviation was calculated from three independent assays. ...189 Scheme 6.1. Activation of a caged biomolecule with UV light. ...376 Scheme 6.2. Regulation of gene expression through photocontrol of endogenous miRNAs with nucleobase-caged antagomirs. Adapted from Mol. BioSyst. 2012, 8, 2987 with
1 CHAPTER 1: INTRODUCTION TO MICRORNAS
2 1.1 MicroRNA Biogenesis and Function
The majority of endogenous miRNAs are transcribed from the genome by RNA polymerase II into primary miRNAs (pri-miRNAs), which require subsequent processing to obtain a mature miRNA. Pri-miRNAs can range from hundreds to thousands of nucleotides in length and contain one or more hairpin structures.13 Pri-miRNAs are processed in the nucleus by the RNaseIII enzyme Drosha, with the aid of DGCR8 (DiGeorge syndrome critical region gene 8), into shorter stem-loop or hairpin structured RNA molecules called precursor miRNAs or pre-miRNAs (Figure 1.1). The cleavage of pri-miRNAs by Drosha generates a 5′ phosphate and a two nucleotide 3′ overhang on the pre-miRNA molecule.13 Pre-miRNAs are approximately 70 nucleotides in length and contain the mature miRNA in either the 5′ or 3′ half of the stem.14 Pre-miRNAs are then transported from the nucleus to the cytoplasm by Exportin-5,15 where they are further processed by Dicer along with TAR RNA binding protein (TRBP) to produce the double-stranded miRNA/miRNA* duplex.16-20 The miRNA/miRNA* duplex is unwound and one strand is preferentially loaded into the RNA-induced silencing complex (RISC). The RISC complex, containing the Argonaute proteins, associates the mature miRNA with its single-stranded complementary mRNA targets.
Figure 1.1. The miRNA pathway depicting the transcription and processing of miRNAs and the miRNA induced translational repression of target mRNAs. Ada
Macmillan Publishers Ltd: Nat Cell Biology
1.2 MicroRNAs in Disease
Because the role of miRNAs is to regulate
misregulation of intracellular miRNA levels leads to the misre which can have severe implications on cellular homeostasis.
many biological processes including embryonal development, cell differentiation, apoptosis, and proliferation.29 Targets of miRNAs range from signaling proteins, metabolic enzymes, The miRNA pathway depicting the transcription and processing of miRNAs and miRNA induced translational repression of target mRNAs. Adapted by permission from
Nat Cell Biology, 2009, 11, 3, 228.
Because the role of miRNAs is to regulate the expression of specific mRNAs, the misregulation of intracellular miRNA levels leads to the misregulation of its mRNA targets, have severe implications on cellular homeostasis. MicroRNAs are involved in many biological processes including embryonal development, cell differentiation, apoptosis, Targets of miRNAs range from signaling proteins, metabolic enzymes,
4 The miRNA pathway depicting the transcription and processing of miRNAs and by permission from
5 and transcription factors to RNA binding proteins.30 The diversity of miRNA targets suggest that they are involved in every cellular network, including signal transduction, gene regulatory, metabolic, and protein interaction networks.30 It has further been shown that each miRNAs targets ~200 transcripts on average,31 demonstrating the extensive role of each individual miRNA. Importantly, variations in the expression of certain miRNAs have been linked to a wide range of human diseases, including cancer, cardiovascular diseases, immune disorders, and viral infections.32-36
In particular, the misregulation of miRNAs has been associated with the initiation, progression, and metastasis of cancer, and certain miRNAs have been linked to a resistance to apoptosis.37 It has been observed that human cancers commonly display an altered expression profile of miRNAs with anti-apoptotic (e.g., miR-21, miR-155, or miR-214) or tumor suppressive (e.g., let-7a, miR-15, miR-16, miR-34a, miR-143 or miR-145) activity.37,
38, 39
6 signatures not only allow for the differentiation of healthy and cancerous cells, but can also predict the type of cancer presented as well as the primary origin of the malignant tissue.42, 44
7 Table 1.1. Select microRNAs that are misregulated in cancer. Adapted by permission from Macmillan Publishers Ltd: Nat. Rev. Drug Discov. 2013, 12, 847.
1.3 Endogenous Regulation of MicroRNAs
8 function, Nature has developed several regulatory mechanisms to control the expression level of individual miRNAs.47, 48 Endogenous regulation can occur at three different levels, pre-transcription, pre-transcription, and post-transcription.49
The first type of regulation occurs prior to transcription. Regulation at this level can be affected by a change in miRNA gene copy number, a mutation in the miRNA gene, or histone deacetylation and hypermethylation of miRNA promoter regions.39, 50, 51 It was reported that altered or mutated genomic loci containing miRNA genes occurred in 37% of ovarian cancers, 73% of breast cancers, and 86% of melanoma cases.52 DNA methylation and histone modifications play critical roles in chromatin remodeling and general regulation of gene expression, therefore, the control of miRNA expression by these epigenetic alterations was investigated in cancer cells treated with the a small molecule DNA-demethylating agent (5’-aza-2’-deoxycytidine) and a histone deacetylase inhibitor (4-phenylbutyric acid) by microarray.53 It was shown that the tumor suppressive miRNA miR-127, which regulates the human proto-oncogene BCL6, is down-regulated in the T24 bladder cancer cell line due to a high level of methylation in its promoter region. Treatment of T24 cells, and other cancer cell lines, with demethylating agents lead to an increased expression of miR-127.53 In addition, of the 313 human miRNAs that were analyzed, another 16 miRNAs were up-regulated >3-fold by treatment of the T24 cell line with the demethylating agents, whereas no change was observed in LD419 (normal human fibroblast) cells.53