A Review on ECG Detection and Analysis
Using MATLAB
Satish S Asane1, AmitM Rawate2, Pravin Kamble3
PG Student, Department of E&TC, CSMSS College of Engineering Aurangabad, India1
HOD, Department of E&TC, CSMSS College of Engineering Aurangabad, India2
Assistant Professor, Department of E&TC, CSMSS College of Engineering Aurangabad, India3
ABSTRACT: ECG is very important tool in diagnosis case and biomedical field it records and measure all primary parameter related to heart. Electrocardiograph (ECG) Waveform to detect abnormalities present with reference to P, Q, R and S peaks. The first phase includes the acquisition of real time ECG data .In next stage generation of signals followed by pre-processing last stage take ECG signal is subjected to feature extraction Almost 30% of worldwide death cases are caused by Heart attack diseases and this number is expected to increase. This Project aims to reduce this high-rate by developing a detection methodology to be used in finding various diseases and their abnormalities. Future work includes compiling the 5-lead algorithm with a phone application and webserver to make usable by all patients
KEYWORDS: MIT-BIH Database, ECG (Electrocardiograph),P Wave,QRS interval, R-R interval, T-wave
I. INTRODUCTION
ECTROCARDIOGRAM (ECG or EKG) is a diagnostic tool that measure and records the Electrical activity of the heart in exquisite detail. The first phase includes the acquisition of real time ECG data. In the next phase, generation of signals followed by pre-processing. Thirdly, the procured ECG signal is subjected to feature extraction. The extracted features detect abnormal peaks present in the waveform Thus the normal and abnormal ECG signal could be differentiated based on the features extracted. The work is implemented in the most familiar multipurpose tool, MATLAB. This software efficiently uses algorithms and techniques for detection of any abnormalities present in the ECG signal. Proper utilization of MATLAB functions (both built-in and user defined) can lead us to work with ECG signals for processing and analysis in real time applications.
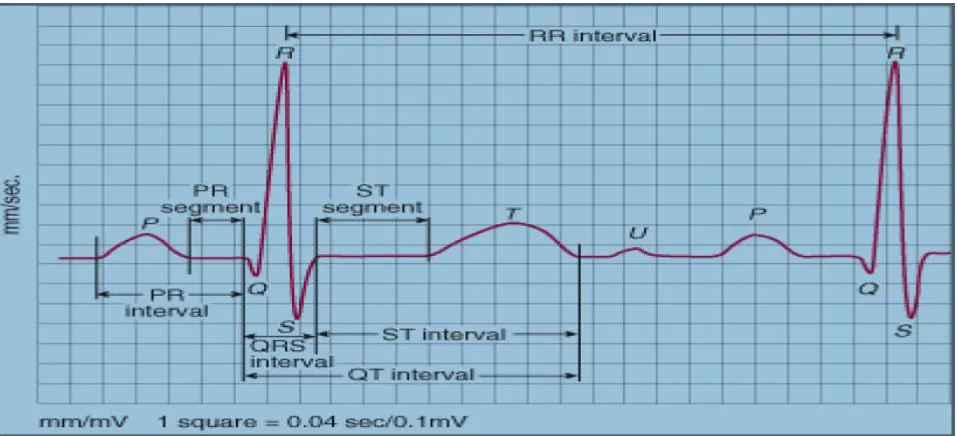
The heart is one of the most critical organs in the human body, thus the development of methods for monitoring its functionality is crucial. Electrocardiography is considered to be one of the most powerful diagnostic tools in medicine that is routinely used for the assessment of the functionality of the heart. The electrical signals travel through the electrodes to the ECG device, which records them as characteristic waves. Different waves reflect the activity of different areas of the heart which generate the respective flowing electrical currents.
Fig. 1 shows a representation of an ECG with normal waveform
An electrocardiogram (EKG or ECG) is done to:
● Check the heart's electrical activity, how fast your heart is beating.
● Find the cause of unexplained chest pain, which could be caused by a heart attack, inflammation of the sac surrounding the heart (pericarditis), or angina.
● Find the cause of symptoms of heart disease, such as shortness of breath, dizziness, fainting, or rapid, irregular heartbeats (palpitations).
● Find out if the walls of the heart chambers are too thick (hypertrophied).
● Check how well medicines are working and whether they are causing side effects that affect the heart.
II. RELATED WORK
The Electrocardiogram (ECG) is the conventional method for non‐ invasive interpretation of the electrical activity of the heart in real‐time. The electrical cardiac signals are recorded by an external device, by attaching electrodes to the outer surface of the skin of the patient’s thorax. These currents stimulate the cardiac muscle and cause the contractions and relaxations of the heart [1]Analysis of Electrocardiograph (ECG) Signal for the Detection of Abnormalities Using MATLAB Durgesh Kumar Ojha, Monica Subashini World Academy of Science, Engineering and Technology International Journal of Medical, Health, Biomedical, Bioengineering and Pharmaceutical Engineering Vol:8, No:2, 2014 In this work normal and abnormal Q,R,S value compared this work related to the arrhythmias diseases[1]
The process of analysing the ECG signal can be divided into two stages: the stage of pre-processing and feature extraction. Preprocessing means removing noise (electromyographycal potentials of muscles, artifacts of electrodes interaction with skin, amplifiers, electronic noise and background noise network) [2]. Noise is considered to be high-frequency cardio components. Noise removal leads to compression and smoothing the ECG signal. The stage of feature extraction from cardio signal is the process of finding the required information (the teeth, complexes, etc.).Julia Tverdohleb, Valery, Dubrovi ,International Journal of Advanced Science and TechnologyVol. 30, May, 2011
R-peaks by combining threshold value and peak address position. So the R-peaks are detected more effectively compared to ATV. Analysis of ECG is done using Daubechies wavelet transform. The decomposition coefficients are considered and compared here. The d1 to d5 coefficients are studied for normal, ECG of driver under stress, Sudden Cardiac arrest and Arrhythmia. It was found that d1 to d3 coefficient. [7]
Heart rates in Adults: Normal- 60-100 beats/min.
Tachycardia- greater than 100 beats/min. Bradycardia- lesser than 60 beats/min. Heart rates in Children:
New Born- 110- 150 bpm 2 years- 85-125 bpm 4 years- 75-115 bpm 6 years+ - 60-100 bpm
III.PROPOSED ALGORITHM
The Methodology of the Proposed Work can be explained using fig.2.The aim of project is to maximize the accuracy of ECG signal and faster work in analysis of diseases sothat we improve quality of work and easy detect diseases provided some important data related to diseases. The WFDB Toolbox for MATLAB is a collection of applications for reading, writing, manipulating, and plotting PhysioBank data, implemented as functions in MATLAB. We use this tool for converting and extract feature ECG signal
A. REAL TIME RAW ECG DATA
The Raw ECG of MIT-BIH database is taken from physionet.org and uploaded in matlab using WFDB toolbox .The uploaded data consist of two overlapped ECG .This overlapped ECG is splitted into a single, where the y axis represents amplitude and x axis represents samples
B. ECG GENERATION
The ECG signal is generated by the MATLAB code from real time data. The objective is to produce the typical ECG waveforms of different interval and Points This technique has many advantages in the Simulation of ECG waveforms. Firstly saving time, secondly removing noise and thirdly P, Q, R,S detection in an easy manner, the significant features of waveform are the P, Q, R, S waves, theduration of each wave and time intervals such as P-R, S-T andQ-T intervals. ECG signal is periodic with fundamentalfrequency determined by the heartbeat. It also satisfies theDirichlet’s condition. Hence, Fourier series can be used torepresent an ECG signal. If we observe Fig. 1 carefully, wemay notice that a single period of an ECG signal is a mixtureof triangular and sinusoidal waveforms. The significantfeature of ECG signal can be represented by shifted and scaledversions. Such one waveform is shown in Fig. 1.
• QRS, Q and S portion of ECG signal can be representedby triangular waveforms. • OP, T and U portions can be represented by triangularwaveforms.
C. PRE-PROCESSING
Fig.2 Proposed Algorithm flowchart
D.DETECTION OF DIFFERENT INTERVAL AND COMPARED
After the calculation of values the Classification Procedure is done in this classification a certain threshold value is beingset which can be set by observing it on to different database samples and by observing different samples the threshold value isset. Here for the classification a simple threshold based classifier is proposed, here after the observation of different values aparticular threshold value is set and the normal and abnormal margin is calculated. So that it can classify the signal in to normaland abnormal. The classification mainly depends on the extracted value.
IV. CLINICAL IMPORTANT PARAMETERS
A. RR-Interval: - The interval between an R wave and the next R wave; normal resting heart rate is between 60 and 100 bpm Duration of RR-Interval 0.6 to 1.2s.
B. P-Wave: - During normal atria depolarization, the main electrical vector is directed from the SA node towards the AV node and spreads from the right atrium to the left atrium. This turns into the P wave on the ECG. Duration of P-Wave is 80ms.
C. PR-Interval: - The PR interval is measured from the beginning of the P wave to the beginning of the QRS complex. The PR interval reflects the time the electrical impulse takes to travel from the sinus node through the AV node and entering the ventricles. The PR interval is, therefore, a good estimate of AV node function. Duration of PR-Interval is 120 to 200ms.
D. PR-Segment: - The PR segment connects the P wave and the QRS complex. The impulse vector is from the AV node to the Bundle of His to the bundle branches and then to the Purkinje fibers. This electrical activity does not produce a contraction directly and is merely traveling down towards the ventricles, and this shows up flat on the ECG. The PR interval is more clinically relevant. Duration of PR-Segment is 50to120ms.
E. QRS-Complex: - The QRS complex reflects the rapid depolarization of the right and left ventricles. The ventricles
Real time data from
MIT-BIH
ECG Generation
Pre-processing of signal
Comparisons of normal
and abnormal waveform
F. ST- Segment: - The ST segment connects the QRS complex and the T wave. The ST segment represents the period when the ventricles are depolarized. It is isoelectric. Duration of ST-Segment is 80to120ms.
G. ST- Interval: - The ST interval is measured from the J point to the end of the T wave. Duration of ST-Interval is 320ms.
H. QT-Interval: - The QT interval is measured from the beginning of the QRS complex to the end of the T wave. Aprolonged QT interval is a risk factor for ventricular tachyarrhythmia and sudden death. It varies with heart rate and, for
Clinicalrelevance requires a correction for this, giving the QTc. Duration of QT-Interval is up to 420 ms in heart rate60 bpm.
V. CONCLUSION AND FUTURE WORK
The paper presents an original work related to comparison of ECG Signals. Simulation of dynamical systems is one of the challenging computational tasks because of its numerical complexity and simulation time The simulation has been done in MATLAB for various sets of inputs such as normal (sinus), bradycardia, tachycardia, stress condition of ECG signals. Some results and discussions are clearly exposed. The implication of this research may be helpful for scientific researchers in the area of ECG signals processing. So, cardiac patient can be identified by finding his ECG energy levels and comparing them with that of a normal person ECG.
This method can be used to identify other heart disorders also. For all the results obtained in this work, we used the MATLAB programming environment. It works well to maintain the original signal and has important practical value. The reference ECG signal were created using a predefined authentic source take from MIT-BIH real time data Future work includes compiling the 5-lead algorithm with a phone application and webserver to make usable by allpatients
REFERENCES
1.Durgesh Kumar Ojha, Monica Subashini,World Academy of Science, Engineering and Technology International Journal of Medical, Health, Biomedical, Bioengineering and Pharmaceutical Engineering Vol:8, No:2, 2014
2.https://www.physionet.org/physiotools/matlab/wfdb-app-matlab
3.http://www.patient.co.uk/health/electrocardiogram-ecg 4. http://house.wikia.com/wiki/Electrocardiogram
5. http://www.akwmedical.com/blog/what-ekg-machine-and-how-does-it-work
6.AnandKumar Joshi, ArunTomar, MangeshTomar,International Journal of Advanced Research in Electrical,Electronics and Instrumentation Engineering(An ISO 3297: 2007 Certified Organization)Vol. 3, Issue 10, October 2014
7.J.S Dhir, N.K. Panag, International Journal of Innovative Research in Computerand Communication Engineering(An ISO 3297: 2007 Certified Organization)Vol. 2, Issue 2, February 2014
BIOGRAPHY
Satish S Asaneis PG Student in Electronics and Telecommunication Department, CSMSS CHH .Shahu College of Engineering Aurangabad (M.S) India I Completed B.E in E&TC from SITS Pune, Pune University My interest area is biomedical field
Amit M Rawateis Head of Electronics and Telecommunication Department, CSMSS CHH .Shahu College of Engineering Aurangabad (M.S) India