A comparison of satellite and surface surveys of geomagnetic anomalies is performed. A special regional aero-magnetic survey was carried out at the Urals. Different models of the reference field for the region under investigation were studied. A reference field has been constructed using polynomial of 4-th order. The long-wavelength compo-nent of the anomalous magnetic field was selected. It is shown that when dividing the magnetic field of the Earth into a main and anomalous parts by spherical harmonic analysis, a large part of the magnetic field from the crust is included within the main field model. A model of the crustal magnetization of the Northern Eurasia is constructed.
1.
Introduction
One of the most important and complicated problems of up-to-date magnetometry on using it for investigation of the Earth’s crustal magnetization (especially in the case of long-wavelength anomalies) is the reference field. Actually, what is the reference field for the anomalies with the range of some thousand kilometers?
Satellite magnetometry opens new possibilities for the in-vestigations of the crustal magnetization and studies of so-called intermediate-wavelength band (hundreds to thousand kilometers), thus offering insights on the composition, struc-ture and evolution of the lithosphere. One major advantage of orbital satellite magnetic field surveys is their ability to cover a global set of magnetic field measurements of uni-form precision at a single epoch. The data set is consistent and free from secular variations.
The goal of the work proposed is to study the applicabil-ity of the satellite main field model as a reference field for airborne survey data.
2.
The Comparison of the Airborne and Satellite
Magnetic Data
The aeromagnetic surveys were carried out along seven east- west geotraverses crossing the Urals and neighbouring parts of east European platform and west Siberian plate be-tween 52–72◦E. Five geotraverses with the length up to 1200 km are the main profiles (the survey heights were 150, 500, 1000, 2000 and 4000 m above ground) and other two are parallel auxiliary profiles in 50 km to the north and to the south from the main ones (the survey heights here were 2000 and 4000 m). (Shapiroet al., 1986; Fedorovaet al., 1989).
Spherical harmonic series (SHS) were used for the analyt-ical representation of the main magnetic field. We studied MGST (Langelet al., 1980a), GSFC (Langelet al., 1982), IGRF-1980 and M102389 (Cainet al., 1989a) as models of the main magnetic field. F-total model fields were consis-tent with the surface aeromagnetic survey data within 25 nT
Copy right cThe Society of Geomagnetism and Earth, Planetary and Space Sciences (SGEPSS); The Seismological Society of Japan; The Volcanological Society of Japan; The Geodetic Society of Japan; The Japanese Society for Planetary Sciences.
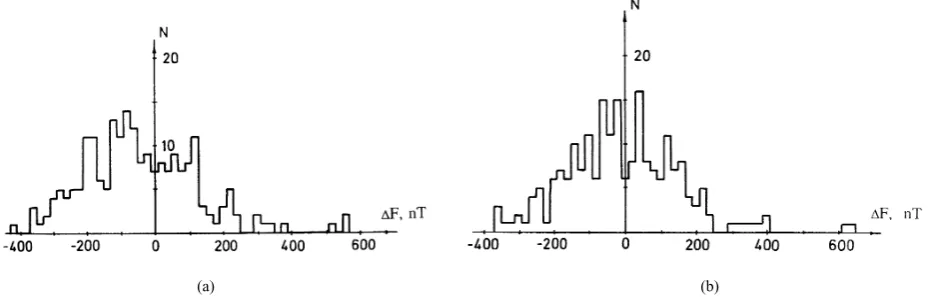
over the studied area of 50–70◦N latitude and 50–80◦E. Thus, for the subsequent analysis we used the MGST model as the satellite data. Figure 1 shows the distribution of residual field computed from uniformly distributed aero-magnetic survey data, referenced to MGST models. This distribution does not follow the normal pattern: the mean is −50 nT and the standard deviation is 220 nT. There is a systematic underestimation of the anomalous field.
For the studied area, the regional reference field has been constructed from the
airborne data (Fedorovaet al., 1989). We adopted the poly-nomials as follows, using gephraphical coordinates.
Hereφ,λare the latitude and longitude of the observa-tion point,φ0,λ0are the coordinates of the central point of
the area, N is the degree of the polynomial, andai,k is the
polynomial coefficient.
When the reference field is approximated by a polynomial, the result essentially depends onN, the degree of the polyno-mials. Models of the regional reference fields were computed using third- and fourth-degree polynomials. Regional fields had a good match for the entire area of the aeromagnetic sur-vey: the maximum discrepancy was less than 30 nT, and the standard deviations = ±16 nT. Polynomials of the fourth degree were finally adopted as the model of the regional refer-ence field. The statistical estimates of the distribution of the residual field (F) is presented as a histogram in Fig. 1(b). The distribution in this case showed the normal pattern; the mean Fa= −2 nT, the standard deviations= ±165 nT.
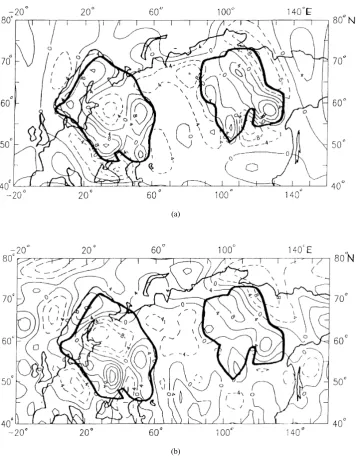
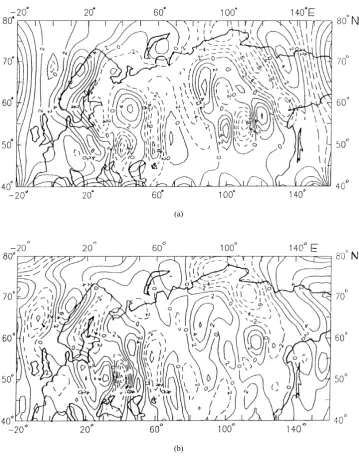
We compared this regional reference field with the model of the main field MGST. The difference between the ref-erence field and the MGST main field represents so called intermediate wave length anomaly, which is longer than 1500 km (Fig. 2(b)). The anomaly intensity ranges from+50 nT on East European platform to−100 nT at the Urals and the West Siberian platform. The pattern of this anomaly (the highs and lows) is similar to the Magsat satellite residual fields (Fig. 2(a)). The consistent features of all the global
398 N. V. FEDOROVA AND V. A. SHAPIRO: REFERENCE FIELD FOR THE AIRBORNE MAGNETIC DATA
(a) (b)
Fig. 1. Histogramms of the anomalousfield from the regional aeromagnetic survey data. (a) Magsat (MGST) mainfield as a reference; (b) Regional magneticfield as a reference.
(a) (b)
Fig. 2. (a) Magsat scalar magnetic anomaly map (400 km altitude, 2 nT contour interval); (b) Scalar long-wavelength magnetic anomaly map (2 km altitude, 50 nT contour interval).
magnetic anomaly maps based on Magsat data (Langelet al., 1982; Arkani-Hamed and Strangway, 1985; Coles, 1985; Cainet al., 1989a; Cohen and Achache, 1990) are the large negative anomaly in the West Siberian Basin and the positive anomaly in East of the East European Platform. A more com-plete comparison of anomalies between airborne and satellite data could be achieved by referencing these results to a com-mon level: recalculating either the aeromagnetic data to an altitude of 400 km or the satellite data to the Earth’s surface. The former method would be preferable, but it is difficult be-cause of the limited area coverage of the aeromagnetic survey and the high altitude of the satellite observations. Cainet al. (1989a) approximated Magsat data by spherical harmonic series upn =63 and satellite data were downward contin-ued to ground level. The intensity of the satellite anomalies calculated at the ground level has increased the amplitudes of the anomalies: the positive anomaly in the eastern Europe
grew to+30 nT; the negative anomaly in the western Siberia to−30 nT. However, these value are smaller than anomalies identified from aeromagnetic data (Fig. 2(b)).
Thus, when using Magsat main field model as a nor-mal field for the aeromagnetic surveys, we have to correct Magsat reference field because aeromagnetic data include long-wavelength components.
Fig. 3. Tectonic map of the Northern Eurasia. 1. Ancient Precambrian platforms. 2. Archean sheelds. 3–7. Folded belts: 3. Kazakstan- North-Tien-Shan, 4. Pamirs-Alay, 5. Hercynian zones (the Urals, Mongol-Okhotsk, Scandinavia), 6. Sayani-Altai, 7. Verchoyansk-Kolima. 8. Paleozoic cratons. 9. Prepiphean massives. 10. Marginal volcanic massives.
400 N. V. FEDOROVA AND V. A. SHAPIRO: REFERENCE FIELD FOR THE AIRBORNE MAGNETIC DATA
(a)
(b)
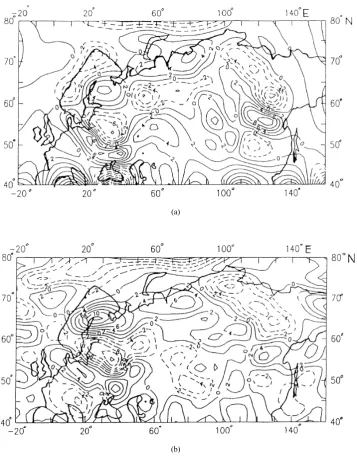
Fig. 5. The vertical componentZmap for Northern Eurasia (400 km altitude, 4 nT contour interval): (a) residual crustalfield from the model, (b) Magsat anomalies according to Cainet al.(1989a). Contour of the ancient platforms pictured with a thick curves.
3.
Crustal Sources in the Northern Eurasia
For East European Platform, Pashkevichet al.(1990), Or-luk and Pashkevich (1994) calculated magnetic anomalies at satellite altitude from crustal sources obtained from aeromag-netic data and compared the results with Magsat anomalies. The locations of magnetic highs and lows coincide well, but the intensity of the anomalies differed significantly. Orluk and Pashkevich (1994) concluded that the Magsat normal
field for Europe must be corrected.
Over Northern Eurasia, the interpretation of the satellite extended negative magnetic anomalies (Z or F) is a com-plicated problem: the researchers are forced either to rise the level of the field (Nolte and Hahn, 1992) or to allow the existence of extended rock massifs magnetized against the modern magneticfield (Arkani-Hamed and Strangway, 1985, 1986; Taylor and Ravat, 1995).
One of the major discussions on the Magsat crustal anoma-ly is the absence of ocean-continent magnetization contrast. The lack of magnetization contrast has been attributed either to the subtraction of these features along with removal of
fields from the mainfield model (Meyeret al., 1985; Langel, 1990; Counilet al., 1991), or to the insufficient resolution (Arkani-Hamed, 1990). Meyeret al.(1985) and Rajaram and Langel (1992) showed that spherical harmonic models do not only represent the core fields, but also include anomalous
fields caused by the continent-ocean contrast.
(a)
(b)
Fig. 6. The same as Fig. 5 forX-component.
a spherical harmonic analysis of thefield is dominated by the
field from the core up to degree 12, and by thefield from the crust above degree 14. Cainet al.(1989b) showed that the point where the energy density of the core and crustal compo-nents become equal at the Earth surface isn=14.2 and half the crustal power is extrapolated ton=0. Magsat anomalies are the residual; anomalies; they are the differences between the observedfield and SHSfields with degrees and orders up ton =m=13.
In this part of paper we have investigated the problems of separation the mainfield and anomalies from the large lithospheric sources through SHS by means of modelling of magneticfields from the sources located in the crust of the East European and West Siberian platforms.
The Eurasian continent is a complex region of varying tectonic styles and large-scale tectonic provinces ranging in age from Archean to Neogene. There are two Precambrian
platforms here (the East European and the East Siberian) and the young orogenic provinces—Paleozoic of Western Europe and the Western Siberia, and Mesozoic Verkhoyanck-Kolima (Fig. 3).
The crust of the ancient platforms is thicker and colder than the crust of younger cratons. According to the seis-mic data, the thickness of the Paleozoic crust is 30–35 km while that of the Precambrian crust is 42–55 km (Milanovsky, 1989). The heatflow of the Precambrian cratons is low (30–
402 N. V. FEDOROVA AND V. A. SHAPIRO: REFERENCE FIELD FOR THE AIRBORNE MAGNETIC DATA
(a)
(b)
Fig. 7. The same as Fig. 5 forY-component.
km. Thus, aeromagnetic data may indicate the sharp magne-tization contrasts within the continental lithosphere. These contrasts are possibly associated with lithospheric blocks of different ages.
In the lithosphere of the Precambrian platform, there are numerous magnetized blocks, whose distributions are fairly similar. The step-like anomalies over the marginal parts of the platforms are indicative of large average magnetization of the ancient crustal rocks. These allow us to analyze the homogeneous magnetization of the cratons from the aero-magnetic data at the height more than 300 km.
The calculations were done for a spherical globe. The spherical rectangular parallelepipeds were used as magnetic sources elements. The algorithm of magnetic effects of such bodies is described by Manukjan and Starostenko (1984). The geometry of each platform was given as a set offifty parallelepipeds with the average sizes of 400 km×400 km.
The objects are located from the top of the crystalline foun-dation down to the bottom of the crust. Calculations were done for the homogeneous magnetization (2 A/m) for all the prisms, except the Kursk magnetic anomaly region (see Fig. 3, in the Southern part of the East-European Platform), which is characterized by extremely high magnetization (6 to 12 A/m). The direction of magnetization follows the modern
field.
It is difficult to tell which part of the long-wavelength anomalies is of crustal origin. To interpret the satellite anomalies, we carried out transformations of thefield from synthetic lithospheric sources to Magsat altitude. The resid-ualfields from the model sources were calculated as follow: (1) the directfield (magneticfield due to the crustal source) was computed,
Fig. 8. The long-wavelength vertical componentZat the Earth surface, calculated from termsn=1 to 13.
computed,
(3) the residualfield (as a difference between (1) and (2)) was computed.
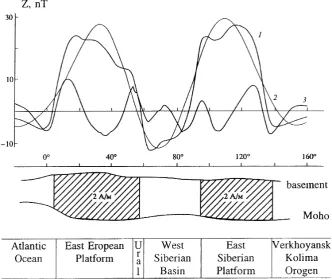
Figure 4 displays a cartoon depicting the model used in our calculation. The curve 1 is the vertical field compo-nent Z from the model, calculated for the altitude of 400 km along profile at latitude 60◦N. The curve 2 is the ap-proximated fields with SHS. The curve 3 is the residual
field. As the residualfield is very different from the direct
field, it is very difficult to imagine for each platform that this is afield produced by a single homogeneously magne-tized object: negative anomalies exist above centers of the regions and the intensity of the positive anomalies consider-ably decreases. When comparing the residualfield from the model (Fig. 5(a)) with thefield Z of the Magsat anomalies (Fig. 5(b)), one can note good coincidence of characteristics in bothfields. For comparison, we used Magsat data from Cainet al.(1989a). We note significant coincidences of the patterns compiled from the components X andY (Figs. 6 and 7).
There is a significant contribution to the mainfields from the crustal anomalies, which are magnetized in the direction of the modernfield. The sources in the Northern Eurasian crust are the rocks of an ancient cratons; magnetic anomalies from these sources contain bands with the wavelength of 80–
90 degree and intensity of 20–30 nT at the Magsat altitude (400 km). Contribution of the crustal sources is present in the SHS terms even for degreen=10. Thus, results of the modeling show that the spectra of the main geomagneticfield and those of litospheric anomalies are overlapping.
A crustal field decreases rapidly with altitude and it is more pronounced in the near surface data than in the satellite data. The crustal component constitutes less then 0.1% of the geomagneticfield at altitude 400 km and is mainly repre-sented by the low spherical harmonics. As seen in Fig. 8, the intensity of long-wavelength crustal components of the syn-thetic model (which are contained in the terms fromn=1 to n=13) is from−40 nT to+60 nT. This is more than twice
larger than that at the satellite altitude (Fig. 5(a)). Thus, it is impossible to use the Magsat mainfield as a referencefield for the regional aeromagnetic data.
4.
Conclusion
Our study showed that the mainfield model obtained from the satellite data cannot be used as a referencefield for the aeromagnetic survey. We constructed a regional reference
field for the study area. We used the 4-th degree polyno-mial on geographical coordinates. The difference between Magsat model and regional model has indicated that satellite mainfield model includes long-wavelength component with the length more than 1500 km and the intensity from+50 nT to−100 nT at the ground level.
The comparison between the airborne and satellite surveys showed disagreements. This indicates that a significant part of the lithospheric anomalies is included in the Magsat main
field.
The model of the magnetization of the crystalline rocks from the Northern Eurasian crust was constructed. The re-sults of the modelling reveal the significant differences be-tween direct effects from the cratons and residualfields at the satellite altitude.
The Northern Eurasia has a very complex tectonic ma-trix. Satellite and aeromagnetic data showed that sharp mag-netization contrasts exist within the continental lithosphere, associated with lithospheric blocks of different ages. The satellite anomalies over the Western and the Eastern Europe are generated by the sources of the ancient Precambrian East-European platform, where rocks are magnetized in the mod-ernfield direction. Magnetic anomalies in the Northern Asia are generated by the crust of the ancient Eastern Siberian cra-ton. According to our estimations, the average magnetization of the rocks here is to 2 A/m.
404 N. V. FEDOROVA AND V. A. SHAPIRO: REFERENCE FIELD FOR THE AIRBORNE MAGNETIC DATA
Acknowledgments. The authors are grateful to Dr. Chursin who
organized the airborne survey at the Urals. We are greatly indebted to Dr. J. Cain, who provided us with the model data M231089. The authors would like to express their thanks to Dr. M. Purucker and other referees for reviewing the paper and giving constructive comments. This research was supported by Fund of Fundamental Research of the Russian Academy Sciences, Grant 96-05-65313.
References
Arkani-Hamed, J. and W. J. Hinze, Limitations of the long-wavelength components of the North America,Geophysics,55, 1577–1588, 1990. Arkani-Hamed, J. and D. W. Strangway, Intermediate-scale magnetic
anomalies of the Earth,Geophysics,50, 2817–2830, 1985.
Arkani-Hamed, J. and D. W. Strangway, Magnetic susceptibility anomalies of lithosphere beneath Eastern Europe and Middle East,Geophysics,51, 1711–1723, 1986.
Arkani-Hamed, J., J. Verhoef, W. Roest, and R. Macnab, The intermediate-wavelength magnetic anomaly maps of the North Atlantic ocean derived from satellite and shipborne data,Geophys. J. Int.,123, 727–743, 1995. Cain, J. C., Z. Wang, C. Kluth, and D. R. Schmitz, Derivation of geomagnetic
model ton=63,Geophys. J. R. astr. Soc.,97, 431–441, 1989a. Cain, J. C., Z. Wang, D. R. Schmitz, and J. Mejer, The geomagnetic spectrum
for 1980 and core-crustal separation,Geophys. J. R. astr. Soc.,97, 443– 447, 1989b.
Chermak, V., Litospheric thermal regimes in Europe,Phys. Earth Planet. Inter.,79, 179–193, 1993.
Cohen, Y. and J. Achache, New global vector magnetic anomaly map derived from Magsat data,J. Geophys. Res.,95, 10783–10800, 1990.
Coles, R. L., Magsat scalar magnetic anomalies at northern high latitudes, J. Geophys. Res.,90, 2576–2582, 1985.
Counil, J.-L., Y. Cohen, and J. Achache, The global continent-ocean mag-netization contrasts,Earth Planet. Sci. Lett.,103, 354–364, 1991. Fedorova, N. V., V. A. Shapiro, and L. O. Tjurmina, Referencefield in
regional aeromagnetic surveying and detection of long-wave geomagnetic anomalies, Izvestiya Akademii Nauk SSSR,Earth Phys.,25, 345–350, 1989 (in Russian).
LaBrecque, J. L. and S. C. Cande, Intermediate-wavelength magnetic anomalies over the central Pacific,J. Geophys. Res.,89, 11124–11134, 1984.
Langel, R. A., Study of the crust and mantle using magnetic surveys by Magsat and other satellites. Invited submission for‘Geomagnetic meth-ods and structure of the crust and mantle beneath India’,Proc. Indian Acad. Sci. (Earth Planet. Sci.),99, 581–618, 1990.
Langel, R. A. and R. H. Estes, A geomagneticfield spectrum,Geophys. Res. Lett.,9, 250–253, 1982.
Langel, R. A., R. H. Estes, G. D. Mead, E. B. Fabiano, and E. R. Lancaster, Initial geomagneticfield model from Magsat vector data,Geophys. Res.
Lett.,7, 793–796, 1980a.
Langel, R. A., R. L. Coles, and M. A. Mayhew, Comparisons of magnetic anomalies of litospheric origin measured by satellite and airborne mag-netometers over western Canada,Can. J. Earth Sci.,17, 876–887, 1980b. Langel, R. A., R. H. Estes, and G. D. Mead, Some new methods in geo-magneticfield modelling applied to the 1960–1980 epoch,J. Geomag. Geoelectr.,34, 327–349, 1982.
Lugovenko, V. N., Statistical Analysis of Anomalous Magnetic Field, 200pp., Nauka, Moscow, 1974 (in Russian).
Manukjan, A. G. and V. I. Starostenko, Decision of direct magnetometric problem on spherical Earth,Doklady Academii Nauk USSR,5, 11–17, 1984 (in Russian).
Meyer, J., J. H. Hufen, M. Siebert, and A. Hahn, On the identification of Magsat anomaly charts as crustal part of the internalfield,J. Geophys. Res.,90, 2737–2541, 1985.
Milanovsky, E. E.,Geology of USSR, part 2, 279pp., Moscow, MGU, 1989 (in Russian).
Nolte, H. J. and A. A. Hahn, A model of the distribution of the crustal magnetization in central Europe compatible with thefield of magnetic anomalies deduced from Magsat results,Geophys. J. Int.,111, 483–496, 1992.
Orluk, M. I. and I. K. Pashkevich, Technique and results of the interpretation of the anomalous magneticfield from ground and satellite data,Doklady Academii Nauk Ukraina,4, 120–123, 1994 (in Russian).
Pashkevich, I. K., V. C. Markovski, M. I. Orluk, S. V. Eliseeva, A. P. Moz-govaij, and S. A. Taraschan,The Magnetic Model of the European Litho-sphere, 166pp., Kiev, Naukova dumka, 1990 (in Russian).
Rajaram, M. and R. A. Langel, Magnetic anomaly modelling at the Indo Eurasian collision zone,Tectonophysics,212, 117–127, 1992. Shapiro, V. A., A. V. Tsirulsky, N. V. Fedorova, F. I. Nikonova, A. G.
Dyakonova, A. V. Chursin, and L. O. Turmina, The anomalous mag-neticfield and its dynamics used to study the deep structure and modern geodynamic processes of the Urals,J. Geodynamics,5, 221–235, 1986. Taylor, P. T. and D. Ravat, An interpretation of the Magsat anomalies of
central Europe,J. Appl. Geophys.,34, 83–91, 1995.
Von Frese, R. R. B., W. J. Hinze, J. L. Sexton, and L. W. Braile, Verifications of the crustal components in satellite magnetic data,Geophys. Res. Lett.,
9, 293–295, 1982.
Wellman, P., A. S. Murray, and M. W. McMullan, Australian long-wavelength magnetic anomalies,BMR J. Aust. Geol. Geophys.,9, 297– 302, 1986.
Won, I. J. and K. H. Son, A preliminary comparison of the Magsat data and aeromagnetic data in the continental US,Geophys. Res. Lett.,9, 296–298, 1982.