2016 Joint International Conference on Artificial Intelligence and Computer Engineering (AICE 2016) and International Conference on Network and Communication Security (NCS 2016)
ISBN: 978-1-60595-362-5
Electromagnetic Spectrum Analysis Based Hardware
Trojan Detection Methodology
Jia-Ji HE
a, Yi-Qiang ZHAO
b*, A-Qiang LIU
cSchool of Electronic Information Engineering, Tianjin University, Tianjin, China
a[email protected], b[email protected], c[email protected]
*Corresponding author
Keywords: Hardware Trojan, Electromagnetic Spectrum, Side-channel Analysis, FPGA.
Abstract. Hardware Trojans can be implemented as modifications to ASICs, microprocessors,
microcontrollers or digital-signal processors, and it has raised numerous concerns regarding possible threats to the basis of the network and communication systems. There have been a number of hardware Trojan detection methods, among which side-channel based method is one of the most popular. However, when analyzing the electromagnetic signals obtained from the chip, researchers tend to handle the signals in time domain, neglecting the ample information hidden in frequency domain. We propose a novel hardware Trojan detection methodology by analyzing the electromagnetic spectrum in frequency domain, and the experimental results show that this method is valid in identifying even very small Trojans.
Introduction
Because of the globalization of the semiconductor design and fabrication process, integrated circuits (ICs) are becoming increasingly vulnerable to malicious modifications or alterations[1]. Also with the wide use of third party designs and intellectual properties, ICs are untrusted to the users. All network and communication systems are based on hardware, and the security of these systems lies in the hardware security itself. In order to guarantee the security of the network and communication systems, the hardware used in these systems should be immune to these threats. Hardware Trojans (HTs) are modifications to the original circuits inserted by attackers to gain access to the data or software running on the circuits, and in this way adversaries can even get control of the whole system. Several Trojan detection methods using side-channel information, including the timing, power and electromagnetic (EM) signals, have been proposed[2]. Compared with other methods, electromagnetic radiation has several advantages: easy to obtain, with high resolution, location awareness and rich in information.
In[3], power/EM profiles are used to create a “side-channel fingerprint” for the ICs, and simple side-channel analysis is used to recognize the Trojans. In[4], the authors reflect high dimension special rules without obvious information loss, so as to attain the goal of feature abstraction and identification on EM signals of the circuits. In[5], the traces of EM signals are averaged and compared directly between the original and infected circuits under the same conditions. In[6], a Trojan detection technique by fingerprinting the EM signals of ICs is proposed. To our best knowledge, none of the existing methods focus on the spectrum analysis of the EM signals, and thus the rich information hidden in frequency domain is neglected. So we propose a novel methodology to detect HTs, based on the precise analysis of the EM spectrum.
The rest of the paper is organized as follows. In section II, we explain our spectrum analysis methodology in details. Section III presents the experiments using this approach. Section IV shows the results of HT detection results. We finish with a conclusion and some perspectives in Section V.
Spectrum Analysis Methodology
through the coil is changed due to the variance of the magnitude of the magnetic field. According to the formula of induced electromotive force, represented in Eq. 1, the electromotive force in the coil is changed, where S denotes the area covered by the coil. This variance is captured by the oscilloscope
after amplification, which is the EM signals. d
=
-S
B S dt
. (1)In CMOS devices, all the operations are processed under the control of clocks, leading to changes in different current components, thus the EM signals captured by the oscilloscope in turn reflects the chip’s internal conditions. Then we choose Fourier Transform to convert them from time domain to frequency domain, where further analysis is made. Assume the signal in time domain is S t( ), and its corresponding expression in frequency domain is ( )S , then according to Fourier Transform we have Eq. 2.
( ) ( ) j t
S s t e dt
. (2)Considering the circuit under test in frequency domain, signals captured by the probe include: main clock, whose frequency denoted as g1, some periodic signals generated by the circuits, whose
frequency can be denoted as f1, f2, f3… ff respectively, measurement noise and environment noise,
whose frequency is distributed in a certain range and denoted as N1,N2,N3…Nn respectively, other
unintended signals, denoted as O1,O2,O3…Oo respectively. According to the principle of vector
superposition, if there are N kinds of current components radiating EM signals into the space, and
their magnitude can be denoted as Ai (i=1,2,3…N ) respectively, then the synthesis of them in any
arbitrary location equals the vector superposition of them.
As has been mentioned, with regard to the original circuit, after Fourier Transform, the EM signals captured by the probe can be formulated as Eq. 3, where A1i,A2,A3i,A4i denotes the magnitude of
each frequency components respectively.
1 1 2 1 3 4
1 1 1
( ) ( ) ( ) ( )
f n o
i i i i i i
i i i
A S jf A S jg A S jN A S jO
F . (3)
Presuming a HT with signal transition frequency T1 is inserted into the chip, under the same
circumstances and after Fourier Transform, the EM signals captured by the probe can be formulated as Eq. 4, whereA1i,A2,B3i,A4i,A5denotes the magnitude of each frequency components respectively.
2 1 2 1 3 4 5 1
1 1 1
( ) ( ) ( ) ( )+A ( )
f n o
i i i i i i
i i i
A S jf A S jg B S jN A S jO S jT
F . (4)
By averaging the testing values of repeated measurements and using denoising method, we can weaken the influence of noise on the measurement. Approximately, the difference between
3 1 ( ) n i i i
A S jN
and 31
B ( )
n
i i i
S jN
can be ignored. Therefore, we can tell Trojan circuits from original circuits by checking the distribution of spectrum spots in the acquired EM signals.Without loss of generality, if we presume the signal transition frequency of the inserted HT is T2,
which coincides with a frequency spot of the original circuit (such as the main clock, which is to say
2 1
T g ), then we can determine whether a HT has been inserted into the chip by comparison of the magnitude of frequency spotg1. If T2 dose not coincide with main clock (which is to sayT2 g1), we
those periodic signals. Also by analyzing the aforementioned formulae, we can judge whether a HT has been inserted into the chip by comparison of the magnitude at frequency spot fm.
Experiments
[image:3.612.104.499.252.324.2]Our platform is a SAKURA-G FPGA board[7] which is designed specifically for research and development on hardware security. We place the SAKURA-G board on an X-Y-Z positioning system stably. Then we position a near-field probe right above the main target FPGA to measure its EM emissions. The probe we use is a set of near field probe RF2 from LANGER[8]. After acquiring EM signals by the probe, we have a pre-amplifier PA303[9] to amplify the signal up to 30dB magnification. Then this signal is captured by a Tektronix MSO4054 oscilloscope, and transferred to the control PC for further analysis.
Table 1. Area Variation after Trojan Insertion. Circuit
Parameter G G+T1 G+T2 G+T1+T2
Footprint
area[μm2] 179662.19 180181.11 180161.16 180719.98 Area variation 0% 0.289% 0.289% 0.589%
Note: Area variation of the circuit is defined as the relative variation compared with original circuit G.
Our original circuit is an implementation of the 128-bit version of the AES block cipher which is written in Verilog. The original circuit runs at 1.5 MHz, and is denoted by G. We have two different types of sequential Trojans, and are denoted by T1 and T2, respectively. T1 runs at 1.5 MHz and T2 runs at 2.0MHz. We insert the Trojans into the original circuit by manipulating the Native Circuit Description (NCD) files using the Xilinx FPGA Editor software. The Trojans are evaluated using the method from[10], and we use the Design Compiler (Version D-2010.03-SP5) to synthesize the designs to 180-nm standard cell libraries. The footprint on area is listed in Table 1. During the acquisition process, the vectors used is produced by a pseudo random number generator but remains the same for different sets of circuits. 2000 traces were captured for each circuit, and each trace contains 30000 testing points. The data was stored in the PC for later data processing.
Results and Analysis
Compare in Time Domain
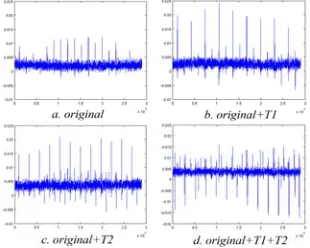
We first average the testing values of many traces, so as to make possible the detection of even small EM contribution from the Trojan circuit compared to the original circuit. Also the measurement noise can be reduced. After that, we denoise our data based on wavelet packet transform. However, when we compare these data under the same coordinate, which is shown in Fig. 1. We can’t find any obvious differences between these traces which may result from the extreme small footprint area. Thus we can’t tell the Trojan circuits from original circuit by directly comparison.
[image:3.612.229.384.609.733.2]Analysis in Frequency Domain
[image:4.612.83.514.263.440.2]In order to analyze these data in frequency domain, we first convert the denoised signals using FFT, and get the signals’ EM spectrum, which is shown in Fig. 2. It is clear in the figures that the high-frequency components, which are mainly noise, are filtered. Also there is one prominent frequency spot which is 48 MHz because of the main FPGA running at the same frequency, and the master clock contributes a lot to the spectrum energy. Then we calculate the Euclidean distance between the original data and the Trojan affected data [11], and the results are shown in Table 2. In order to remove the interferences between the original circuits, we also calculate the Euclidean distance between two different original circuits, which are G and G1, separately. Even though T1 and T2 contribute similar footprint area, but the Euclidean distance of G and T2 is much bigger than that of G and T1, due to that T2 may run at a higher frequency than T1. We may not see this result in time domain, because no matter whether we use power or EM signals, we will neglect the frequency characteristics hidden in the signals.
Table 2. Different circuits’ Euclidean Distance. Group
Parameter G+G1 G+T1 G+T2 G+T1+T2
Euclidean distance 8.96 21.5 45.2 49.9 Distance variation 0% 139.95% 404.46% 456.92%
Note: Distance variation is defined as the relative variation compared with original circuit G.
Figure 2. EM Traces in Frequency Domain.
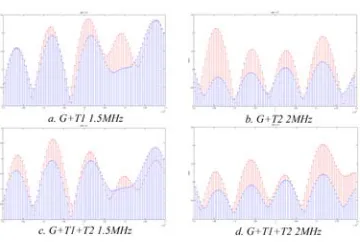
[image:4.612.217.397.487.612.2]Analysis on the Difference of Spectrum Spots
Figure 3. Spectrum Spot Comparison.
anything about the Trojans, so we may need to extend the whole spectrum to find the abnormal spots. At that time we may need some algorithm in identifying these differences.
Conclusion and Future Work
In this work, we propose a novel electromagnetic spectrum analysis based hardware Trojan detection method, and we focus on the spots and energy of the spectrum, in particular. Through experiments, analysis and results, we have demonstrated that this methodology is efficient in distinguishing even tiny Trojans in the original circuit. Our future work may focus on the effect of this method on other original circuits and other types of Trojans, also we need to explore other processing algorithms which can improve the effectiveness of this method.
Acknowledgement
This research is financially supported by the National Natural Science Foundation of China (61376032).
References
[1]Tehranipoor M., Koushanfar F. A survey of hardware Trojan taxonomy and detection [J]. IEEE Design & Test of Computers, 2010, 27(1): 10-25.
[2]Rostami M., Koushanfar F., Rajendran J., et al. Hardware security: Threat models and metrics [C]// Proceedings of the International Conference on Computer-Aided Design. New York: IEEE Press, 2013: 819-823.
[3]Agrawal D., Baktir S., Karakoyunlu D., et al. Trojan detection using IC fingerprinting [C]// Security and Privacy, 2007. SP'07. IEEE Symposium on. IEEE, 2007: 296-310.
[4]Zhang Peng, Wang Xin-cheng, Zhou Qing. Hardware Trojans Detection Based on Electromagnetic Emission Signals Analysis [J]. Acta Electronica Sinica, 2013, 42(2): 341-346. [5]Ngo X.T., Exurville I., Bhasin S., et al. Hardware trojan detection by delay and electromagnetic easurements [C]// Proceedings of the 2015 Design, Automation & Test in Europe Conference & Exhibition. EDA Consortium, 2015: 782-787.
[6]Balasch J., Gierlichs B., Verbauwhede I. Electromagnetic circuit fingerprints for Hardware Trojan detection [C]// Electromagnetic Compatibility (EMC), 2015 IEEE International Symposium on. IEEE, 2015: 246-251.
[7]http://satoh.cs.uec.ac.jp/SAKURA/hardware/SAKURA-G.html.
[8]http://www.langer-emv.com/produkte/stoeraussendung/nahfeldsonden/set-rf2/.
[9]http://www.langer-emv.com/en/products/disturbance-emission/preamplifier/pa-203-303/.
[10]Quisquater J.J., Samyde D. Electromagnetic analysis (ema): Measures and counter-measures for smart cards [M]// Smart Card Programming and Security. Springer Berlin Heidelberg, 2001: 200-210.
[11]Su Jing, Zhao Yi-qiang, He Jia-ji, Liu Shen-feng. Hardware Trojan Detection Based on Euclidian Distance of PCA on Side-channel [J]. Microelectronics & Computer, 2015, 01: 1-4+10.