Article
1
Effects of Long-term Walnut Supplementation on
2
Body Weight in Free-living Elderly: Results of a
3
Randomized Controlled Trial
4
Edward Bitok1,2*, Sujatha Rajaram1, Karen Jaceldo-Siegl1, Keiji Oda1, Aleix Sala-Vila3,4, Mercè
5
Serra-Mir3, Emilio Ros3,4, and Joan Sabaté1
6
7
1 Center for Nutrition, Healthy Lifestyle and Disease Prevention, School of Public Health, Loma Linda
8
University, Loma Linda, CA 92350, United States.
9
2 Department of Nutrition & Dietetics, School of Allied Health Professions, Loma Linda University, Loma
10
Linda, CA 92350, United States.
11
3 Lipid Clinic, Endocrinology and Nutrition Service, Institut d’Investigacions Biomèdiques August Pi Sunyer
12
(IDIBAPS), Hospital Clínic, Barcelona, Spain.
13
4 Ciber Fisiopatología de la Obesidad y Nutrición (CIBEROBN), Instituto de Salud Carlos III (ISCIII), Madrid,
14
Spain.
15
16
* Correspondence: [email protected]; Tel.: +1-909-558-1000 ext. 59820
17
18
Abstract: Objective: To assess the effects of chronic walnut consumption on body weight and
19
adiposity in elderly individuals. Methods: The Walnuts And Healthy Aging study is a dual-center
20
(Barcelona, Spain and Loma Linda University [LLU]), 2-year randomized parallel trial. This report
21
concerns only the LLU cohort. Healthy elders (mean age 69 y, 67% women) were randomly
22
assigned to walnut (n=183) or control diets (n=173). Subjects in the walnut group received packaged
23
walnuts (28-56 g/d), equivalent to ≈15% of daily energy requirements, to incorporate into their
24
habitual diet, while those in the control group abstained from walnuts. Adiposity was measured
25
periodically, and data were adjusted for in-trial changes in self-reported physical activity. Results:
26
After 2 years, body weight significantly decreased (P=0.031), while body fat significantly increased
27
(P=0.0001). However, no significant differences were observed between the control and walnut
28
groups regarding body weight (-0.6 kg and -0.4 kg, respectively, P=0.67) or body fat (+0.9% and
29
+1.3%, respectively, P=0.53). Lean body mass, waist circumference and waist-to-hip ratio remained
30
essentially unchanged. Sensitivity analyses were consistent with the findings of primary analysis.
31
Conclusion: Our findings indicate that walnuts can be incorporated into the daily diet of healthy
32
elders without concern for adverse effects on body weight or body composition.
33
Keywords: Nuts; Walnuts; Body weight; Adiposity; Obesity; Elderly; Energy
34
35
1. Introduction
36
Obesity in older adults continues to be a major public health challenge in the United States
37
(U.S.) and around the world [1, 2]. More than a third of U.S. adults aged 60 y and over are considered
38
as being obese [1, 2], a trend that will continue to rise in parallel with the pace of population aging
39
[3]. Excess body fat is an important risk factor for morbidity and mortality from heart disease,
40
diabetes mellitus, dyslipidemia, and metabolic syndrome [4]. In older adults, obesity imposes
41
further functional limitations on top of declining physical function and adversely affects quality of
42
life [5].
43
Over the years, mounting scientific evidence has shown that consuming nuts in moderate
44
amounts is associated with reduced risk of coronary heart disease [6]. Nuts have a high total fat
45
content (mostly as mono- and polyunsaturated fat), ranging from 46% in cashews and pistachios to
46
76% in macadamia nuts, and provide 20-30 kJ per gram [7]. They are also rich in protein, fiber,
47
vitamins, minerals, phytosterols, and polyphenols [8]. Following the approval of a qualified health
48
claim by the Food and Drug Association (FDA) supporting the inclusion of 1.5 ounces (42 g) walnuts
49
in the daily diet [9], several agencies including the American Heart Association (AHA) and the
50
Academy of Nutrition and Dietetics (AND) recommend the inclusion of nuts in the daily diet to
51
further heart health [10, 11]. Notwithstanding the recommendations, there is a common perception
52
that consuming nuts on a regular basis may lead to unwanted increase in body weight and a higher
53
risk of developing overweight or obesity. However, a meta-analysis of 33 clinical trials assessing the
54
the effects of nut-enriched diets compared with various control diets on changes in body weight,
55
BMI, and waist circumference indicates that nut-enriched diets do not increase adiposity [12]. In fact,
56
including nuts as part of a weight loss regimen can lead to greater weight loss than simply following
57
a low-fat diet [13]. It’s worth noting that many of the trials included in the meta-analysis were
58
conducted over a relatively short period of time (≤ 6 m) and with mostly young and middle-age
59
adults. Thus, whether long-term inclusion of nuts in the daily, self-selected, unrestricted-calorie
60
diets of elderly subjects results in weight gain remains unclear.
61
We had a unique opportunity to clarify this issue within the framework of a 2-year trial testing
62
the effects of walnuts on age-related cognitive decline and macular degeneration in healthy elderly
63
subjects. We were primarily interested in determining if daily consumption of walnuts for an
64
extended period of time induced weight gain in free-living elderly subjects when compared to a
65
similar concurrent group of individuals with low nut consumption.
66
2. Materials and Methods
67
2.1. Study design and population
68
Details of the Walnuts And Healthy Aging (WAHA) study have been published [14]. In brief, it
69
was a randomized dual-center trial, conducted at Loma Linda University (California) and Hospital
70
Clínic (Barcelona, Spain). This opportunistic sub-study concerns data from participants recruited at
71
the Loma Linda site between October 2012 and May 2014. Recruitment for the WAHA study was
72
multi-pronged, and included direct mailings, brochures, flyers, web, and newspaper
73
advertisements. Candidates were pre-screened and excluded from participation if they had morbid
74
obesity, uncontrolled diabetes or hypertension, impaired cognitive function, or bilateral eye
75
conditions preventing visualization of the retina. The present study was conducted according to
76
guidelines laid down in the Declaration of Helsinki. The Institutional Review Board at Loma Linda
77
University approved the study protocol. Written informed consent was obtained from each
78
participant prior to enrollment into the study.
79
2.2. Intervention
80
With a parallel design, candidates who met eligibility criteria were randomly assigned to either
81
a walnut (experimental) or control group using a web-based, computerized random number table
82
with stratification by sex and age. Couples entering the study were treated as one number and were
83
randomized into the same group to facilitate compliance.We then utilized the World Health
84
Organization (WHO) formula for energy needs for adults >60 years [15] to estimate individual
85
energy requirements, following which participants received 28, 42, or 56 g (1, 1.5, or 2.0 oz.) of
86
packaged walnuts per day providing ≈15% of their estimated daily energy needs. No advice on food
87
replacement was given and no recipes were provided. Participants in the control group simply
88
continued their habitual diet with no supplementation and with instructions to refrain from eating
89
walnuts or excessive intake of other nuts (>2 servings/wk). Simply being in a research study can
90
cause individuals to alter their lifestyle or behavior due to the awareness that they are being
91
watched. This observation is particularly common among studies that collect body measurements.
92
Consequently, we asked participants not to alter their usual lifestyle habits, including physical
activity level, while in the study. Participants were largely unaware that adiposity measurements
94
were outcomes of interest in the study.
95
2.3. Assessment of diet
96
We collected 1490 unannounced 24-hour telephone diet recalls from study participants during
97
the 2-year period (752 in walnut group and 738 in control group). The diet recalls were obtained at
98
regular intervals to capture variability and seasonality in food intake. Dietary intake data were
99
collected by trained research dietitians and nutrient data obtained using the Nutrition Data System
100
for Research (NDSR) software version 2013 developed by the Nutrition Coordinating Center (NCC),
101
University of Minnesota, Minneapolis, MN [16]. Portion sizes were estimated using common
102
household items; for example, a fist for one baked potato, a deck of cards for a 3-oz serving of meat,
103
or two handfuls for 1-oz of chips or pretzels, as previously described [17]. The dietary recalls were
104
used to determine if subjects in the walnut group consumed their allotted amounts of walnuts and if
105
their counterparts in the control group refrained from deliberate consumption of walnuts. For the
106
walnut group, consumption of walnuts 6-7 days/wk (85-100%) was considered excellent compliance
107
and 4-5 days/wk (57-71%), as good compliance. Those who consumed walnuts ≤3 days/wk were
108
classified as non-compliant. In the control group, participants were considered fully compliant if
109
they refrained from eating walnuts in any of the recalls, or if they consumed no more than 15 g of
110
walnuts on any given day. We also used the red blood cell (RBC) proportion of alpha-linolenic acid
111
(ALA), a nutrient enriched in walnuts, as an objective biomarker [18] to assess adherence to the
112
intervention.
113
2.4. Anthropometry, body composition, and physical activity
114
We measured participants’ body weight to the nearest 0.1 kg at baseline and bimonthly. Body
115
fat and lean body mass were measured at baseline, 1-y, and end of study. Body measurements were
116
obtained without shoes or heavy clothing using Tanita® TBF 300A Bioelectrical Impedance Analysis
117
scale (Tanita Corporation of America, Arlington Heights, IL). Participants were asked to avoid
118
exercise or heavy hydration prior to visiting the clinic for body measurements. Height was
119
measured to the nearest 0.1 cm using a wall-mounted stadiometer (Holtain Ltd, Crymych, Dyfed,
120
UK). Waist circumference was measured to the nearest 0.1 cm an inch (2.54 cm) above the umbilicus
121
using a tape measure. Hip circumference was measured to the nearest 0.1 cm at the outermost part
122
of the greater trochanters. The waist-to-hip ratio (WtHR) was computed as the ratio of these
123
circumferences. All measurements were obtained following the Centers for Disease Control (CDC)
124
guidelines for the National Health and Nutrition Examination Survey (NHANES III) anthropometric
125
measurements [19]. We also asked participants to fill in a validated short version of the Minnesota
126
physical activity questionnaire for adult populations [19] at baseline, 1-y and end of the study. We
127
then applied CDC and American College of Sports Medicine guidelines [20] to compute metabolic
128
equivalent (MET)-hours per week and to categorize general physical activities according to level of
129
intensity (low/sedentary, moderate, and vigorous).
130
2.5. Biomarker analyses
131
Detailed procedures for blood collection and analyses in the WAHA study are published [14].
132
Fasting blood samples were obtained from all participants at baseline and end of the study. To
133
reduce assay variability, all samples were stored and run together in the same laboratory at the end
134
of the study. The RBC proportion of ALA was assessed as described [21] in a random subset of
135
participants (n=105, 51 in the control group and 54 in the walnut group). In brief, cells contained in a
136
100-μl aliquot of EDTA-collected blood were hemolyzed and spun. The pellet (>99% RBC
137
membranes) was dried, dissolved in 1 ml BF3 methanol solution and heated to hydrolyze and
138
methylate glycerophospholipid fatty acids. The fatty acid methyl esters were isolated by adding
139
n-hexane and were separated by gas chromatography using an Agilent HP 7890 Gas
Chromatograph equipped with a 30 m × 0.25 μm × 0.25 mm SupraWAX-280 capillary column
141
(Teknokroma, Barcelona, Spain), an autosampler, and a flame ionization detector. The amount of
142
ALA was expressed as a percentage of total identified fatty acids in the RBC sample.
143
2.6. Statistical analyses
144
Per protocol analysis was utilized to estimate changes in body measurements. To reduce
145
intra-individual variation, measurements taken in duplicate were averaged and analyses performed
146
on the average. Descriptive statistics are reported as proportions (%) or means ± standard deviations.
147
When appropriate, the ANOVA or chi-square tests were used to assess whether the completers were
148
comparable to non-completers in terms of age, sex, ethnicity, and baseline BMI. Baseline imbalances
149
in demographic, anthropometric and lifestyle variables between treatment groups were assessed by
150
Chi-square test for independence, two-sample t-test, and Fisher's exact test, as appropriate. The
151
independent samples t-test was used to test between group difference in energy and nutrient intake.
152
Changes in body weight and adiposity measures were estimated using linear mixed models with
153
random intercepts and random slopes. Analyses were performed adjusting for in-trial changes in
154
physical activity. The main outcome was change in body weight from baseline to 2 years, with five
155
repeated measurements obtained in between. We also examined changes in body fat, waist
156
circumference, lean body mass, and WtHR at 1-y and end of the study. The predictors for the model
157
were time (as a continuous variable) and intervention (walnut or control group). In the models we
158
included interaction terms for time and intervention (group) by time effects. Three-way interactions
159
between time, intervention and either age (≤ 70 years vs. ≥ 71 years), sex, or ethnicity (white vs.
160
non-white) were also assessed. Changes in ALA as proportion of total identified fatty acids were
161
determined by use of ANOVA, and the relationship between changes in self-reported walnut intake
162
and changes in RBC ALA was assessed using Pearson correlation. Assuming a standard deviation of
163
4 kg, the sample size of 356 participants provided >95% power (with P = 0.05) to detect a mean
164
difference of 1 kg between groups. All analyses were performed using Statistical Analysis System
165
(SAS Version 9.4).
166
3. Results
167
3.1. Participants
168
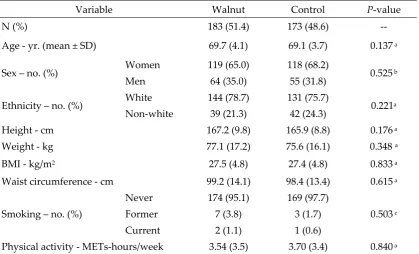
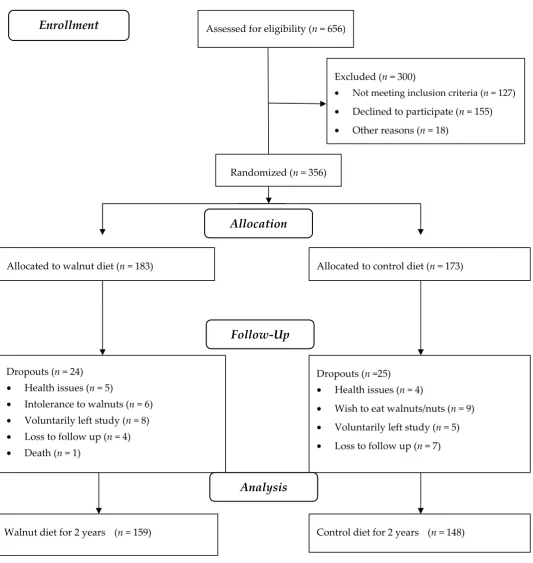
Baseline characteristics of 356 subjects who began the study are detailed in table 1. Overall, the
169
walnut supplement was well accepted and well tolerated by study participants. Forty-nine
170
participants (24 in the walnut group and 25 in the control group) dropped out due to health-related
171
concerns, intolerance to walnuts, loss to follow-up or undisclosed personal reasons. One death due
172
to esophageal cancer early in the study (unrelated to treatment) occurred in the walnut group. The
173
dropouts did not differ significantly from completers regarding age, sex, ethnicity, or baseline BMI
174
(data not shown). Nine incident cases of constipation and eight of diarrhea were reported in the
175
walnut group during the 2-year study period. Figure 1 is the study flowchart. Data presented are for
176
participants who completed the study (159 from the walnut group and 148 from the control group).
Table 1. Baseline characteristics of participants by intervention group.
Variable Walnut Control P-value
N (%) 183 (51.4) 173 (48.6) --
Age - yr. (mean ± SD) 69.7 (4.1) 69.1 (3.7) 0.137 a
Sex – no. (%) Women 119 (65.0) 118 (68.2) 0.525 b
Men 64 (35.0) 55 (31.8)
Ethnicity – no. (%) White 144 (78.7) 131 (75.7) 0.221a
Non-white 39 (21.3) 42 (24.3)
Height - cm 167.2 (9.8) 165.9 (8.8) 0.176 a
Weight - kg 77.1 (17.2) 75.6 (16.1) 0.348 a
BMI - kg/m2 27.5 (4.8) 27.4 (4.8) 0.833 a
Waist circumference - cm 99.2 (14.1) 98.4 (13.4) 0.615 a
Smoking – no. (%)
Never 174 (95.1) 169 (97.7)
0.503 c
Former 7 (3.8) 3 (1.7)
Current 2 (1.1) 1 (0.6)
Physical activity - METs-hours/week 3.54 (3.5) 3.70 (3.4) 0.840 a
Data are expressed as mean (SD), except for qualitative variables, expressed as n (%).
a Two-sample t-test
b Chi-square test for independence
Figure 1. Study flowchart
Assessed for eligibility (n = 656)
Excluded (n = 300)
• Not meeting inclusion criteria (n = 127)
• Declined to participate (n = 155)
• Other reasons (n = 18)
Walnut diet for 2 years (n = 159) Dropouts (n = 24)
• Health issues (n = 5)
• Intolerance to walnuts (n = 6)
• Voluntarily left study (n = 8)
• Loss to follow up (n = 4)
• Death (n = 1)
Allocated to walnut diet (n = 183)
Dropouts (n =25)
• Health issues (n = 4)
• Wish to eat walnuts/nuts (n = 9)
• Voluntarily left study (n = 5)
• Loss to follow up (n = 7) Allocated to control diet (n = 173)
Control diet for 2 years (n = 148)
Allocation
Analysis
Follow-Up
3.2. Compliance with treatment
178
Only 1% of dietary recalls from the control group showed intake of trivial amounts of walnuts
179
(<15 g), mostly as an ingredient in recipes and commercially prepared foods such as walnut bread,
180
cookies, or salads. We therefore considered the subjects in the control group to have been 100%
181
compliant with instructions not to consume walnuts. Similarly, 99% of dietary recalls in the walnut
182
group reported consumption of the prescribed amount of walnuts (between 28 and 56 g/d, average
183
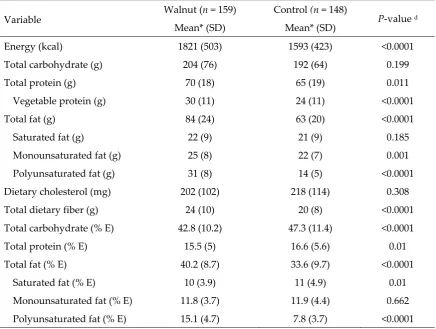
43 g/d). Table 2 shows data of macronutrients based on self-reported intake at two years. On
184
average, energy, total polyunsaturated fatty acids, protein and fiber intake was significantly higher
185
in the walnut group compared to control. The walnut supplement contributed approximately 15% of
186
estimated daily energy needs.
187
Table 2. Average daily intake of macronutrients at 2 years by intervention group in participants completing the trial.
Variable Walnut (n = 159) Control (n = 148) P-value d
Mean* (SD) Mean* (SD)
Energy (kcal) 1821 (503) 1593 (423) <0.0001
Total carbohydrate (g) 204 (76) 192 (64) 0.199
Total protein (g) 70 (18) 65 (19) 0.011
Vegetable protein (g) 30 (11) 24 (11) <0.0001
Total fat (g) 84 (24) 63 (20) <0.0001
Saturated fat (g) 22 (9) 21 (9) 0.185
Monounsaturated fat (g) 25 (8) 22 (7) 0.001
Polyunsaturated fat (g) 31 (8) 14 (5) <0.0001
Dietary cholesterol (mg) 202 (102) 218 (114) 0.308
Total dietary fiber (g) 24 (10) 20 (8) <0.0001
Total carbohydrate (% E) 42.8 (10.2) 47.3 (11.4) <0.0001
Total protein (% E) 15.5 (5) 16.6 (5.6) 0.01
Total fat (% E) 40.2 (8.7) 33.6 (9.7) <0.0001
Saturated fat (% E) 10 (3.9) 11 (4.9) 0.01
Monounsaturated fat (% E) 11.8 (3.7) 11.9 (4.4) 0.662
Polyunsaturated fat (% E) 15.1 (4.7) 7.8 (3.7) <0.0001
* Mean values for five 24-h diet recalls per individual
d Two sample t-test for group differences
% E denotes macronutrient intake as percent of total energy
Analysis of baseline RBC fatty acids in a random sub-set of 105 study participants showed
188
similar baseline levels of ALA (mean, 0.30% for the walnut group and 0.28% for the control group; P
189
= 0.830). By the end of the study, the mean RBC ALA had increased by 33% in the walnut group and
190
by 14% in the control group (P < 0.001). The correlation between 2-y changes in self-reported walnut
191
intake and changes in RBC ALA was significant (r = 0.49, P < 0.001).
192
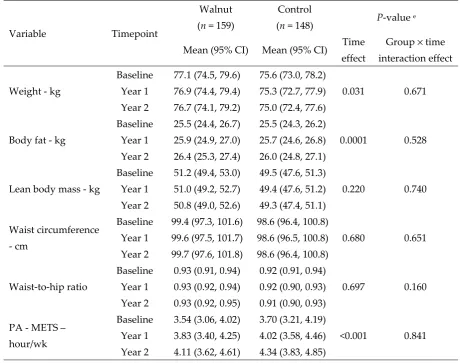
3.3. Changes in physical activity and anthropometric measurements
193
Table 3 shows the results of anthropometric measurements. Overall, body weight decreased
194
significantly over time in all study participants (P = 0.031). Figure 2 is a plot of the average body
195
weight of participants obtained periodically during clinic visits. Participants in the walnut group
lost an average of 0.4 kg compared to 0.6 kg in the control group, with no between group differences
197
(P = 0.671).
198
Table 3. Adiposity and physical activity during the 2-year follow-up by intervention group.
199
Variable Timepoint Walnut
(n = 159)
Control
(n = 148) P-value
e
Mean (95% CI) Mean (95% CI) Time effect
Group × time
interaction effect
Weight - kg
Baseline 77.1 (74.5, 79.6) 75.6 (73.0, 78.2)
0.031 0.671 Year 1 76.9 (74.4, 79.4) 75.3 (72.7, 77.9)
Year 2 76.7 (74.1, 79.2) 75.0 (72.4, 77.6)
Body fat - kg
Baseline 25.5 (24.4, 26.7) 25.5 (24.3, 26.2)
0.0001 0.528 Year 1 25.9 (24.9, 27.0) 25.7 (24.6, 26.8)
Year 2 26.4 (25.3, 27.4) 26.0 (24.8, 27.1)
Lean body mass - kg
Baseline 51.2 (49.4, 53.0) 49.5 (47.6, 51.3)
0.220 0.740 Year 1 51.0 (49.2, 52.7) 49.4 (47.6, 51.2)
Year 2 50.8 (49.0, 52.6) 49.3 (47.4, 51.1)
Waist circumference
- cm
Baseline 99.4 (97.3, 101.6) 98.6 (96.4, 100.8)
0.680 0.651 Year 1 99.6 (97.5, 101.7) 98.6 (96.5, 100.8)
Year 2 99.7 (97.6, 101.8) 98.6 (96.4, 100.8)
Waist-to-hip ratio
Baseline 0.93 (0.91, 0.94) 0.92 (0.91, 0.94)
0.697 0.160 Year 1 0.93 (0.92, 0.94) 0.92 (0.90, 0.93)
Year 2 0.93 (0.92, 0.95) 0.91 (0.90, 0.93)
PA - METS – hour/wk
Baseline 3.54 (3.06, 4.02) 3.70 (3.21, 4.19)
<0.001 0.841 Year 1 3.83 (3.40, 4.25) 4.02 (3.58, 4.46)
Year 2 4.11 (3.62, 4.61) 4.34 (3.83, 4.85)
PA denotes physical activity.
200
e Linear mixed models with three timepoints (baseline, year 1, and year 2). Model includes time,
201
intervention, and their interaction. Results are adjusted for in-trial changes in PA.
202
203
Figure 2. Plot of changes in mean body weight of participants over time by treatment allocation.
Figure 3A is a plot of the average waist circumference of participants at baseline, 1-y, and end of the
205
study. The increase in waist circumference over time was not significant (P = 0.680) and there were
206
no between group difference (P = 0.651). Figure 3B is a plot of the average body fat at baseline, 1-y,
207
and end of the study. Mean body fat increased significantly in both groups (P < 0.001). Participants
208
in the walnut group gained ≈ 0.9 kg (1.8 %) body fat compared to 0.5 kg (0.9%) in the control group
209
(P = 0.528 for between group differences).
210
Lean body mass decreased by 0.4 kg (0.8%) in the walnut group and by 0.2 kg (0.4%) in the
211
control group. The change in lean body mass over time was not significant (P = 0.220) and did not
212
differ between the two groups (P = 0.740) (Figure 3 C). The change in WtHR over time (Figure 3 D)
213
was negligible, -0.009 in the control and +0.005 in the walnut group. Self-reported physical activity
214
increased significantly over time in the two groups (P = 0.0007) without significant between group
215
differences (P = 0.841).
216
217
Figure 3. Plot of changes in mean waist circumference (A), body fat (B), lean body mass (C), and
218
waist-to-hip ratio (D) over time by intervention group.
219
We considered potential differences in adiposity changes based on age at baseline, sex and ethnicity.
220
However, the inclusion of these variables into the models did not significantly affect adiposity
221
measures.
222
4. Discussion
223
This opportunistic study within a randomized controlled trial sought to investigate adiposity
224
changes after walnut supplementation for 2 years in an independently living, predominantly
225
healthy, elderly cohort. The increase in RBC ALA content in the walnut group is a reliable indicator
226
that participants adhered to the intervention. We previously reported a decrease in RBC ALA in the
227
control group at one year [25], which we speculated was the result of restricting the use of ALA-rich
228
flax. It is possible that some control group participants may have reverted to consuming these
products in the second year of the study, perhaps due to perceived benefits, hence the increase in
230
RBC ALA.
231
Overall, our data indicate that ingesting an average of nearly 300 kcal from walnuts daily for 2
232
years (without advice on foods to be replaced when adding walnuts to the diet) does not promote
233
weight gain or cause significant changes in body composition. Sensitivity analyses showed that
234
weight and adiposity trends were proportionally similar for men and women.
235
A tendency towards loss of lean body mass and fat gain over time has previously been reported
236
in studies that have longitudinally assessed spontaneous adiposity changes in healthy, weight-stable
237
elders [22, 23]. One such study on free-living elderly persons of comparable mean age followed for
238
the same period of time as our study participants reported a 0.32 kg and 0.16 kg loss in lean body
239
mass and a concurrent 0.4% and 0.5% increase in body fat in men and women, respectively [24]. The
240
self-reported increase in physical activity might have been due to participants’ awareness that they
241
were being monitored and the general tendency to over-report physical activity. Superior methods
242
of assessing physical activity such as the use of accelerometers can help validate physical activity in
243
future long-term nut trials in free-living individuals.
244
Notwithstanding the high energy density of walnuts, the lack of body weight increase might be
245
explained by several mechanisms. We have previously reported that the energy contained in
246
walnuts was offset in part by ≈19% spontaneous reduction in caloric intake from other food sources
247
[25], although the compensatory response of our study subjects was lower than previously reported
248
[26, 27]. Other possible mechanisms include increased satiety following nut intake [28], energy
249
regulation by nuts [29, 30], and inefficient energy absorption from nuts [31] leading to increased
250
fecal fat excretion [30, 32-34]. Concerning increased fecal fat, it has been demonstrated that as much
251
as 10-20% of the total energy from nuts is lost due to limited bioavailability in the gut [35]. In
252
confirmation, recent findings show that the metabolizable energy content of walnuts is
253
approximately 5.22 kcal/g (146 kcal/serving) as compared to the Atwater-calculated amount of 6.61
254
kcal/g (185 kcal/serving). Thus, Atwater factors overestimate by 21% the metabolizable energy
255
content of walnuts [36]. Food compensation, increased satiety and reduced available energy are the
256
most likely factors accounting for a stable weight during chronic nut consumption.
257
Our study has limitations. The original study was designed to assess changes in cognitive
258
function and retinal health [14] and our results derive from a post hoc analysis. Also, three different
259
clinical investigators obtained body measurements, suggesting that the data collected may be subject
260
to interobserver variability despite the use of standardized protocols. Our study also has strengths.
261
To the best of our knowledge, this study is the longest and largest randomized controlled trial to
262
examine body weight change in relation to nut consumption in free-living healthy elders. Our
263
parallel design is best suited for assessing weight changes since it disallows the potential for
264
carry-over effects commonly seen in crossover feeding studies. Also, compliance with walnut
265
consumption was corroborated with objective biomarkers. Future studies should consider
266
examining whether walnuts contribute to energy regulation by increasing resting energy
267
expenditure. Objective assessment of physical activity, i.e., using accelerometers, should assist in
268
determining precisely the extent to which physical activity influences changes in body weight and
269
adiposity measures in the context of chronic nut consumption.
270
5. Conclusions
271
In conclusion, our findings indicate that walnuts can be incorporated into the daily diet of
272
healthy elders without concern for adverse effects on body weight or body composition. Even so, we
273
recognize that individual differences in energy utilization and nutrient absorption and metabolism
274
do exist, a reason why results may vary from person to person.
275
276
277
Author Contributions: Conceptualization, J.S. and E.B; methodology, E.R., J.S., S.R, E.B; formal analysis, K.O.;
278
investigation, E.B., J.S., S.R.; writing—original draft preparation, E.B; writing—review and editing, J.S., E.R.,
279
K.J., A.S., M.S., K.O., S.R; supervision, J.S; funding acquisition, J.S and E.R.
Funding: This work was supported by a grant from the California Walnut Commission, Folsom, California,
281
United States. The funding agency had no input in the study design, data collection, analyses or writing and
282
submission of the manuscript. An external overseeing committee monitors the study to ensure quality control
283
data, integrity, and participants’ safety. AS-V is recipient of the Instituto de Salud Carlos III Miguel Servet
284
fellowship (CP12/03299) and Fondo de Investigación Sanitaria grant - FEDER funds (PI15/01014).
285
Acknowledgments: We thank Natalie Kazzi and Lynnley Huey for their assistance in data collection, Ahmed
286
Al Abdrabalnabi for his help with data cleaning, and Rawiwan Sirirat for her assistance with quality control on
287
24-hour telephone diet recalls. CIBEROBN is an initiative of ISCIII, Spain.
288
Conflicts of Interest: AS-V, ER and JS have received grants for research through their respective institutions
289
from the California Walnut Commission; ER and JS have also received personal money for preparing scientific
290
presentations and are nonpaid members of its Scientific Advisory Committee. The funders had no role in the
291
design of the study; in the collection, analyses, or interpretation of data; in the writing of the manuscript, or in
292
the decision to publish the results.
293
References
294
1. Ogden, C.L.; Carroll, M.D.; Fryar, C.D.; Flegal, K.M. Prevalence of obesity among adults and
295
youth: United States, 2011-2014: US Department of Health and Human Services, Centers for Disease
296
Control and Prevention, National Center for Health Statistics; 2015.
297
2. Hales, C.M.; Carroll, M.D.; Fryar, C.D.; Ogden, C.L. Prevalence of obesity among adults and
298
youth: United States, 2015-2016: US Department of Health and Human Services, Centers for Disease
299
Control and Prevention, National Center for Health Statistics; 2017.
300
3. King, D.E.; Matheson, E.; Chirina, S.; Shankar, A.; Broman-Fulks J. The status of baby boomers'
301
health in the United States: the healthiest generation? JAMA Internal Medicine. 2013;173(5):385-6.
302
4. Aune, D.; Keum, N.; Giovannucci, E.; Fadnes, L.T.; Boffetta, P.; Greenwood, D.C., et al. Nut
303
consumption and risk of cardiovascular disease, total cancer, all-cause and cause-specific mortality:
304
a systematic review and dose-response meta-analysis of prospective studies. BMC Medicine.
305
2016;14(1):207.
306
5. Villareal, D.T.; Chode, S.; Parimi, N.; Sinacore, D.R.; Hilton, T.; Armamento-Villareal, R., et al.
307
Weight loss, exercise, or both and physical function in obese older adults. New England Journal of
308
Medicine. 2011;364(13):1218-29.
309
6. Ros, E. Nuts and CVD. British Journal of Nutrition. 2015;113(S2):S111-S20.
310
7. Ros, E.; Mataix, J. Fatty acid composition of nuts–implications for cardiovascular health. British
311
Journal of Nutrition. 2006;96(S2):S29-S35.
312
8. Ros, E. Health benefits of nut consumption. Nutrients. 2010;2(7):652-82.
313
9. Taylor, S.E. Qualified Health Claims: Letter of Enforcement Discretion-Walnuts and Coronary
314
Heart Disease (Docket No 02P-0292). US Food and Drug Administration. 2004.
315
10. Krauss, R.M.; Eckel, R.H.; Howard, B.; Appel, L.J.; Daniels, S.R.; Deckelbaum, R.J., et al. AHA
316
dietary guidelines revision 2000: a statement for healthcare professionals from the Nutrition
317
Committee of the American Heart Association. Circulation. 2000;102(18):2284-99.
318
11. Vannice, G.; Rasmussen, H. Position of the academy of nutrition and dietetics: dietary fatty
319
acids for healthy adults. Journal of the Academy of Nutrition and Dietetics. 2014;114(1):136-53.
12. Flores-Mateo, G.; Rojas-Rueda, D.; Basora, J.; Ros, E.; Salas-Salvadó J. Nut intake and adiposity:
321
meta-analysis of clinical trials. The American Journal of Clinical Nutrition. 2013;97(6):1346-55.
322
13. Mattes, R.D.; Kris-Etherton, P.M.; Foster, G.D. Impact of peanuts and tree nuts on body weight
323
and healthy weight loss in adults. The Journal of Nutrition. 2008;138(9):1741S-5S.
324
14. Rajaram, S.; Valls-Pedret, C.; Cofán, M.; Sabaté, J.; Serra-Mir, M.; Pérez-Heras, A.M., et al. The
325
Walnuts and Healthy Aging Study (WAHA): Protocol for a Nutritional Intervention Trial with
326
Walnuts on Brain Aging. Frontiers in Aging Neuroscience. 2017;8(333).
327
15. Volp, A.C.P.; Oliveira, F.C.Ed.; Alves R.D.M.; Esteves, E.; Bressan, J. Energy expenditure:
328
components and evaluation methods. 2011.
329
16. Nutrition Coordinating Center. Nutrition Data System for Research. Minneapolis (MN):
330
University of Minnesota. 2011.
331
17. Fraser, G.E.; Bennett, H.W.; Jaceldo, K.B.; Sabaté, J. Effect on body weight of a free 76 kilojoule
332
(320 calorie) daily supplement of almonds for six months. Journal of the American College of Nutrition.
333
2002;21(3):275-83.
334
18. Sabate, J.; Fraser, G.E.; Burke, K.; Knutsen, S.F.; Bennett, H.; Lindsted, K.D. Effects of walnuts on
335
serum lipid levels and blood pressure in normal men. New England Journal of Medicine.
336
1993;328(9):603-7.
337
19. National Center for Health Statistics. Anthropometry Procedures Manual—National Health
338
and Nutrition Examination Survey (NHANES). Hyattsville, MD: NCHS. 2013.
339
20. Haskell, W.L.; Lee, I.M.; Pate, R.R.; Powell, K.E.; Blair, S.N.; Franklin, B.A., et al. Physical
340
activity and public health: updated recommendation for adults from the American College of Sports
341
Medicine and the American Heart Association. Circulation. 2007;116(9):1081.
342
21. Sala-Vila, A.; Harris, W.S.; Cofán, M.; Pérez-Heras, A.M.; Pintó, X.; Lamuela-Raventós, R.M., et
343
al. Determinants of the omega-3 index in a Mediterranean population at increased risk for CHD.
344
British Journal of Nutrition. 2011;106:425-31.
345
22. Gallagher, D.; Ruts, E.; Visser, M.; Heshka, S.; Baumgartner, R.N.; Wang J., et al. Weight
346
stability masks sarcopenia in elderly men and women. American Journal of Physiology-Endocrinology
347
And Metabolism. 2000;279(2):E366-E75.
348
23. Forbes, G.B. Longitudinal changes in adult fat-free mass: influence of body weight. The
349
American Journal of Clinical Nutrition. 1999;70(6):1025-31.
350
24. Zamboni, M.; Zoico, E.; Scartezzini, T.; Mazzali, G.; Tosoni, P.; Zivelonghi, A., et al. Body
351
composition changes in stable-weight elderly subjects: the effect of sex. Aging Clinical and
352
Experimental Research. 2003;15(4):321-7.
353
25. Bitok, E.; Jaceldo-Siegl, K.; Rajaram, S.; Serra-Mir, M.; Roth, I.; Feitas-Simoes, T., et al.
354
Favourable nutrient intake and displacement with long-term walnut supplementation among
355
elderly: results of a randomised trial. The British Journal of Nutrition. 2017;118(3):201.
356
26. Sabaté, J.; Cordero-MacIntyre, Z.; Siapco, G.; Torabian, S.; Haddad, E. Does regular walnut
357
consumption lead to weight gain? British Journal of Nutrition. 2005;94(05):859-64.
27. Kirkmeyer, S.; Mattes, R.D. Effects of food attributes on hunger and food intake. International
359
journal of obesity and related metabolic disorders: Journal of the International Association for the Study
360
of Obesity. 2000;24(9):1167-75.
361
28. Mattes, R.D.; Dreher, M.L. Nuts and healthy body weight maintenance mechanisms. Asia Pacific
362
Journal of Clinical Nutrition. 2010;19(1):137-41.
363
29. Alper, C.; Mattes, R.D. Effects of chronic peanut consumption on energy balance and hedonics.
364
International journal of obesity and related metabolic disorders: Journal of the International Association
365
for the Study of Obesity. 2002;26(8):1129-37.
366
30. Hollis, J.; Mattes, R.D. Effect of chronic consumption of almonds on body weight in healthy
367
humans. British Journal of Nutrition. 2007;98(3):651-6.
368
31. Levine, A.S.; Silvis, S.E. Absorption of whole peanuts, peanut oil, and peanut butter. New
369
England Journal of Medicine. 1980;303(16):917-8.
370
32. Haddad, E.; Sabate, J., editors. Effect of pecan consumption on stool fat. FASEB JOURNAL; 2000:
371
FEDERATION AMER SOC EXP BIOL 9650 ROCKVILLE PIKE, BETHESDA, MD 20814-3998 USA.
372
33. Kris-Etherton, P.M.; Hu, F.B.; Ros, E.; Sabaté, J. The role of tree nuts and peanuts in the
373
prevention of coronary heart disease: multiple potential mechanisms. The Journal of Nutrition.
374
2008;138(9):1746S-51S.
375
34. Zemaitis, J.; Sabaté, J., editors. Effect of almond consumption on stool weight and stool fat.
376
FASEB JOURNAL; 2001: FEDERATION AMER SOC EXP BIOL 9650 ROCKVILLE PIKE,
377
BETHESDA, MD 20814-3998 USA.
378
35. Ellis, P.R.; Kendall, C.W.; Ren, Y.; Parker, C.; Pacy, J.F.; Waldron, K.W., et al. Role of cell walls in
379
the bioaccessibility of lipids in almond seeds. The American Journal of Clinical Nutrition.
380
2004;80(3):604-13.
381
36. Baer, D.; Gebauer, S.; Novotny, J. Atwater factors overestimate the calorie content of walnuts
382
(371.1). The FASEB Journal. 2014;28(1 Supplement):371.1.