PET/CT Image Navigation and Communication
Osman Ratib, MD, PhD
Department of Radiology and Department of Molecular and Medical Pharmacology, Ahmanson Biological Imaging Center, David Geffen School of Medicine, University of California at Los Angeles, Los Angeles, California
The advent of multimodality imaging scanners combining PET and CT has led to a new paradigm in image display and pre-sentation that raises new challenges in workstation interpreta-tion software, image navigainterpreta-tion, and communicainterpreta-tion. The es-sence of multimodality imaging is the ability to overlay imaging information from different modalities in a visually compelling fashion. This is accomplished by combining functional and an-atomic data into multidimensional views using color-encoding techniques that provide visual clues on the spatial distribution of image data.Discussion:Combined PET/CT scanners provide spatially registered images from the two modalities acquired simultaneously in a single imaging session. Special reconstruc-tion software and image display programs are required to rescale the native images from different spatial resolution into orthogonal or oblique reformatted planes in which data from PET images are color coded and superimposed on correspond-ing anatomic CT images. The color overlay technique allows the user to visually identify areas of high tracer activity and deter-mine the underlying anatomic structure. Because of the multi-dimensional nature of the data, visualization requires interactive multidimensional navigation techniques that allow the viewer to move the visualization planes through three spatial directions and two additional dimensions. The fourth dimension is the continuum blend from PET to CT fusion, and the fifth is the dynamic range of the CT images that can be adjusted to display different tissue characteristics, such as bones, soft tissue, and lungs. Software tools currently available are often relatively complex, requiring the user to perform cumbersome maneuvers and time-consuming image manipulation to navigate through all dimensions and obtain adequate image settings and plane po-sitioning for diagnostic interpretation of the image data. More-over, the ability to convey these images to referring physicians is usually limited because of the lack of adequate viewing soft-ware. Distribution of results is usually performed instead through static “snapshots” of the fused images generated by the interpreting radiologist. The ability of the referring physician to navigate through the set of multimodality image data is thus limited. Conclusion: The wider adoption of multimodality PET/CT imaging techniques in routine clinical use will depend heavily on the development of more adequate image display and navigation tools that allow interpreting physicians to navi-gate easily and efficiently through multiple dimensions of data. Distribution of results to referring physicians and care providers also requires new tools for interactively reviewing the multimo-dality data, and current static images obtained from fused
im-age data remain inadequate for proper visualization of the true content of images.
Key Words: PET/CT; multimodality imaging; image fusion; functional images
J Nucl Med 2004; 45:46S–55S
V
isualization and interactive review of volumetric data from tomographic imaging techniques represents a chal-lenge for software developers to provide adequate tools for conveniently navigating through large datasets representing 3-dimensional anatomic volumes. Diagnostic interpretation of CT traditionally was performed from 2-dimensional sec-tional images printed side by side on large sheets of film. With the evolution toward soft-copy reading of these im-ages on diagnostic workstations, it rapidly became evident that tiling sectional images side by side was not the most convenient or practical solution for image display. This approach was replaced by interactive tools allowing users to browse through stacks of cross-sectional images (1). With improvements in spatial resolution of CT scanners and rapid improvement in the processing power of diagnostic work-stations, it is now possible to navigate interactively through orthogonal planes in coronal and sagittal orientations as well as in oblique planes. For CT and MRI images, radiol-ogists have rapidly adopted these tools for diagnostic inter-pretation of tomographic studies in routine clinical practice. Increasing economic restrictions on health care have re-sulted in demands for higher productivity by radiologists. Software tools are being developed to facilitate faster nav-igation through very large image datasets with limited user interaction.The development of multimodality PET/CT scanners pro-viding combined 3-dimensional data from PET and CT images adds another degree of complexity to image inter-pretation with multidimensional visualization tools. The interpreting physician is confronted with data in 5 different dimensions. The 3-dimensional tomographic data are now extended to a fourth dimension, represented by the contin-uum between anatomy and function through fusion of PET and CT images. Thus, the user can navigate along this dimension by interactively adjusting the degree of blending or color-overlay transparency of the functional PET with the anatomic CT data. A fifth dimension consists of the large dynamic range of CT data, allowing the user to visualize Received Nov. 12, 2003; revision accepted Nov. 21, 2003.
For correspondence or reprints contact: Osman Ratib, MD, PhD, UCLA Radiology, CHS B2–165, 10833 Le Conte Ave., Los Angeles, CA 90095-1721.
different tissue structures, such as bones, soft tissue, and lungs, by adjusting the image contrast and intensity win-dow. A temporal dimension can be added if the data are acquired dynamically (e.g., in cardiac cine sequences). In visualizing and interpreting these datasets, the user faces the difficult task of navigating 5 or 6 dimensions and needs to explore every dimension to identify regional abnormalities in morphology or tracer distribution.
One challenge in managing the overwhelming amount of information obtained from combined PET/CT studies is in adequately processing and managing the multidimensional data. This requires software tools that allow interpreting physicians to easily and efficiently navigate through multi-dimensional datasets. As imaging technology has devel-oped, the time required for image and data acquisition has decreased significantly. The time required for reviewing and interpreting these very large and complex multidimensional datasets, however, has increased drastically.
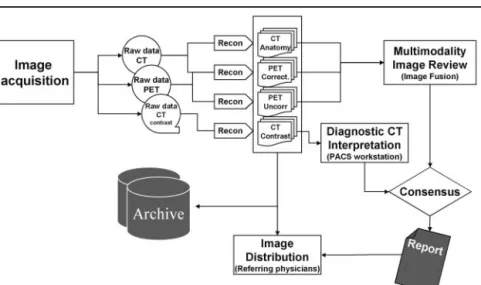
This article reviews the complexity of the process of data acquisition, reconstruction, and interpretation identifies ar-eas of potential difficulty that may result in significant inefficiencies in processing and interpretation workflow (Fig. 1). Areas of new technologic developments and changes in image communication and distribution that pro-vide complex multidimensional imaging data to the medical community are also reviewed.
DUAL-MODALITY IMAGING TECHNIQUES
Clinical utilization of PET/CT imaging requires particu-lar attention to the methods and procedures of optimization of image acquisition and reconstruction techniques. How-ever, the workflow of image distribution, interpretation, and communication also must be optimized. The most common clinical indications for combined PET/CT imaging are cur-rently in oncology, and we will limit our attention to the methods and techniques used for oncologic studies. With the rapid development of ultrafast, multidetector CT
scan-ners combined with faster PET scanscan-ners, other applications will soon emerge in clinical routines such as cardiac and other dynamic functional imaging.
As described elsewhere in this special supplement, a major breakthrough in PET/CT imaging is the advent of lutetium oxyorthosilicate (LSO) detector technology for PET that provides much shorter acquisition times (2). In addition, the use of CT images for attenuation correction of PET data eliminates the need for traditional transmission scans. As a result, PET/CT imaging protocols are quite different from conventional PET protocols, allowing for shorter and more efficient imaging. Two distinct categories of imaging protocols are used for CT images, depending on the specific clinical question. CT images must be of either diagnostic quality or used solely for the purpose of anatomic localization and attenuation correction (3). To achieve a high diagnostic quality meeting the standard of care for oncology CT examinations, higher image resolution, thinner slices, breath hold, and contrast enhancement protocols will be required (4,5. There is some controversy regarding the need for iodinated contrast material for CT images, because the most frequently used radionuclide probe, 18F-FDG,
yields a much higher specificity and sensitivity for charac-terizing tissue masses (5– 6. The general consensus is that iodinated contrast studies and breath-hold acquisition pro-tocols for thoracic and upper abdominal CT studies are necessary to maximize the diagnostic accuracy of CT. At our institution, we have elected to add a “diagnostic” CT acquisition when clinically indicated after every standard PET/CT study. Unlike the generic CT acquisition that is standard for all oncology PET/CT examinations, the diag-nostic CT protocol varies depending on the clinical indica-tion and the anatomic region being investigated. The other important components of image management and PET/CT examination procedures are the different reconstruction pro-tocols of the images, the strategy of image archiving and storage, and the tools used for image visualization and
FIGURE 1. Workflow diagram showing data flow from image acquisition, recon-struction in different modalities, interpreta-tion by different interpreting physicians, and generation of consensus report(s) that can be distributed to referring physicians together the images.
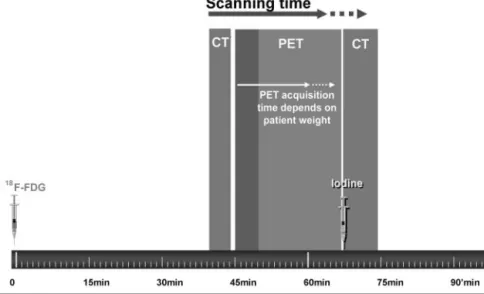
navigation. The general timeline of CT and PET acquisition is shown in Figure 2.
Imaging Protocols
The standard PET/CT protocol includes a low-dose spiral CT acquisition from the base of the skull to mid thigh, followed by a whole-body PET study of the same region. The protocols presented here were developed for a com-mercially available PET/CT scanner consisting of a dual-detector spiral CT scanner (Emotion Duo, Siemens Medical Solutions) and an LSO full-ring PET scanner (ECAT Accel, Siemens Medical Solutions) combined into a single gantry. The newer LSO detectors provide higher count-rate capa-bility than the conventional bismuth germanium orthosili-cate detectors used in most existing scanners and allow acquisitions as brief as 1 min per bed position without compromising lesion detectability (7). Each PET acquisi-tion covers 16.2 cm per bed posiacquisi-tion with an overlap of about 3.7 cm, with 6 –7 bed positions needed to cover the whole body area from the base of the skull to mid thigh in a patient of average size (Fig. 3). PET images are acquired approximately 45– 60 min after injection of 0.21 mCi/kg
18F-FDG. The acquisition time per bed position can be
adapted to the patient’s weight, varying from 1 min per bed position for patients who weigh⬍60 kg to 4 min per bed position for patients who weigh⬎100 kg (7). It is preferable to acquire images with patients in the “arms up” position to minimize artifacts and beam-hardening effects (4). Given the short acquisition time of both PET and CT data, most patients are capable of maintaining the “arms up” position throughout the study. During acquisition of the CT images, patients are instructed to maintain steady, shallow breathing to achieve good coregistration of CT images and nonbreath-hold PET images. Respiratory motion can result in “mush-room” artifacts above the diaphragm that are frequently observed on CT images. This results in similar artifacts on attenuation-corrected PET images (8 –10). However, these
artifacts can be reduced by instructing patients to hold their breath at midexpiration during acquisition of CT images.
When clinically indicated, a diagnostic contrast CT scan can be acquired immediately after the first combined PET/CT acquisition. Depending on the body area to be explored and the underlying disease being investigated, different protocols can be applied. Various institutions will have different protocols for a variety of clinical conditions. The most common CT oncology protocol used in whole-FIGURE 2. Timeline of PET/CT
proce-dure indicating different image acquisition steps after injection of18F-FDG tracer
ap-proximately 45 min before study. CT scan without contrast is acquired, and then PET image acquisition can vary in duration, de-pending on patient weight. This is followed by second contrast-enhanced CT study when clinically required.
FIGURE 3. Diagram of coverage and position of image acqui-sition for whole-body PET/CT study. CT images are acquired in contiguous slices, whereas PET images are acquired in inde-pendent “thick slabs” in successive bed positions across scan-ner.
body screening or cancer staging is a combined thorax/ abdomen/pelvis imaging sequence acquired after contrast injection (the detailed acquisition protocol used at the Uni-versity of California at Los Angeles [UCLA] is shown in Fig. 4). The sequence starts with high-resolution acquisition of chest images performed during full inspiration and breath hold 20 s after contrast injection, followed by a first acqui-sition of the abdominal area during the arterial phase and a second acquisition over the same region in the venous phase. The last set of images is acquired over the pelvis approximately 3– 4 min after injection. With careful adjust-ment of image acquisition parameters and the speed of acquisition of the different sequences, it is possible to ac-quire the 3 body areas after a single injection of contrast material (Fig. 4).
Another frequently requested protocol is a complemen-tary head-and-neck examination (4). For optimal evaluation of the neck area, the images must be acquired with the patient’s arms down. Therefore, a second, dedicated set of PET images must be acquired. (Details of the head and neck imaging protocol are described in Fig. 5). CT images are acquired 30 – 40 s after intravenous injection of 75 mL of contrast medium. When necessary, additional CT images of the brain can be obtained in a delayed phase after adequate time (usually around 5 min) to allow contrast material to cross the blood– brain barrier and reach the brain structures. A third set of matching PET images of the brain is then acquired.
Image Reconstruction and Data Management
An important component of PET/CT imaging protocols is image reconstruction of the raw data acquired by the scan-ners. PET images can be reconstructed using different filters that result in different image resolutions. Higher-cutoff fre-quency filters will result in images that seem sharper but show much higher degrees of background noise. Lower frequency filters will result in smoother-looking images offering slightly less visual perception of anatomic details. In our protocols, we adopted different PET reconstruction parameters for images of the body and for images of the brain. Whole-body scans are reconstructed in a 128⫻ 128 image matrix using iterative reconstruction methods (or-dered subsets estimation–maximization; 2 iterations, 8 sub-sets) with a 6-mm gaussian postreconstruction filter. Brain images are usually reconstructed in a higher resolution of a 256⫻256 matrix using a filtered backprojection technique and a 2-mm gaussian postreconstruction filter. Similarly, CT images also can be reconstructed with different param-eters, resulting in images of different resolutions. The re-constructed slice thickness of the CT images is the most important parameter. Although thinner slices are particu-larly desirable for better quality multiplanar reconstruction of coronal, sagittal, and oblique lanes that are orthogonal to the acquired axial planes, the reconstruction can result in an overwhelming number of images, especially when high-resolution, thin-slice images are acquired with the newer
FIGURE 4. Diagram of acquisition protocol for diagnostic contrast-enhanced chest/abdomen/pelvis CT study. Chest images are acquired first, approximately 20 s after contrast injection. Abdomen images are acquired in 2 phases, once during the arterial transit of contrast and next during venous phase. Pelvic images are acquired last, approximately 3– 4 min after injection.
generation of multidetector CT scanners. Therefore, it is often desirable to generate a second set of images with thicker slices for easier and more convenient diagnostic interpretation of CT images.
Our clinical experience demonstrates that PET images need to be reconstructed with and without attenuation cor-rection to be available at the time of image interpretation. Although attenuation correction is desirable to properly rescale regional tracer activity for differences in tissue at-tenuation, the CT-based attenuation correction can intro-duce artifacts resulting in apparently increased tracer uptake in regions of metallic implants or devices. Other sources of artifacts from CT-based attenuation correction are beam-hardening effects and image misregistration as a result of patient or respiratory motion. In such cases, the availability of noncorrected PET images is essential at the time of image interpretation to properly differentiate between true patho-logic tracer uptake patterns and false18F-FDG uptake
cre-ated by inappropriate attenuation correction (11,12). Uncor-rected images are essential for assessing possible motion and artifacts and should be checked by the interpreting physician every time a PET/CT study is reviewed.
Image Display and Data Visualization
Perhaps the most challenging aspect of PET/CT is the need to easily navigate and visualize imaging data that essentially represent 5 or 6 dimensionals. In today’s digital environment, the inability to rapidly and efficiently navigate through large sets of 3-dimensional data remains a serious handicap for most interpreting physicians, requiring them to adapt to relatively time-consuming and awkward human– machine interactions (13,14). This task becomes even more complex and tedious when the user navigates through
ad-ditional dimensions between PET and CT data and adjusts CT data to the proper tissue-intensity settings. None of the existing software packages or image display programs pro-vide ideal or user-friendly ways to rapidly review and navigate through such multidimensional data. Most review workstations designed for reviewing PET/CT data provide image fusion capabilities that allow PET images to be mapped using some predefined color scale over the ana-tomic CT images that are displayed in shades of gray (13,15,16). The user has the ability to interactively blend PET and CT images (e.g., molecular and anatomic images) (Fig. 6). Navigation between the two modalities as well as through the volume of data is usually achieved through interactive manipulation of cursors and slide bars on a graphic user interface of the image display software, which can add a significant amount of time to the image interpre-tation task. Using commercially available software, the time required to review and manipulate a complete set of FIGURE 5. Diagram of acquisition
proto-col of head and neck PET/CT followed by contrast-enhanced CT study of head when clinically indicated.
FIGURE 6. Example of fused PET/CT images showing differ-ent degree of image “blending” that allows users to interactively navigate from CT image to PET image in continuous scale in what is being considered a “fifth” dimension of acquired data.
PET/CT data can vary from 10 min for a normal study to as much as 30 min for a complex study with multiple lesions and abnormalities. This exceeds by far the average time required for a radiologist to review standard oncology CT studies. The best image display programs are those that display multiple settings of the same dataset simulta-neously. This includes the three orthogonal planes of the CT images alone, the PET images alone, and the superimposed
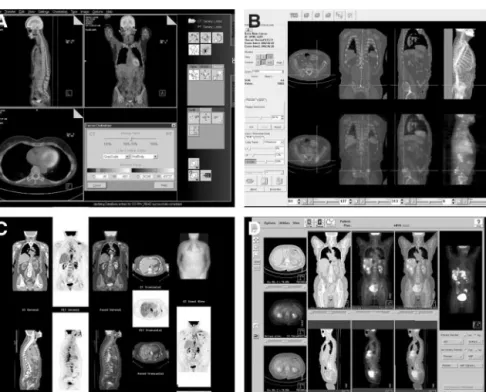
PET and CT images. In many instances, an additional set of noncorrected PET images, as well as projectional PET im-ages, are required for adequate interpretation. The disadvan-tage of displaying several sets of images side by side is that the individual images tend to become relatively small on the screen, requiring the user to manually enlarge individual images to full-screen display to better visualize image de-tails. (Figs. 7 and 8).
FIGURE 7. Example of viewer user inter-face that allows simultaneous display of three orthogonal views of PET images (A), corresponding CT images (B) as well as the corresponding fused images (C). 1⫽ cur-sor for adjustment of blending overlap of color PET image data over CT image. 2⫽ adjustment of contrast and intensity of CT and PET images. 3⫽hairlines that allow selection and positioning of orthogonal planes.
FIGURE 8. Samples of commercially
available graphic user interface of multimo-dality viewing software programs. (A) Sie-mens; (B) Hermes; (C) General Electric; (D) Philips.
Another important limiting factor of multimodality diag-nostic workstations is their performance in handling very large datasets in real time. Such datasets must be loaded in the computer memory to allow real-time interactive navi-gation. Some software programs will achieve adequate real-time performance by compromising the resolution of CT images, either by reducing the spatial resolution (usually in 512 ⫻ 512 pixels per axial slice) to a lower resolution (256⫻256 pixels or less) or by reducing the dynamic range of the CT data from 16 bits of gray shades per pixel to 8-bit gray levels per pixel. This compromises the quality of the CT images, rendering them limited in their diagnostic value. Display programs that can maintain the native high resolu-tion of CT data and scale PET data to match CT resoluresolu-tion require computers with extremely high processing perfor-mance and very large memory capacity to load all the image data in memory. Even with high computational power, such programs still suffer from the time delay required for the software to load these very large datasets. The loading of a complete, whole-body PET/CT study can take several min-utes.
Image Management Images Data Communication
The very large datasets generated by PET/CT scanners, especially with the evolution toward multidetector CT scan-ners, represent a serious challenge for image storage and image communication systems. Both modalities initially generate a set of raw data that subsequently can be recon-structed using different parameters. The raw data (or sino-grams) from PET will be reconstructed with or without attenuation correction and application of different filters to the data. The resulting images are usually cross-sectional images of specified thicknesses that cover the segment being surveyed. The resulting image sets vary in size, de-pending on the selected image resolution and slice thick-ness. An average set of cross-sectional images of 5-mm thickness for a whole-body acquisition can contain 7–10 megabytes (Mb) of data, depending on patient size and number of acquisitions required to cover the body part being evaluated. Because these reconstructed images represent a much smaller volume of data than the corresponding raw data (which can easily vary from 100 to 160 Mb), many institutions elect to store only the reconstructed PET and CT images to reduce the cost of data storage.
The same principle applies to CT images, especially with ultrafast multidetector CT scanners that can acquire very large sets of high-resolution, thin-slice image data recon-structed to different spatial resolutions. Reconstruction of the sets of approximately 1-mm slices requires⬎300 im-ages to cover the thorax and close to 1,000 imim-ages for a whole-body scan. This results in datasets ranging from 150 to 500 Mb. High-resolution scans using very thin slices are desirable for obtaining isomorphic 3-dimensional data that can be resliced in any spatial direction with similar resolu-tion. However, these large datasets complicate image com-munication between different devices in a digital
environ-ment and add significant costs for long-term storage and archiving.
PET/CT WORKFLOW
When PET/CT devices were first deployed in routine clinical use, two major technical challenges were identified: (a) the difficulty of optimizing new acquisition protocols that make the best usage of the performance of the hybrid device while providing the best possible diagnostic quality; and (b) the complex task of managing large sets of image data and providing these to interpreting physicians with the proper navigation tools while keeping the complexity of image interpretation as limited as possible. These chal-lenges are even more prominent in large, multidisciplinary academic centers where diagnostic procedures and interpre-tation tasks are often performed by highly specialized ex-perts who focus on a single type of imaging procedure applied to specific body parts or specific disease categories. In such environments, PET/CT imaging procedures require coordination and consensus agreements. Nuclear medicine specialists, oncology specialists, neuroradiologists, and tho-racic, gastrointestinal, genitourinary, and head-and-neck ra-diologists have different expectations about how and where image data will be reviewed. For example, radiologists working in a busy clinic under time pressure need to be able to read high-quality CT images in their offices. With the development of filmless radiology and picture archiving and communication systems, a significant improvement in diag-nostic workstations has been achieved in recent years. How-ever, many problems still must be resolved. Radiologists rely on specialized display protocols tailored to the type of studies that are being performed by new generations of CT scanners. Multimodality PET/CT review software programs that require a significant amount of interaction and manip-ulation by the user are not suitable for routine diagnostic interpretation of CT scans by radiologists. Moreover, in large academic institutions the logistics of maintaining an effective collaboration between all participants involved in managing and interpreting a PET/CT diagnostic procedure demand seamless data communication.
Defining and implementing combined imaging protocols while complying with the requirements of each specialized area constitute the first challenge. PET/CT image acquisi-tion protocols differ from image acquisiacquisi-tion protocols used with separate PET and CT scanners. Moreover, CT proto-cols are often set up for separate studies on different body parts. Combining different CT acquisition procedures in a single patient examination requires some compromise and ingenuity in setting up sequencing aimed at reducing image acquisition time and minimizing radiation exposure and contrast dose to patients. In addition, when all image data have been acquired in a single study, different interpreting physicians must review each part of the study and reach a final consensus on the interpretation of the findings, a pro-cess that adds to the complexity and difficulties of image
distribution and management. The logistics of routing these images to different interpreters, setting up software tools, and creating an infrastructure that allows images to be read in a timely manner while enhancing communication be-tween the different experts becomes a very complex task. In independent imaging centers, this problem may be less prominent when all images can be interpreted by a single physician.
In most academic institutions, however, nuclear medicine physicians interpret PET images, whereas one or several subspecialized radiologists interpret CT images. At UCLA, the PET/CT images are interpreted in the nuclear medicine department, and the complementary diagnostic CT images acquired in the same session are interpreted by a radiologist. This can result in up to four people interpreting a whole-body scan that includes diagnostic CT images of the chest, abdomen, pelvis, and sometimes head and neck. Images are routed electronically to the different readers, but only a limited number of workstations in the department have the capability to display combined PET/CT images. The radi-ologists will initially interpret the CT data, and a daily reading session with nuclear medicine specialists aims at interpreting the combined image data together. However, this adds a significant amount of time and effort to the workloads of the physicians involved in reaching a con-sensus.
Another difficulty with PET/CT studies is communicat-ing the results to referrcommunicat-ing physicians and other caregivers who rely on image data for patient management and thera-peutic interventions. The complexity of the multimodality data and the limited access to software programs that allow the referring physicians to navigate through multidimen-sional data restrict the ability of radiologists and nuclear medicine physicians to adequately convey the results of these procedures. In most cases, interpreting physicians will capture “snapshots” of relevant frames that show the com-bined fused data with relevant regional findings to be trans-ferred or printed for the referring physicians. Some efforts are being invested into finding convenient ways to provide dynamic cine sequences. This allows users to conveniently modify the blending parameters for PET and CT overlays of a given image to facilitate alternate display of CT images, PET images, or an adjustable combination of both. This usually can be achieved by generating standard video files, such as AVI or QuickTime, which are dynamic files that can be displayed easily on standard computer platforms. How-ever, because these images are selected in a given plane by the interpreting provider, they do not provide users with the ability to interactively navigate through 5 or 6 dimensions of image data
SHORTCOMINGS AND FUTURE DEVELOPMENTS
Combined PET/CT scanners are more than just a conve-nient diagnostic tool for acquiring perfectly registered func-tional and anatomic images (3,17–24). They represent a new
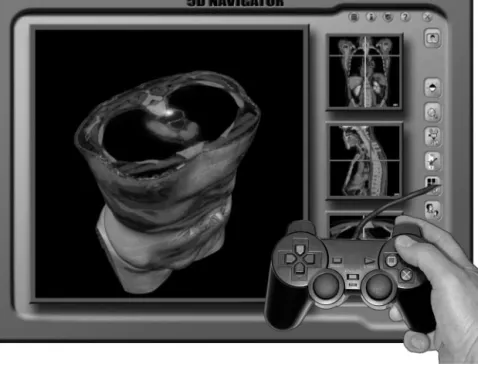
generation of clinical imaging tools that highlight the com-plexity of multidisciplinary clinical decision making. In addition, they emphasize the crucial role of adequate work-flow management when combined with appropriate technol-ogy and computer systems in providing efficient and cost-effective patient management (3,11–24). As such, it is crucial that technology and computer systems become better adapted to the new paradigm of diagnostic interpretation. Without a rapid evolution of image communication and visualization tools, these new combined imaging modalities will suffer from serious limitations in their usability in clinical settings and may not live up to their full potential. As described in this overview, computer infrastructures and software programs currently available for management and display of multimodality studies are still in their infancy and are limited in their capabilities. They are simple evo-lutions from traditional multidimensional display programs and traditional nuclear medicine display software and suffer from serious limitations in performance and functional de-sign, hindering convenient and effective navigation through multidimensional data. Most important, there is an urgent need for improving the design and user interface of image display and navigation tools, allowing users to efficiently review image data without excessive and time-consuming image manipulations and interactions with cumbersome and complex control panels, cursors, and buttons on the graphic user interface. To become more widely adopted in clinical practice, software programs should be more intuitive and simpler to use by physicians who are not necessarily com-puter experts (25,26). It is not unrealistic to envision a new generation of diagnostic workstations that include specially designed navigation devices, similar to those used by the video game industry, that allow the user to interactively navigate through 5 or 6 dimensions of image data (Fig. 9). The basic aim would be to permit rapid navigation through multidimensional datasets by using combinations of point-ing devices, such as jog wheels and joysticks, integrated in a single navigation device. This approach would allow the user to rapidly browse through the 3-dimensional volume of data as well as through other dimensions, such as the blending of the two modalities or the contrast setting of each image modality. Computer-assisted algorithms would also help guide the user through the large sets of data by depict-ing areas that have abnormal or metabolic activity or un-usual morphologic characteristics.
Imaging procedures have become a central component of the evolution toward evidence-based medical practice, and recent studies have shown the growing importance of im-ages and image data in clinical decisions and therapeutic interventions. With the wealth of information provided by combined PET/CT studies, it is even more critical to convey the results of these investigations with the full content and not just through interpretation reports amended with se-lected relevant images. To fully benefit from the added value of the combined anatomically registered studies over that of traditional single-modality examinations, referring
physicians need to be able to interactively view the full set of data. This is particularly relevant in oncology, where a community of physicians involved in patient management needs to visually assess subtle differences in localization, size, structure, and topologic distribution of pathologic le-sions in every location of the body. It is important to convey to device manufacturers that a wider adoption of multimo-dality imaging techniques such PET/CT in clinical routine will be properly enhanced only if the technology has an effect on the whole process of patient management and not just on achieving higher diagnostic accuracy.
Another change in practice that is driven by multimodal-ity imaging techniques such as PET/CT is the need for closer interaction and collaboration between different dis-ciplines and subspecialists. The current state-of-the-art tech-nology in information management infrastructure and com-puter software lacks the necessary tools that allow multiple users to remotely collaborate and share image display and manipulation software to jointly interpret and manipulate image data. This is particularly critical in PET/CT proce-dures that include diagnostic CT images and combined functional and anatomic information from fused PET/CT images. CT images are interpreted by a radiologist, whereas PET data must be reviewed by a nuclear medicine physician with experience in interpreting subtle differences in tracer distribution. In highly specialized academic environments, different specialists will interpret images of different body parts, adding additional individuals who must reach a con-sensus. In addition, an important step in the process of patient management is the collegial discussion between interpreting and referring physicians, surgeons, and oncolo-gists who review the images together to make an appropri-ate decision. In a digital environment, such discussions occur in clinical conferences or on tumor boards and rely on
digital means for presenting images in clinical wards or conference rooms. Here again, the necessity for a conve-nient computer system that can be used to navigate through multimodality images is critical. In today’s setting, most of the time only subsets of “snapshot” images are presented by the radiologist or the nuclear medicine physician, creating a situation that only increases the difficulties in presenting the full dataset for clinical discussion of complex cases.
CONCLUSION
It is imperative that manufacturers of computer tools and experts in image communication structure enhance their support of multimodality and multidimensional imaging in clinical practice that better respond to the needs of the user. The success of PET/CT imaging depends on more than just improvements in the diagnostic performances of PET or CT alone. Rather, PET/CT needs to lead to improvements in clinical decision making and patient care.
REFERENCES
1. Arenson RL, Chakraborty DP, Seshadri SB, Kundel HL. The digital imaging workstation. J Digit Imaging. 2003. In press.
2. Townsend DW, Carney JPJ, Yap JT, Hall NC. PET/CT: today and tomorrow.
J Nucl Med. 2004;45(suppl):4S–14S.
3. Townsend DW, Beyer T, Blodgett TM. PET/CT scanners: a hardware approach to image fusion. Semin Nucl Med. 2003;33:193–204.
4. Beyer T, Antoch G, Mu¨ller S, et al. Acquisition protocol considerations for combined PET/CT imaging. J Nucl Med. 2004;45(suppl):25S–35S.
5. Antoch G, Freudenberg L, Beyert T, Bockisch A, Debatin JF. To enhance or not to enhance?18F-FDG and CT contrast agents in dual-modality18F-FDG PET/CT.
J Nucl Med. 2004;45(suppl):56S– 65S.
6. Vogel WV, Oyen WJG, Barentsz JO, Kaanders JHAM, Frans Corstens FHM. PET/CT: panacea, redundancy, or something in between? J Nucl Med. 2004; 45(suppl):15S–21S.
7. Halpern BDM, Vranjesevic D, Ratib O, et al. LSO-PET/CT whole body imaging in 7 minutes. J Nucl Med. 2003;5:380 –381.
8. Goerres GW, Burger C, Kamel E, et al. Respiration-induced attenuation artifact at PET/CT: technical considerations. Radiology. 2003;226:906 –910. FIGURE 9. Artist’s view of enhanced
multimodality image navigation program that would also use advanced joystick and interactive tool to navigate through differ-ent dimensions of image data. Pointing de-vice that includes multiple joystick and control buttons, in principle, could allow user to navigate more rapidly and more efficiently through multidimensional sets of data.
9. Goerres GW, Burger C, Schwitter MR, Heidelberg TN, Seifert B, von Schulthess GK. PET/CT of the abdomen: optimizing the patient breathing pattern. Eur
Radiol. 2003;13:734 –739.
10. Beyer T, Antoch G, Blodgett T, Freudenberg LF, Akhurst T, Mueller S. Dual-modality PET/CT imaging: the effect of respiratory motion on combined image quality in clinical oncology. Eur J Nucl Med Mol Imaging. 2003;30:588 –596. 11. Kamel EM, Burger C, Buck A, von Schulthess GK, Goerres GW. Impact of
metallic dental implants on CT-based attenuation correction in a combined PET/CT scanner. Eur Radiol. 2003;13:724 –728.
12. Goerres GW, Ziegler SI, Burger C, Berthold T, Von Schulthess GK, Buck A. Artifacts at PET and PET/CT caused by metallic hip prosthetic material.
Radi-ology. 2003;226:577–584.
13. Robb RA. 3-D visualization in biomedical applications. Annu Rev Biomed Eng. 1999;1:377–399.
14. Bidaut LM, Pascual-Marqui R, Delavelle J, et al. Three- to five-dimensional biomedical multisensor imaging for the assessment of neurological (dys) func-tion. J Digit Imaging. 1996;9:185–198.
15. Cook GJ, Ott RJ. Dual-modality imaging. Eur Radiol. 2001;11:1857–1858. 16. Hanson DP, Robb RA, Aharon S, et al. New software toolkits for comprehensive
visualization and analysis of three-dimensional multimodal biomedical images. J
Digit Imaging. 1997;10:229 –230.
17. Bar-Shalom R, Yefremov N, Guralnik L, et al. Clinical performance of PET/CT
in evaluation of cancer: additional value for diagnostic imaging and patient management. J Nucl Med. 2003;44:1200 –1209.
18. Townsend DW, Beyer T. A combined PET/CT scanner: the path to true image fusion. Br J Radiol. 2002;75(suppl):S24 –S30.
19. Hutton BF, Braun M, Thurfjell L, Lau DY. Image registration: an essential tool for nuclear medicine. Eur J Nucl Med Mol Imaging. 2002;29:559 –577. 20. Hasegawa BH, Wong KH, Iwata K, et al. Dual-modality imaging of cancer with
SPECT/CT. Technol Cancer Res Treat. 2002;1:449 – 458.
21. Ell PJ, von Schulthess GK. PET/CT: a new road map. Eur J Nucl Med Mol
Imaging. 2002;29:719 –720.
22. Beyer T, Townsend DW, Blodgett TM. Dual-modality PET/CT tomography for clinical oncology. Q J Nucl Med. 2002;46:24 –34.
23. Kluetz PG, Meltzer CC, Villemagne VL, et al. Combined PET/CT imaging in oncology. impact on patient management. Clin Positron Imaging. 2000;3:223– 230.
24. Wagner HN Jr. Molecular medicine: from science to service. J Nucl Med. 1991;32:11N–12N, 14N–16N, 17N–23N.
25. Zhang J, Sun J, Stahl JN. PACS and web-based image distribution and display.
Comput Med Imaging Graph. 2003;27:197–206.
26. Slomka PJ, Elliott E, Driedger AA. Java-based remote viewing and processing of nuclear medicine images: toward “the imaging department without walls.” J Nucl