Universidad Autónoma de Madrid
Facultad de Medicina
Departamento de Bioquímica
Novel algorithms adding new dimensions to
mass-spectrometry based proteomics:
comprehensive characterization of
post-translational modifications.
Doctoral dissertation
Navratan Bagwan
M.Sc. in life science informatics
Thesis coordinators
Prof. Jesús Vázquez Cobos
Dr. Elena Bonzón-Kulichenko
Centro Nacional de Investigaciones Cardiovasculares (CNIC)
The research leading to these results has received funding from the People Programme (Marie Curie
Actions) of the European Union´s Seventh Framework Programme (FP7/2007‐2013) under REA grant
agreement nº 608027 (¨CardioNext¨ Initial Training Networks project)
Acknowledgment
...
Until we meet again
Those special memories of you will always bring a smile if only I could have you back
for just a little while Then we could sit and talk again
just like we used to do you always meant so very much
and always will do too The fact that you’re no longer here
will always cause me pain but you’re forever in my heart
until we meet again
I would like to dedicate my thesis to
I want to thank many people, without their invaluable academic, educational, psychological and human support and belief in me as a researcher; this work would not have the spirit that it has. Firstly, I would like to thank my supervisor Jesús Mª Vázquez Cobos, who has given me the opportunity to do this PhD. I consider myself fortunate enough that I got an opportunity to work under world-leading proteomic researcher.
Thank you Dr. Jesus, my deep gratitude goes to you. You always guided me throughout this journey and shared the excitement of long years of discovery. Your unwavering enthusiasm for science kept me constantly engaged with my research. I am especially thankful to you for having the faith in my research, and me. I really appreciate the motivation you provided during the tough times of my PhD and personal life. Most importantly, other than science, I will always be inspired by your enthusiasm about everything. And yes, one day will and we should definitely plan a trip to India.
I would like to thank my co-supervisor Dr. Elena Bonzón Kulichenko, for the immense support throughout this time. You have taught me that with right attitude, patience and hard work towards our research, one can eventually seek success. Your enthusiasm, commitment and active contribution to research, has always inspired and motivated me, especially during the rough times. While working under your guidance I have evolved both at personal and professional level. I will always value the things you taught me, let it be small or big. Now when I have my work in my hands ready and reaching to the final step, looking back in times, I can confidently say this: without you, this would not have been possible. You have been a mentor to me in true meanings.
Moving ahead, I am extremely grateful to my friends and colleagues in “la cueva” for providing love, support and a sense of being and belonging there, which often saved me from burnout. Thanks everyone: Marco for all the help, chitchat and humour we shared and of course, the stories of your childhood in India made me amazed and happy. You are the first one in Spain who made me feel home and provided all the guidance and support I needed. Iakes, thanks mate, for everything; I learnt things outside science, which I would have never learnt anywhere else. Spiros, it was probably the best time in cave when you were around, thanks for being such a great friend I still think of somethings and wonder what Spiros would say. Enrique, thanks for many things: I have to say you never said no to me for anything, you thought me, explained me things. Despite all the ups and downs, I am sure I made a good friend (now finally it’s time for you to cut my name from your list). Juan Antonio, “que bien vives”, thanks for always
being supportive, funny, and nice. Emilio, the journey of PTMs and FDR actually started with you and I remember the way you helped and explained, i am glad that I got to work with you, thanks for everything. A big thanks to all the people in the lab for always being nice and supportive, I will admire this.
I also would like to thank to my Tutor Dr. Belen Peral for all the help throughout the university process and bureaucracy. Thanks to my collaborator in Germany, Dr. Dominik and Dr. Adam, It was short but a very productive time. Thanks for José Antonio Enríquez for providing the data for this work and a great collaboration. Especial thanks to Lilit and Eduardo, without you people I would have been most likely an illegal immigrant, and never survived the process. I also want to thanks Surya Gupta; I have come a long way in this journey and of course with loads of sidetracks and always found you there to talk and for support. So thanks for all the support, understanding, help and love.
Last but not the least, my deep and sincere gratitude to my family for their continuous and unappalled love, help and support. I am grateful to my mother for always being there as friend and mentor in life. Thanks “Bhai” for all the love and care you have for me. I am forever indebted to my parents for giving me the opportunities and experiences that have made me who I am. They selflessly encouraged me to explore new directions in life and seek my own destiny. This journey would not have been possible if not for them, and I dedicate this milestone to them.
Abstract
The technological advances in proteomics are allowing an increasingly detailed characterization of the complex panorama of post-translational modifications of proteins and are gradually developing towards an unbiased analysis of peptide modifications. The recently developed ultra-tolerant database search (open search, “OS”) uses precursor mass tolerances of hundreds of Daltons, allowing the identification of modified peptides never identified before by conventional (closed, “CS”) searches. Despite these improvements, OS algorithms still rely on the chance that the modification leaves enough unaffected fragment ions, thus identifies only half of the modified peptides and cannot pinpoint the modification site. Furthermore, there is a need of a generic quantification algorithm able to handle the huge variety of modified peptides resulting from an OS experiment.
In this Thesis, I present a suit of developed algorithms and tools, designed to overcome the above-mentioned limitations. Comet-PTM is an improved search engine that applies the peptide modification mass to the fragmentation series upon score calculations for each peptide-spectrum match (PSM). As a result, we emulate the scores produced by a CS for the same modification set as variable; double the yield attained by a regular OS and localize the modified residue with high accuracy. SHIFTS, controls the PSM false-discovery rate of the CometPTM results through a conservative three-layered approach taking into account the high mass accuracy of modern mass spectrometers.
PtmSticker annotates the enormous wealth of modifications in a semi-supervised way, allowing for the first time the generation of a complete map of the modified peptidome as part of an automated pipeline. For the quantitative analysis of modified peptides, we developed and validated an algorithm based on a previously proposed WSPP workflow, for the simultaneous quantification of the modified peptidome, the whole proteome and systems biology. The model allows detection of PTMs changing independently of the protein abundance change.
These developments were used to characterize the impact of mitochondrial heteroplasmy on the proteome and on the modified peptidome in mice, revealing that the heteroplasmy causes oxidative damage in heart OXPHOS proteins.
Resumen
Los avances tecnológicos en proteómica permiten una caracterización cada vez más detallada del complejo panorama de las modificaciones postraduccionales de proteínas y están derivando hacia un análisis no sesgado de las mismas. Los recientes algoritmos de búsquedas ultra-tolerantes en bases de datos, denominados búsquedas “abiertas, emplean tolerancias de cientos de Dalton alrededor del precursor y permiten la identificación de péptidos modificados que nunca antes se habían identificado en búsquedas convencionales. A pesar de estos indudables beneficios, para identificar un péptido modificado, las búsquedas abiertas siguen necesitando que la modificación deje suficientes fragmentos no-modificados. Por esta razón, sólo se identifica la mitad de los péptidos modificados en comparación con una búsqueda convencional, y no se llega a identificar el sitio de la modificación. Además, hasta la fecha no existe ningún modelo estadístico apropiado para la cuantificación de la enorme variedad de péptidos modificados que resulta de una búsqueda abierta. En esta tesis se presenta un conjunto de algoritmos y herramientas informáticas que resuelven todas estas limitaciones, llevando las búsquedas abiertas a un nivel superior de desarrollo. El Comet-PTM es un buscador en bases de datos capaz de tener en cuenta la masa de la modificación para aplicarla a los fragmentos a la hora de calcular la puntuación del par espectro-péptido (PSM). Como resultado, se logra emular la puntuación que se obtendría en una búsqueda convencional con esa misma modificación definida como variable. Además, se duplica rendimiento de PSMs de la búsqueda abierta y se localiza el sitio de la modificación. SHIFTS es una herramienta para controlar la
Tasa de Falsos Descubrimientos, FDR (False Discovery Rate) de los resultados del
Comet-PTM, mediante una aproximación conservativa de 3 capas que tiene en cuenta la alta exactitud de masa que caracteriza a los equipos de espectrometría modernos. El PtmSticker anota las modificaciones de forma semi-supervisada, permitiendo por primera vez obtener un mapa completo del peptidoma modificado como parte de un flujo de trabajo automático. Sobre la base de un modelo estadístico existente en nuestro laboratorio, el WSPP, hemos desarrollado y validado un algoritmo para la cuantificación del “peptidoma modificado” de forma simultánea con el proteoma y el análisis de biología de sistemas. Finalmente, la plataforma Comet-PTM desarrollada en esta tesis ha sido aplicada al estudio del impacto de la heteroplasmia mitocondrial sobre el peptidoma modificado en diferentes tejidos de ratón. Nuestro estudio ha revelado que la heteroplasmia produce un daño oxidativo a las proteínas de la cadena de transporte mitocondrial fundamentalmente en el corazón.
Table of Content
ACKNOWLEDGEMENT
... VIIABSTRACT
... XIRESUMEN
... XIIITABLE OF CONTENT
... XVABBREVIATION
... XIXINTRODUCTION
... 11. WHAT ARE POST-TRANSLATIONAL MODIFICATION (PTMS) OF PROTEINS? ... 1
2. IMPORTANCE OF PTMS IN BIOLOGICAL SYSTEMS ... 2
3. SECOND GENERATION (SHOTGUN)MS BASED PROTEOMICS ... 3
3.1. CONVENTIONAL DATABASE SEARCH APPROACH FOR PEPTIDE IDENTIFICATION ... 4
3.1.1. IDENTIFICATION QUALITY SCORES ... 6
3.2. PTM IDENTIFICATION: LIMITATIONS OF CONVENTIONAL SEARCH ENGINES ... 6
3.3. UNWANTED SOURCES OF PEPTIDE MODIFICATION ... 7
3.4. HYPOTHESIS-FREE MODIFIED PEPTIDES IDENTIFICATION AND THE DARK MATTER ... 8
4. IDENTIFICATION CONFIDENCE ... 9
4.1. TARGET/DECOY APPROACH ... 9
4.2. CONCERNS IN PTMFDR ... 10
5. QUANTIFICATION OF PEPTIDES AND PROTEINS ... 11
5.1. PTM QUANTIFICATION ... 13
OBJECTIVES
... 151. MOUSE MODEL OF HETEROPLASMY ... 17
2. GENERATION OF HETEROPLASMY MICE ... 17
3. MICE BREEDING ... 17
4. BENCHMARKING MASS SPECTROMETRY DATASET ... 18
5. PREPARATION OF PROTEIN EXTRACTS ... 18
6. PROTEIN DIGESTION, PEPTIDE LABELLING AND FRACTIONATION ... 18
7. LC-MS ANALYSIS ... 18
8. DATABASE SEARCH ... 19
RESULTS
... 211. DEVELOPMENT OF NOVEL BIOINFORMATICS TOOLS ... 21
1.1. COMET-PTM ... 21
1.2. SYSTEMATIC HYPOTHESIS-FREE IDENTIFICATION OF MODIFICATIONS WITH CONTROLLED FDR BASED ON ULTRA-TOLERANT DATABASE SEARCH (SHIFTS) ... 23
1.2.1. MASS RECALIBRATION ... 23
1.2.2. PEAK IDENTIFICATION ... 23
1.2.3. PEAK ASSIGNATION ... 23
1.2.4. FDR CALCULATION ... 25
1.2.5. ISOTOPIC CORRECTION ... 25
1.3. PTMSTICKER: CONNECTING DOTS AND TRANSLATING NUMBERS TO MEANING ... 26
1.4. PTM QUANTIFICATION AS COMPLEMENT TO WSPP MODEL ... 27
2. BENCHMARKING OF ALGORITHMS AND TOOLS ... 30
2.1. COMET-PTM ENABLES COMPREHENSIVE IDENTIFICATION OF PEPTIDE MODIFICATION ... 30
2.2. COMET-PTM DETECTS THE LOCATION OF MODIFICATIONS IN THE PEPTIDE SEQUENCE... 33
2.3. A SINGLE INTEGRATED STATISTICAL FRAMEWORK ALLOWS QUANTIFICATION OF THE PROTEOME AND OF THE MODIFIED PEPTIDOME... 36
3. APPLICATION OF DEVELOPED TOOLS ... 38
3.1. HETEROPLASMY PRODUCES PROTEIN ALTERATIONS CONSISTENT WITH A MITOCHONDRIAL DYSFUNCTION IN THE HEART ... 38
3.2. HETEROPLASMY MAINLY PRODUCES OXIDATIVE MODIFICATIONS OF OXPHOS PROTEINS IN HEART ... 40
DISCUSSION
... 491. HYPOTHESIS- DRIVEN PROTEOMICS: IT’S ABOUT TIME WE MOVE FORWARD ... 49
2. HYPOTHESIS-FREE PROTEOMICS: A POTENTIAL REPLACEMENT OF CONVENTIONAL DATABASE SEARCH APPROACHES ... 50
3. HYPOTHESIS-FREE PTM ANALYSIS: FROM ALGORITHM DEVELOPMENT TO APPLICATION ... 53
4. FUTURE PERSPECTIVE ... 55
4.1. DECODING THE MASS COMBINATIONS AND AIM FOR A FASTER SEARCH TIME ... 55
4.2. RE-RANKING OF PSMS:XCORR TO CORRECTED XCORR ... 56
4.3. REDISCOVERING THE PLASMA PROTEOME: A SEARCH FOR BIOMARKER BEYOND PROTEINS ... 56
CONCLUSIONS
... 59REFERENCES
... 61APPENDICES
... 791. APPENDIX 1:SUPPLEMENTARY TABLES ... 79
1.1. TABLE 1:BENCHMARKING OF COMET-PTM USING SYNTHETIC PHOSPHO-PEPTIDE ... 79
1.2. TABLE 2:LIST OF FUNCTIONAL CATEGORIES SIGNIFICANTLY ALTERED BY HETEROPLASMY (FDR<5%) AS A CONSEQUENCE OF A COORDINATED PROTEIN RESPONSE ... 79
1.3. TABLE 3:LIST OF MODIFIED PEPTIDES SIGNIFICANTLY ALTERED BY HETEROPLASMY (P <0.05) ... 79
1.4. TABLE 4:CONSERVATION AND STRUCTURAL ANALYSIS OF HETEROPLASMY-MODIFIED PEPTIDES OF OXPHOS COMPLEXES I,III,IV, AND V ... 80
2. APPENDIX 2:HELP FOR THE PROGRAMS DEVELOPED ... 80
2.2. SHIFTS ... 82
2.3. PTM-QUANT-STATS ... 84
2.3.1. TRILOGY ... 88
2.4. PTMSTICKER ... 89
3. PUBLICATION RELATED TO PHD WORK ... 90
3.1. COMPREHENSIVE QUANTIFICATION OF THE MODIFIED PROTEOME REVELS OXIDATIVE HEART DAMAGE IN MITOCHONDRIAL HETEROPLASMY ... 90
3.2. PROTEOMIC FOOTPRINT OF MYOCARDIAL ISCHEMIA/REPERFUSION INJURY:LONGITUDINAL STUDY OF THE AT-RISK AND REMOTE REGIONS IN THE PIG MODEL ... 109
4. OTHER PAPER PUBLISHED DURING PHD ... 126
4.2. SOFTWARE-AIDED QUALITY CONTROL OF PARALLEL REACTION MONITORING BASED QUANTITATION OF LIPID MEDIATORS ... 126
Abbreviations
term
description
AGE Advacance Glycation Products
ANNOVA Analysis of Variances
CS Close Search
CVD Cardiovascular disease
ESI Electrspray ionization
FASP Filter Aided Sample Prepration
FDR False Discovery Rate
GIA Generic Integration Algorithm
HILIC Hydrophilic Interaction Chromatography
HPLC High Performance Liquid Chromatography
IAM Iodoacetamide
iTRAQ isobaric Tags for Relative and Absolute Quantitation
m/z Mass-to-charge
MAD Mean Absolute Deviation
MS Mass Spectrometery
MS/MS tandem mass spectrometry
MS1 survey scan (or full scan)
MS2 fragmentation spectrum
OS Open Search
OXPHOS Oxidative Phosphorylation System
PPM Parts Per Million
PSM Peptide Spectrum Match
PTM Post Translational Modfication
SBT Systems Biology Triangle
SIL Stable Isotop labelling
TMT Tandem Mass Tags
Introduction
1.
What are post-translational modification (PTMs) of proteins?
Proteins are fundamental biomolecules or macromolecules of the cell that carry out and regulate major biological functions. More importantly, they help to maintain the structure/shape of the cell and work as signal transmitters between inner and extra cellular environment. PTMs of proteins can be defined as in vivo biochemical mechanism in which the amino acid residues are covalently modified after protein translation (Prabakaran et al., 2012). PTMs can take place at different amino acids and the process is often driven by an enzymatic activity/reaction. In fact around 5% of the proteome is known to have enzymes that can result in hundreds of PTMs, and many of these PTMs are found to be linked with human disease-associated mutations (Duan and Walther, 2015). Studies of PTMs ranging from yeast to human represents how important they are and known to control or modulate the functional activity of proteins (Mann and Jensen, 2003; Oliveira and Sauer, 2012). For instance, approx. half of the proteins in Saccharomyces cerevisiae are known to be affected by phosphorylation in a metabolic network (Chi et al., 2007). On the other hand, in humans, abnormal phosphorylation has been studied in many diseases, such as cancer and Alzheimer (Khadjavi et al., 2011). Unlike the changes in gene sequence which occurs on an evolutionary time scale and is not required for instant physiological change or development, PTMs permit amino acid properties to be changed “on the fly” if needed for specific response such as the continual battle against the disease (Prabakaran et al., 2012).
PTMs on the different amino acid side chains or at protein C- or N- terminal can extend chemical arrangement up to 20 amino acids by modifying or adding different functional groups such as phosphate. The most studied functional groups added-on to amino acids are oxidation, acetylation, phosphorylation and ubiquitination. In many cases, multiple amino acids are modified by multiple PTMs, which leads to a combinatorial explosion of possible molecular and chemical states. Possible combinations of such PTMs are often the epicentre of sophisticated forms of cellular information processing that are essential for the emergence of organismal complexity.
2.
Importance of PTMs in biological systems
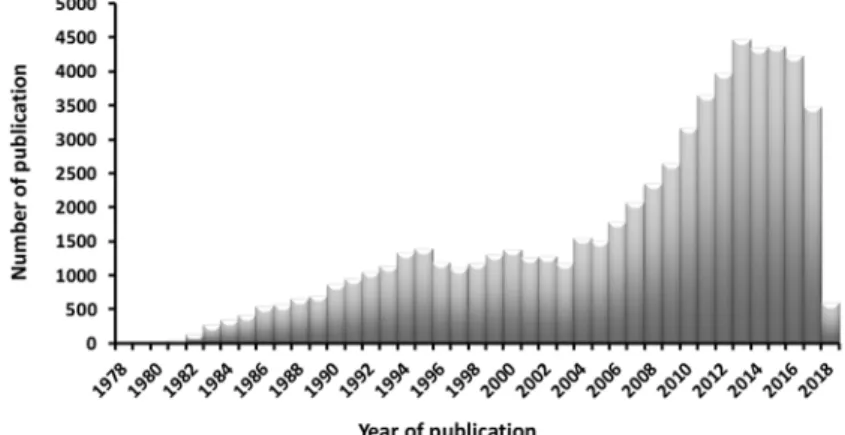
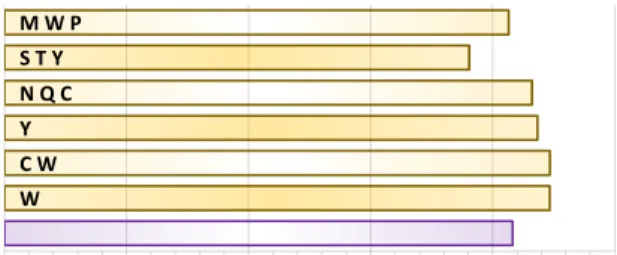
The current advances in the field of systems biology and proteomics, has opened a new era of research where much of the focus has been on PTMs. In recent years the number of published papers has been increasing drastically (Figure 1).(Olsen and Mann, 2013).
Figure 1: Bar plot, representing the number of papers published related to PTMs (PUBMED, keyword; “Post Translational Modification”) in the last three decades.
The growing need to understand and predict the molecular cause of disease remain as a major bottleneck of current medicinal biology. However, taking into account the importance of PTMs, a continuous interest is developing towards computational analysis of disease associated amino acids modification. To this end, various studies have successfully demonstrated the role of PTMs in different diseases such as cardiovascular disease (CVD), aging, mitochondrial dysfunction and Alzheimer.
CVD is one of the leading causes of mortality and morbidity all around the world (Roth et al., 2015). There has been a great emphasis on PTM (Carbamylation, Glycation and Oxidation, phosphorylation) research as they are involved in pathogenesis of CVD (Santos and Lindner, 2017) and eventually lead to progression of other forms of chronic disease such kidney disease (Sadayappan et al., 2009; Gupta and Robbins, 2014; Gajjala et al., 2015).
In other studies, acetylation has been linked to number of diseases, for example, in cancer where N-acetyl provides a unusual subcellular distribution of the tumour antigen (Chammas et al., 1999). In dementia, acetylation impairs synaptic plasticity (Mattson, 2010; Pirooznia and Elefant, 2013). Glycosylation is another well-studied PTM, which results from the addition of sugar to a protein. A class of glycosylation, O-linked glycosylation has been proven to have a positive effect on Alzheimer’s disease, as it reduces the neurofibrillary tangles in neurons
(Broncel et al., 2010). Advanced Glycation End products (AGEs) are also targets in cardiovascular pathologies, and are commonly used a biomarkers, since AGEs have a key role in the progression of cardiovascular diseases in patients with diabetes (Hegab et al., 2012). Moreover, novel medical technologies aiming to prevent mitochondrial genetic diseases, to improve fertility, or to deliver foreign mitochondria with therapeutic goals, can produce mitochondrial heteroplasmy. Mitochondrial heteroplasmy is the presence of more than one variant of mtDNA in the same cytoplasm. In collaboration with the lab of José Antonio Enríquez Domínguez, efforts are made to facilitate a mechanistic model (mouse model), explaining the role of PTMs and understand why the heteroplasmy is harmful in tissues that do not resolve it.
Without any doubt, enormous efforts are made to get a complete glimpse of PTMs in biological systems, but we are still far away from understanding and unravelling the combinatorial complexity of PTMs. Technologies such as mass spectrometry (MS) -based proteomics, are definitely increasing the quality of PTM identification and also allowing us to identify new modifications of proteins. With the constant increasing list of new modifications, the dynamics of protein function needs to be re-evaluated, as most studies concerning PTMs start with a prior knowledge or hypothesis, focusing only on a limited number of PTMs, hence neglecting the completeness of proteome. If the personalized medicine or protein-based biomarkers are the next big platform, it is important to develop tools and methods, which can identify all PTMs in a given biological system, thereby facilitating the complete study of the nexus between the proteome and PTMs.
3.
Second generation (Shotgun) MS based proteomics
The term shotgun proteomics refers to the bottom-up proteomics approach where peptides from digested protein are identified using a combination of a high performance liquid chromatography (HPLC) and mass spectrometry. In a typical workflow (Figure 2), proteins are extracted and denatured either in urea or by high temperature incubation with sodium dodecyl sulphate (SDS). Disulfide bonds are reduced, for example with dithiothreitol (DTT), and alkylated, usually with iodoacetamide (IAM), to prevent protein renaturation. Afterwards, proteins are digested, typically with trypsin (Lina P. Aristoteli, Mark P. Molloy, † and Mark S. Baker*, †, 2006), and the resulting peptide mixtures are fractionated by different means, such as high pH reversed-phase or strong cation exchange chromatography (Junmin Peng et al., 2002).
Peptides are further separated by reversed-phase high-performance liquid chromatography (HPLC) on-line with MS. As peptides elute from the chromatographic column, they are ionized by electrospray ionization (ESI) and injected into the MS instrument. The mass-to-charge (m/z) ratios of the peptide ions are measured to determine the molecular mass of each peptide, producing the MS spectrum. Then, from the top ten most abundant ions, each peptide ion is isolated in the first mass analyzer (MS 1) and directed into a collision cell, where it collides with neutral gas molecules (for example, helium) and becomes fragmented. The mass-to-charge ratios of the resulting fragments are measured in the second mass analyzer (MS 2), producing a tandem mass spectrum (MS/MS spectrum). Fragmentation of ions is mostly performed by collision induced dissociation (CID) (Mitchell Wells and McLuckey, 2005) or higher energy dissociation (HCD) (Ferries et al., 2017). In these fragmentation techniques, peptide precursor ions are broken into pieces at their peptide bonds, and the resulting fragment ions have mass differences corresponding to the residue masses of the respective amino acids. To identify the resulting fragments, the Roepstorff-Fohlman annotation is generally used, where, ions from the N-terminus of the peptide are known as b ions, while fragments from the C-terminus are called y ions (Roepstorff and Fohlman, 1984). This cycle of alternating MS and MS/MS spectra is repeated throughout the chromatographic run, for what is known as the data-dependent acquisition (DDA).
Following the data collection, the MS/MS spectra are further used for high throughput identification of peptide and proteins in a database using different computational algorithm such as Sequest (Eng, McCormack and Yates, 1994), comet (direct descended of academic version of Sequest) (Eng, Jahan and Hoopmann, 2013a), Mascot (Perkins et al., 1999) and X!!Tandem (Bjornson et al., 2008). In the database search engines, each experimental spectrum is matched and scored against the most plausible theoretical peptide in the database (Figure 2).
3.1.
Conventional database search approach for peptide identification
A crucial component of the analysis of shotgun proteomics datasets is the search engine, an algorithm that attempts to identify the peptide sequence from the parent molecular ion that produced a certain fragment ion spectrum in the dataset.For simpler understanding of this process, database search can be categorized in three basic steps: 1) collection of all MS/MS spectra and querying a sequence database for peptides (theoretical peptide) of specific mass; 2) scoring the theoretical peptide against experimental peptide; 3) providing validation for the putative peptide identification. Briefly, for every MS/MS spectra, experimental peptide mass is calculated using its m/z and charge. The database searchalgorithm then collects the set of theoretical peptides having similar or approximate masses to the experimental peptide. For every candidate peptide, fragment ion masses are calculated, matched with the ones of the experimental spectrum, and the peptide candidates are ranked according to their peptide spectrum match (PSM) score.
Figure 2: schematic representation of a typical shotgun proteomics experiment. Left side showing the process where tryptic peptides are generated from a biological protein sample. The obtained peptide mixture is usually fractionated/or not and sent to mass spectrometer usually through a coupled RP-HPLC. The resulting data mainly provides MS1 and MS2 spectra, where MS1 represents intensity versus the m/z of the ionized components at a given retention time, and MS2 contains the intensity versus the m/z of the fragmented products of a component from MS1 at given retention time. The produced data is then searched against theoretical mass spectra of peptides generated from in-silico digested proteins from a database of choice. Upon matching the theoretical and experimental spectra, every match is scored and results in a candidate peptide. Then, using the target/decoy approach, candidate peptides are filtered out by false discovery rate.
3.1.1.
Identification quality scores
For ensuring the quality of identification from MS based experiments, it is necessary that the search engine has a scoring function that consistently ranks correct PSMs better than the poor matches. In the past, there have been multiple publications and tools suggesting different strategies. One of the most widely used approaches is from Sequest (Eng, McCormack and Yates, 1994), where scores are determined on how well the experimental and theoretical spectra are matched/overlapped using cross correlation, which is a sum of all intensities between theoretical and experimental peptide. Being robust and fast, Xcorr function form Sequest is being widely used and studied in proteomics. The first version of Sequest Xcorr was calculated in a two-step process, where, initially a preliminary score was calculated and followed by a cross correlation for the matches which passed a preliminary score.
Sequest Xcorr has experienced significant improvements over the years (Eng et al., 2008; Klammer, Park and Noble, 2009; Diament and Noble, 2011). Particularly, a new search engine, Comet (Eng, Jahan and Hoopmann, 2013b), has implemented the Sequest algorithm with an improved cross correlation (Eng et al., 2008). Comet avoids using Fast Fourier Transformation (FFT) to calculate the full cross correlation, which is computationally expensive. Instead, a pre filter of a preliminary score is used. In addition, the Xcorr calculation is simplified and is calculated for every candidate peptide, associating an E-value for the significant match. E-value increases the sensitivity and allows a simple comparison among scores of spectra, where E-value represents the number of peptides that are expected to match and score well above the best match just by chance.
On the other hand, some approaches use statistical probability methods to compute quality of match, such as MASCOT (Perkins et al., 1999). In MASCOT, the score is the probability that the observed match between the experimental and theoretical peptide is just by chance. The open source search engine Andromeda (Cox et al., 2011) follows an approach similar to MASCOT.
3.2.
PTM identification: limitations of conventional search engines
More than 500 PTMs have been described on UniProt database (April 2018). Hundreds of them have been described in Homo sapiens. Over the years,PTM identification study was mainly limited to a protein or a specific pathway since most of those studies started with a
specific question and a hypothesis. Technological advancements in MS has encouraged scientist to perform database searches with increasingly narrower precursor and fragment mass tolerance, which is usually set in the parts-per-million (PPM) range (Bonzon-Kulichenko et al., 2015). The need to discard incorrect matches and faster database search are one of the few reasons behind the use of narrow tolerance (Hsieh et al., 2010; Bonzon-Kulichenko et al., 2015). However, considering the fact that the number of possible peptide modifications is overwhelming and impossible to anticipate, the database searches aiming to identify modified peptides possesses a greater challenge if narrow tolerances on precursor and fragments are used. In most cases, common chemical modifications, such as methionine oxidation or cysteine alkylation, are added to the search, together with some known biological PTMs. However, the mass shifts produced by unknown modifications are not considered during the search, resulting in lower PSM scores and/or miss-assignments.
3.3.
Unwanted sources of peptide modification
For a number of reasons, MS spectra generated from peptides with modifications outside of the user-specified rules may be present in tandem MS datasets. Non-protease-specific peptides could arise from in-source fragmentation (Kim et al., 2013); chemical artifacts introduced during sample preparation (Savitski, Nielsen and Zubarev, 2006), for instance, over-alkylation (and and Fales*, 2001). Studies have shown that tryptophan oxidation may occur following protein purification and isolation, particularly with the use of gel electrophoresis. Moreover, electrospray ionization has also been reported to induce oxidation of methionine, tryptophan or tyrosine residues (Potgieter et al., 1997). In addition, the labile nature of some modifications also makes them difficult to identify by MS. For instance, oxidative modifications, glycosylation and phosphorylation (on serine and threonine residues) are labile modifications and modified peptides can undergo loss of the substituent under conditions used in electrospray ionization (Carapito et al., 2009; Chick et al., 2015).
In addition, peptides having more than one residue capable of bearing a modification, for instance, peptide with phosphorylation with multiple serine and threonine residues. In such cases, during the spectrum match, the confidence of localizing a modification to a particular residue is dependent on the presence of fragment ions in the MS/MS spectrum derived from the fragmentation between the possible sites of modification. Conventional search engines currently pay little or no attention to representing the certainty or ambiguity of modification
localization in their top scoring result. Considering all the limitations in the existing algorithms mentioned above, only a small fraction of modified peptides is identified and only in a targeted way. Thus, there is a need of an algorithm that would anticipate the mass shift present in the precursor and fragments.
3.4.
Hypothesis-free modified peptides identification and the dark matter
In the age of MS-based high-throughput proteomics (Link et al., 1999), despite having access to millions of spectra, most experiments start with a hypothesis driven approach, especially considering analysis of PTMs. In such cases, the studies tend to consider a subset of modification and the unmodified form of the peptide to draw a conclusion and leaves out the possibilities of having a complete picture of a biological system. Hence, despite the advances in speed and sensitivity which allow the generation of millions of spectra per experiment, only a minority of these spectra could be mapped to proteins (Skinner and Kelleher, 2015; Griss et al., 2016). A large proportion of unassigned spectra are thought to arise from peptides containing sequence variants or unknown chemical and posttranslational modifications (PTM) (Griss et al., 2016), and their characterization is one of the most interesting and challenging goals in proteomics. A number of computational methods have been proposed for the detection of these unmatched peptides (Marshall Bern, Yuhan Cai and Goldberg, 2007; Chen et al., 2009; Kim and Pevzner, 2014; Ma and Lam, 2014; Shortreed et al., 2015; Griss et al., 2016).Recently, an “open search” (OS) strategy, where precursor mass tolerances of hundreds of Da were used with a conventional search engine, was reported to identify modified peptides at an unprecedented scale (Skinner and Kelleher, 2015). OS established that many of the unexplained/unidentified spectra could be explained: by unexpected PTMs or rarely but possibly, from amino acid substitutions not present the search database. They used an ultra-wide tolerant of <1000 Da in Sequest search that identifies hundreds of different type of chemical and biological PTMs.
Figure 3: : Conventional OS methods can identify modified peptides from MS/MS spectra, but only the fragments unaffected by the modification (Orange Square) are matched; this effect diminishes the score assigned to modified peptides, decreasing identification performance
Another report demonstrated that OS could be performed at orders-of-magnitude faster speeds using a novel fragmentation-ion indexing algorithm (MSFragger) (Kong et al., 2017). MSFragger uses the indexing of nonredundant set of peptide and then with mass binning and mass ordering in fragment index to facilitate the faster retrieval of candidate peptides. MSFragger demonstrated it use for OS even with variable modification.These two methods may have a considerable impact on the field, opening the way to true hypothesis-free analysis of PTMs by MS; however, OS algorithms still rely on the chance that the modification leaves enough unaffected fragment ions for matching by the search engine (Figure 3). OS strategies can therefore identify only approximately half the modified peptides detectable by conventional “closed” searches (CS) (Chick et al., 2015). Moreover, existing OS approaches cannot directly identify the modification site.
4.
Identification confidence
Conventional search engines in the era of high throughout proteomics enabled the identification of hundreds of thousands of peptides in MS/MS data on a routine bases, but at the same time made validation of identifications a tedious process. Thus, the false discovery rate (FDR) is generally used to control the percentage of the possible wrong identifications. FDR estimates the number of false positives in a given dataset, which is the ratio of the number of incorrect PSMs and in the total number of PSMs at a chosen identification score threshold (Choi and Nesvizhskii, 2008; Nesvizhskii, 2010).
4.1.
Target/Decoy approach
Most accepted and widely used strategy to evaluate the FDR is based on the target/decoy approach (Elias and Gygi, 2007; Bonzon-Kulichenko et al., 2015), where spectra a searched nor only against the target data base, but also against a “decoy” or false database
XCorr Theoretical Experimental
of the same size as the target data base. The decoy database is made in silico from the target database model organism by either reversing or by shuffling the tryptic peptides. The idea behind this approach is that the PSMs that hit the decoy database are false, and the number of these false PSMs is equal to the number of false PSMs from the target database at a certain score threshold. Creating a decoy is one of the most important factors, which can directly create a bias in identification sensitivity. Moreover, creating a perfect decoy database is almost impossible without losing the composition of target sequence. For these reasons, decoy database made by shuffling or reversing the target sequence, should maintain a target sequence composition, for instance, decoy database should have a similar amino acid distribution and length distribution as target protein database. Moreover, there should only be one decoy sequence for every target counterpart, as this helps to reduce the chances of randomisation and will help to get reproducible results (Elias and Gygi, 2007; Jeong, Kim and Bandeira, 2012).
These target/decoy databases can be used in a concatenated or separated form. In the separated search, both target and decoy databases will be searched separately, so that the score distribution form both searches can be assessed and used for FDR calculation. In the same stream, a concatenated search is conducted by combining the decoy and target databases together. This search reportedly has many benefits, starting with a reduced search space around 20% and an increased sensitivity, since it gives a fair chance of competition between target and decoy match, and only the best match will be chosen for each scan from either target or decoy database(Elias and Gygi, 2007).
4.2.
Concerns in PTM FDR
One of the major concerns regarding PTM identification and FDR control is that the FDR for modifications can drastically vary from the unmodified form of peptides. Some recent studies (Fu, 2012; Fu and Qian, 2014; Kong et al., 2017; Li et al., 2017) suggested solutions and the discussed possible reasons for such cases. In most proteomics studies only a subset of PTMs are defined as variable modification and a global FDR is calculated and raises the risk of under or over estimating FDR. The reasons of happening are that: 1) spectra of modified peptides can have their own features (e.g. insufficient fragmentation or neutral losses), thus, can have different score distributions from those of unmodified peptides, 2) the proportions of modified and unmodified peptide are different in a sample, so the chances of obtaining a correct peptide sequence are different. In a similar way, as the proportions are different for candidate peptides in the search space, the prior chances of
having an incorrect identification are also different. Therefore, a separate FDR also known as “local FDR” has been suggested and used in recent studies.
Alongside the “local” FDR issue, using multiple variable modifications in the search can also increase the search space drastically, which results in two main problems. On one hand, in a huge time complexity. For example, searching for phosphorylation on serine and threonine and oxidation on methionine in peptide “YFDSTDYNMAK” would generate 25=32 possibilities. Considering this same scenario for thousands of peptides would lead to search space orders of magnitude bigger than a search without PTM. On the other hand, because of an increased search space, the FDR increases as the probability of matching a false identification just by chance increases. Another parameter in the search engine that can drastically influence the quality of identification is the precursor mass tolerance; for instance, in ultra-tolerant database search, specifying it to a higher error rate will allow a bigger search space, which will result in reduced sensitivity as chances of random matching increases.
5.
Quantification of peptides and proteins
The simplest definition of quantitative proteomics can be defined as the “study of overall or global changes in protein expression”. However, the nature of MS based proteomics is not inherently quantitative; a large number of variables contribute to the peak intensity in a mass spectrum such as: absolute amount of protein, relative amount of protein among samples. In addition, proteins with similar concentration may generate completely different spectra and signal intensities. For instance, peptides generated from a protein digestion may produce different signals or some peptides might not be identified. One of the most tedious bottlenecks of current high throughput proteomics, where a large number of differential expression data is collected, is to determine and discriminate whether the observed change in protein is statistically significant or it has been stacked up from PSM or peptide level outliers.
Despite all the hurdles, MS can be used for generating quantitative data. In brief, quantification can be classified in two major categories: stable isotope labelling (SIL) and label free (LF). In the most general way, in the LF technique, for each sample a separate analysis is performed comparing peptide peak intensities. Wherein each protein is then quantified by, taking the most intense peptides averaged from three different technical replicates, or by using spectral or peptide counting, by taking the number of spectra or peptides for each protein.
Most importantly, in any of the label free techniques the reproducibility of the reverse-phase HPLC-MS instrument is critical. There are several statistical models previously published taking into account all the limitations of such a technique, some of the most prominent models uses an analysis of variance (ANOVA) (Daly et al., 2008; Clough et al., 2009; Karpievitch et al., 2009). In brief, label-free quantitation involves analyzing several technical replicates of the same sample or biological replicates belonging to more than one different conditions. The need of having several replicates helps to overcome the difference in ionization efficiency that arises from the same peptide from the different samples analyzed separately in the MS. Because of label free data’s multiplicative nature, different factors such as fixed and random error source come into play, thus the quantitative data is usually subjected to logarithmic transformation. Such transformation allows treating the error source as additive, which makes it easier to model the replicate structure within the analysis of ANOVA.
On the other hand, stable isotope labelling (SIL) includes three major categories: metabolic labelling such as SILAC which refers to isotope labelling of amino acids in cell culture (Ong and Mann, 2007). Enzymatic labelling such as 18O (Xudong Yao et al., 2001) and compares only two samples per experiment. Chemical labelling such as iTRAQ (Ross et al., 2004) or TMT (Thompson et al., 2003) are one of the most widely used techniques for large comparative experiments. In SIL, since the same peptide from the different samples ionizes at the same time, it has the same ionization efficiency. In comparison to label free, SIL provides improved quantitative precision, accuracy.
In general there are many statistical models to study and to deal with the variation and outliers in SIL approaches (Chee Sian Gan et al., 2007; Hultin-Rosenberg et al., 2013). Most of these studies use a simplistic way of calculating the protein values as an average (mean or median) of peptide ratios and comparing them among different experiments or replicates using a student’s t-test or advancing slightly by ANOVA. Moreover, most models and statistical significance tests are based on normality assumptions that have not been tested despite the fact that heterogeneity of variance has been documented in all SIL methods. These techniques are based on peptide-centric measurements, and the lack of general models leads to the subjective choice of a method for combining multiple peptide readings to estimate protein ratios. For example, ANOVA, which considers the same number of scans per peptide and the same number of peptides per protein. This is far from true in a data-dependent experiment, characterized by under-sampling.
However, many of these limitation were dealt with in a single statistical framework previously developed in out laboratory called weighted spectrum, peptide, and protein model (WSPP) (Navarro et al., 2014a). WSPP model allows a systematic comparison and establishes a validity of null hypothesis at each one of the levels (spectrum, peptide and protein). WSPP model provides a detailed description of the behavior of the technical variance, and by analyzing it independently at the spectrum, peptide, and protein levels, the model is able to capture separately the specific error sources of each SIL and MS method, demonstrating that error distributions are accurately modeled in all cases at the three levels. Last, but not least, it is applicable to any kind of quantitative proteomics experiment and instrument.
5.1.
PTM quantification
The quantification of PTMs, although very important to understand the biological
processes, is technically challenging. On one hand, PTM-containing peptides are often low abundant. As stated before, the very high dynamic range of protein concentrations in a cell poses serious difficulties for the quantification of PTMs. In addition, it is difficult or impossible to devise a strategy allowing the separation and analysis of all the structurally diverse protein isoforms, because of the number of possible combinations of PTM locations within a protein with several PTMs. Importantly, PTM quantification not only has to cover the proteins change in abundance but also the determination of the modification site. In general, these enrichment steps enrich a specific type of PTM and/or deplete the big portion of non-modified peptides that impede the PTM analysis. Therefore, this approach creates a need for two separate experiments one for PTM and the other one for unmodified peptides. Different strategies are used to enrich PTMs, for instance, strong cation exchange chromatography is used for phospho or glycopeptides (Lohrig, Sickmann and Lewandrowski, 2011). Some technique also target the physiochemical characteristics of modified peptides, which results in specific retention times in reversed phase (Batth, Francavilla and Olsen, 2014) or Zwitterionic hydrophilic interaction chromatography (Zic-HILIC) (Parker et al., 2013). In some cases, to fractionate the sample more, a combination of affinity chromatography and HILIC is used. On other hand, immobilized metal affinity chromatography (IMAC) (Thingholm and Larsen, 2016a) or Titanium dioxide (TiO2) (Thingholm and Larsen, 2016b) is mainly used for selective enrichment of phosphopeptides (Engholm-Keller et al., 2012). For most PTMs, however, no strategy or protocol for enrichment exists at the moment, and are often either left out of the study, or have to be analysed one by one on protein-by-protein bases (Olsen and Mann, 2013).
Considering the growing interest in the cross talk between different PTMs, there is an urgent need for new methods and tools, which would enable identification and quantification of multiple PTMs simultaneously. Many algorithms (Lu et al., 2007; Cox and Mann, 2008) have provided a promising way for quantification of proteins and can be directly extrapolated to PTMs. For Instance, MaxLFQ a part of MaxQunat However, there is still a need of a generic quantification model for PTMs, which can detect changes in PTM independent of the protein change. A further important consideration is that OS methods have not been previously used to quantify PTM alterations, and a general statistical model for the analysis of data of this kind is currently lacking.
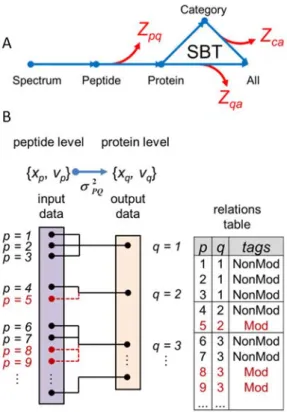
The WSPP model (see also section 5) considers three different variance sources (at the scan, peptide and protein levels), which allows a more accurate modelling of the heterogeneous variance at all levels. This variance heterogeneity at all levels is taken into account by applying weighted averages to quantify scans, peptides and proteins and resolves the under-sampling problem of DDA MS experiments. Along with WSPP model, another model called systems biology triangle (SBT) was developed in our lab, that allows the study of protein coordination by pairwise quantitative proteomics (García-Marqués et al., 2016).
In the past the WSPP model has been applied to modified peptides to analyse the change in the redox state of the cysteine containing peptides (Martínez-Acedo et al., 2012). Analysis was performed in two steps; first, proteins were quantified and peptide variance was estimated with non-cysteine-containing peptides. Furthermore, in a second step, cysteine-peptides were introduced and their deviation was calculated from the corresponding protein. This allows in a single analysis, a reliable detection of quantitative alteration in the peptides independent of the protein change in abundance. However, in second step, when cysteine-peptides are introduced, protein means are recalculated, introducing a bias in protein quantification and reducing the sensitivity to detect modified peptides changes in abundance. Modified peptides derived from proteins detected with less than one non-modified peptide (orphan modified peptides) were excluded from the analysis.
Objectives
Post-translational modifications hugely increase the functional diversity of proteomes. Recent algorithms based on ultra-tolerant database searching (Open search, OS) have opened the way towards unbiased analysis of peptide modifications by shotgun mass spectrometry. However, OS approaches identify only one-half of the modified forms detectable by conventional “closed” searches and do not map the modified residue. Moreover, OS has not been used for the quantification of modified peptides and reliable statistical models for these kinds of experiments are currently lacking.
Mitochondrial heteroplasmy (a condition produced by mitochondrial replacement therapies used in the treatment of infertility and other mitochondrial-linked diseases in humans) has been demonstrated to produce adverse physiological effects. However, the underlying mechanisms are unknown and the biomedical importance of this situation makes it urgent to understand better how these undesired effects are produced.
For these reasons, my PhD thesis is centered on the following general objectives:
1. To develop new algorithms for the comprehensive hypothesis-free identification of all MS-detectable peptide modifications, allowing accurate location of the modified residue.
2. To take further the statistical model for quantitative proteomics previously developed in our laboratory, adapting it for simultaneous quantification of the modified peptidome and the proteome and for systems biology interpretation.
3. To illustrate the performance of the newly developed tools by uncovering the changes in the modified peptidome brought about by mitochondrial heteroplasmy in different mouse tissues.
Material and methods
All the heteroplasmic mice generation and animal handling was performed in the lab José Antonio Enríquez Domínguez. (Functional Genetics of the Oxidative Phosphorilation System (GENOPHOS))
1.
Mouse model of heteroplasmy
All animal procedures conformed to EU Directive 86/609/EEC and Recommendation 2007/526/EC regarding the protection of animals used for experimental and other scientific purposes, enforced in Spanish law under Real Decreto 1201/2005. The mice were fed a standard chow diet (5K67 LabDiet).
2.
Generation of heteroplasmy mice
Heteroplasmic mice were generated by electro-fusing cytoplasts from conplastic BL/6NZB zygotes to recipient C57BL/6JOlaHsd (BL/6C57) one cell embryos, cultured overnight
and transplanted as two-cell embryos into pseudo pregnant Hsd:ICR (CD-1®) females to
complete development to term as previously described (Jenuth et al., 1996). To the best of our knowledge, no consensus rule to name heteroplasmic mouse strains exists. Here, we propose the following designation to name heteroplasmic mouse strains: NUCLEAR GENOME-mtCYTOPLASMIC GENOME #1 + CYTOPLASMIC GENOME #2 [i.e., C57BL/6J-mtC57BL/6+NZB, a strain with the nuclear genome of C57BL/6J and the cytoplasmic (mitochondrial) genome of C57BL/6J and NZB]. To simplify we are calling it BL/6 C57-NZB along this report. The female heteroplasmic offspring (named BL/6C57-NZB) were mated
with C57BL/6JOlaHsd males to prevent nuclear genetic drift in our particular mice lines. Only offspring of the established heteroplasmic mice were used.
3.
Mice breeding
Heteroplasmic females (BL/6C57-NZB) were outcrossed with males BL/6C57. Only females with
an initial level of NZB heteroplasmy above 20% were used for colony maintenance.
The mice used in this work were 12-week-old control (C57BL/6JOlaHsd strain) and heteroplasmic males (containing more than one mtDNA in the same cytoplasm, C57BL/6 background). The effect of heteroplasmy on the PTMs of the proteome of different tissues was studied on liver, heart, and skeletal muscle (gastrocnemius) samples. In the last two tissues, the heteroplasmy was stable, while the liver was selected as a control tissue since it spontaneously
selected one of the alternative variants of mtDNA (manuscript in submission For each tissue, biological replicates from different control (N = 3) and heteroplasmic mice (N = 4) were analysed.
4.
Benchmarking mass spectrometry dataset
To test the performance of the developed algorithms, we used the publicly available HEK293 dataset (Chick et al., 2015), containing 1.121.149 MS/MS spectra in 24 raw files acquired on a Q-Exactive Orbitrap mass spectrometer. For the bench-marking of site localization through CometPTM we used a synthetic phosphopeptide data set from the Pride database (dataset identifier PXD007058) (Ferries et al., 2017).
5.
Preparation of protein extracts
Mice were sacrificed by cervical dislocation. After that liver, heart and skeletal muscle tissues were extracted. 20 mg of each tissue were homogenized in lysis buffer (10mM Tris-HCL pH7.4, 1 mM EDTA, 0.32 M sucrose, 2% SDS) freshly supplemented with protease and phosphatase inhibitors (Roche) and 50 mM DTT, using a MagNA Lyser instrument (Roche). The lysate was boiled for 5 min and cell debris were removed by centrifugation.
6.
Protein digestion, peptide labelling and fractionation
Proteins were treated with 50 mM iodoacetamide (IAM) and digested with trypsin using the Filter Aided Sample Preparation (FASP) digestion kit (Expedeon) (Wiśniewski, Zielinska and Mann, 2011) according to manufacturer’s instructions. Dried peptides were labeled using 10 plex-TMT reagents according to manufacturer’s instructions (Thermo Fisher Scientific), desalted on OASIS HLB extraction cartidges (Waters Corp.) (Leyfer and Weng, 2005), separated into 7 fractions using the high pH reversed-phase peptide fractionation kit (Thermo Fisher Scientific) and dried-down before MS analysis.
7.
LC-MS analysis
Each fraction of the labelled peptide samples were analysed using an Easy Nano-flow HPLC system (Thermo Fisher Scientific) coupled via a Nano-electrospray ion source (Thermo Fisher Scientific, Bremen, Germany) to a Q Exactive HF mass spectrometer (Thermo Fisher Scientific, Bremen, Germany). C18-based reverse phase separation was used with a 2-cm trap column and a 50-cm analytical column (EASY column, Thermo). Peptides were loaded in buffer A (0.1% formic acid (v/v)) and eluted with a 240 min linear gradient of buffer B (80%
acetonitrile, 0.1% formic acid (v/v)) at 200 nL/min. Mass spectra were acquired in a data-dependent manner, with an automatic switch between MS and MS/MS using a top 15 method. MS spectra were acquired in the Orbitrap analyser with a mass range of 400–1500 m/z and 60,000 resolutions. HCD fragmentation was performed at 27 of normalized collision energy and MS/MS spectra were analysed at 60,000 resolutions in the Orbitrap.
8.
Database search
Unless indicated otherwise, all searches were performed using Comet release 2016 (Eng, Jahan and Hoopmann, 2013b; Eng et al., 2015). Using trypsin digestion with 1 missed cleavages (unless otherwise specified) and fixed Cys carbamidomethylation (57.021464 Da). For heteroplasmic mice data, TMT labelling at N-terminal end and Lys was also considered as a fixed modification (229.162932 Da). Fragment ion tolerance was 0.02 Da, 0 mass offset. Precursor tolerance type and isotope error were set to 1. Precursor charge range was 2-4, maximum precursor charge 5 and maximum fragment charge 3. Only y- and b-ions were used for scoring.
Closed searches (CS) were performed at 5-ppm precursor ion tolerance, using three dynamic modifications: Met oxidation (15.994915), Asn and Gln deamidation (0.984016) and Ser and Thr phosphorylation (79.966331). Peptide identification from MS/MS data was performed using the probability ratio method (Martínez-Bartolomé et al., 2008). False discovery rates (FDR) of peptide identifications were calculated using the refined method (Navarro and Vázquez, 2009; Bonzon-Kulichenko et al., 2015); 1% FDR was used as the default criterion for peptide identification. Open searches (OS) with Comet and Comet-PTM were performed in the same conditions as CS, except that precursor ion tolerance was set to 500 Da.
Results
In the theme of this thesis, to overcome and to highlight the issues regarding PTM identification and studies build around PTMs, the results are divided into three sections: development, benchmarking and application. In development section, a detailed explanation of novel algorithms and tools developed is provided. In benchmarking, the performances of developed tool is analysed and discussed thoroughly. To show the impact of these newly developed algorithms, the suit of these bioinformatics tool was applied on a biological model of mitochondrial heteroplasmy and biological conclusions are discussed concerning PTMs.
1.
Development of novel bioinformatics tools
1.1.
Comet-PTM
CometPTM was developed (in collaboration with Spiros Michalakopoulos and Marco Trevisan-Herraz) by modifying the open-source database search engine (Eng et al., 2015). For every sequence candidate Comet-PTM calculates the difference between theoretical and experimental precursor mass (Mass), and adds up this mass iteratively to each one of the amino acid masses in the peptide sequence, calculating a Xcorr score in each one of the possible modified forms of the peptide (Figure 4). The selected candidate is the modified peptide form that produces the highest Xcorr. This design allows Comet-PTM to reach the score that would have been obtained by performing a targeted CS with the same modification in the same position (Also with OS). Note that the scores are not exactly identical, since CS uses the theoretical mass of the modification and Comet-PTM estimates it from the difference between the precursor mass and the theoretical mass of the non-modified peptide, and experimental errors on this estimate may affect fragment matching. This effect is, however, small when low ppm precursor mass accuracies are used (Figure 5 A and B). Comet-PTM has a user-selectable option of scoring also the non-modified peptide sequence (even when ΔMass is different from zero), to take into account labile modifications (Kong et al., 2017).
Comet-PTM was developed to take full advantage of the multi-thread design of Comet. Comet-PTM used less than 4 hours to perform a 500 Da-wide open search of 16 LC-MS runs, containing an average of 44,390 MS/MS spectra each, using a computer cluster with 16 nodes, where each node is built of 2 x Intel Xeon E5-2695v2 at 2.40 GHz and contained 46 threads/124 gigabyte.
Figure 4: Schematic representation of comet-PTM algorithm. Comet-PTM firstly calculates the difference between the mass of the candidate and the mass of the precursor ion detected by the mass spectrometer (ΔMass). ΔMass is then iteratively added to each amino acid in the peptide sequence and the position that yields the best score is selected as the correct match.
Figure 5: Peptide identification performance of PTM (A-B). Comparison of scores obtained from Comet-PTM and CS in the population of PSM that produced the same match with the two engines. A match was considered identical when the peptide sequence was the same and the difference between ΔMass obtained by Comet-PTM and the theoretical mass of the modification selected in CS was within 5 ppm (A) or 0.5 ppm (B). Note that the scores were practically identical, and the dispersion around the identity line was diminished when the tolerance decreased; this demonstrates that the small differences in the score are a consequence of the error in the estimation of ΔMass and not in the design of the score in Comet-PTM.
XCorr XCorr XCorr Best XCorr
…
XCorr XCorrmass = Experimental – Theoretical
0 2.5 5 7.5 10 0 2.5 5 7.5 10 Xco rr (Co m et ‐ PT M ) Xcorr(Comet‐CS) 0 2.5 5 7.5 10 0 2.5 5 7.5 10 Xco rr (Co m et ‐ PT M ) Xcorr(Comet‐CS) 5 ppm 0.5 ppm
A
B
1.2.
Systematic Hypothesis-free Identification of modifications with
controlled FDR based on ultra-Tolerant database Search (SHIFTS)
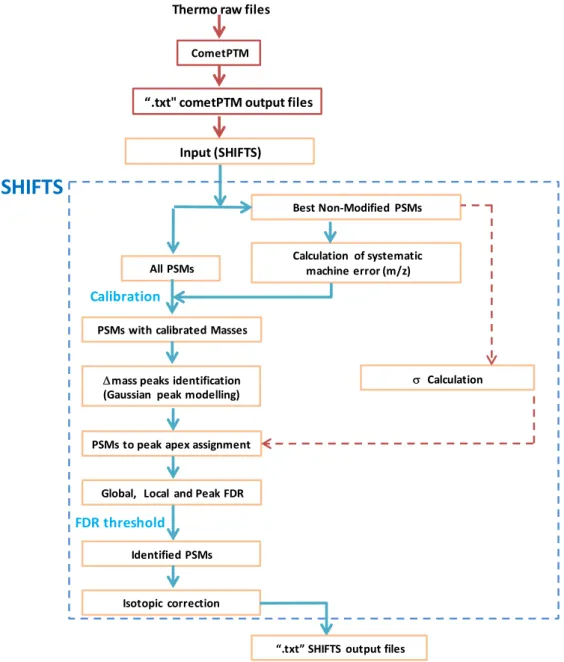
SHIFTS is a program that was develop to identify peaks in frequency distribution of modified peptides on the basis of the mass change/shift of their modification (ΔMass distribution), to assigns PSM to peaks and to calculate FDR for peptide identification (Figure 6). SHIFTS uses as input the files obtained from Comet-PTM search.1.2.1.
Mass recalibration
SHIFTS firstly recalibrate precursor peptide masses independently in each raw file. Recalibration was performed on a population of non-modified peptides with a very high score (user selectable; recommended values are those yielding 0.1% global FDR or lower). The selected population were assumed to be true identifications and are used to calculate the systematic mass error (median deviation in m/z scale), which is assumed to be constant in each raw file. From these data, SHIFTS also calculates the standard deviation of the mass error ( ) using the median absolute deviation (MAD) method (Figure 6).
1.2.2.
Peak identification
Recalibrated ΔMass values were binned using 0.001 Da bins to construct the Mass distribution. The distribution was smoothed using the median of a 7-point sliding window and then peak apexes were detected as downward zero-crossings in the first derivative of the smoothed curve. Peak widths were similarly calculated as the zero-crossing points of the second derivative; in the current version of SHIFTS they are computed only for informative purposes.
1.2.3.
Peak assignation
By default SHIFTS assigns a PSM to the closest Mass peak if the mass deviation of the PSM from the peak falls within3 , so that approximately 99% of PSM in each peak are assigned. This value can be user adjusted. PSM not assigned to peaks were considered as orphan PSM. The use of MAD to assign a PSM to peak was driven by simple hypothesis; that the distribution of Mass at any charge or any range of Mass follows the same distribution of “True” non-modified peptide distribution. Hence, the deviation of very high scoring non-modified PSM was measured as a MAD (Figure 7).
Figure 6: Schematic representation of SHIFTS. The workflow depicts how the output from Comet-PTM is processed, including mass recalibration, peak detection and FDR calculation
Figure 7: distribution of Oxidation in different charge state. Plots represents distribution of “True” non-modified peptides, which was used as MAD to assign PSMs to peak apex.
Thermo raw files CometPTM
“.txt" cometPTM output files
Calculation of systematic machine error (m/z)
mass peaks identification (Gaussian peak modelling)
Best Non‐Modified PSMs All PSMs
PSMs with calibrated Masses Calibration
Global, Local and Peak FDR PSMs to peak apex assignment
Calculation FDR threshold Identified PSMs Isotopic correction
SHIFTS
Input (SHIFTS)“.txt” SHIFTS output files
0 2000 4000 6000 8000 0 20000 40000 60000 ‐0.01‐0.005 0 0.005 0.01 PS M m/z Non‐modified Oxidation Charge‐2 0 1000 2000 3000 4000 0 20000 40000 60000 ‐0.01‐0.005 0 0.005 0.01 m/z Non‐modified Oxidation Charge‐3 0 100 200 300 400 500 0 20000 40000 60000 ‐0.01 ‐0.005 0 0.005 0.01 m/z Non‐modified Oxidation charge‐4
1.2.4.
FDR calculation
SHIFTS calculates the FDR of identification using a conventional target/decoy strategy using the corrected Xcorr score (cXcorr) (Keller et al., 2002; Choi, Fermin and Nesvizhskii, 2008). A global FDR was calculated for each PSM as the ratio of the number of decoy PSMs to the number of target PSMs having a cXcorr equal or higher. Decoy peptides matched by Comet-PTM were observed to be almost as abundant as target peptides in the negative Mass region below the peak corresponding to neutral loss of Gly (Figure 8A), where Mass peaks were mostly produced by neutral loss of amino acids. For this reason, the global FDR was only calculated in the Mass region above -56 Da (Figure 8A). All the PSM are required to have FDR lower than the global FDR, without exception.
In addition, local FDR filters are also applied. Some Mass peaks were observed to contain an unusually high number of decoy PSMs. To avoid matching false positive target PSM in these peaks, SHIFTS also calculates a peak FDR counting up the number of decoys and target PSM assigned to each peak and these PSM are required to pass the peak FDR filter in addition to the global FDR filter (Figure 8C). Note that peak FDRs are often very low suggesting that the majority of PSM in these peaks are true, even when they have a low cXcorr. This happens because the probability of finding a decoy PSM in a peak by chance alone is extremely low. SHIFTS avoids matching these low scoring target PSMs by applying the global FDR filter.
To apply a local filter to PSM which are not assigned to ΔMass peaks, e.g. to orphan PSM, SHIFTS models the periodic mass distribution of decoy PSM into ~1 Da-bins centered at the regions where ΔMass values concentrate, and calculates a local FDR by counting up decoy and target PSM in each one of these regions (Figure 8B). The local FDR filter is applied 0to orphan PSM in addition to the global FDR filter. Default values for peptide identification were 1% for peak and local FDR; 5% for global FDR.
1.2.5.
Isotopic correction
SHIFTS also perform a simple isotopic correction to minimize miss assignations of the correct monoisotopic peak of the precursor. When two PSM having the same sequence are encountered having a ΔMass difference within 1 ppm of the mass difference expected for either one or two 13C or one 34S, that of the lightest one substitutes the ΔMass of the heaviest precursor.
Figure 8: Distribution of target/decoy PSMs and FDR calculations. (A) ΔMass distribution of target and decoy PSMs and range of application of the global score threshold. The vertical scale is enlarged to show the distribution of decoy PSMs. (B) Local score thresholds applied in each ~1 Da bin in the ΔMass distribution(C) Peak score thresholds applied to the peaks detected by SHIFTS in the ΔMass distribution.
1.3.
PtmSticker: connecting dots and translating numbers to meaning
PtmSticker is an algorithm that enables semi-supervised annotation of peptide modifications. In the Comet-PTM output, PtmSticker searches the ΔMass values against the Unimod database with a user-defined tolerance (in PPM range), taking into account the modified amino acid. In addition, the algorithm also takes into account the preceding and the consecutive residues of the initially modified residue and compares them with the list of amino acids that could be subjected to the modification according to Unimod. Upon failing to match the Δmass and the residue in UniMod, it checks the residues, containing modifications that were fixed in the database search. Residues with fixed modifications were considered with and without the fixed modification; when not indicated, the amino acid contains the fixed modification (e.g., C_oxidation means oxidation of carbamidomethylated Cys and K_oxidation, oxidation of TMT-labelled Lys). ΔMass-0.3 -0.1 0.1 0.3 0.5 15 17 19 21 23 25 27 0 0.2 0.4 17.9 18 18.1 0 0.2 0.4 19.9 20 20.1 Target Decoy 0 250 500 750 1000 -500 -300 -100 100 300 500 Target Decoy Global FDR range Local FDR threshold Global FDR threshold Peak FDR threshold