Performance Modeling Of
Interactive Gaming
A.F. Wattimena
May 2006
Performance Modeling of Interactive Gaming
Performance
Modeling
of
Interactive
Gaming
Alexander
Franciscus
Wattimena
University: Vrije Universiteit Faculty of Sciences
Business Mathematics and Informatics De Boelelaan 1081a
1081 HV Amsterdam
Supervisors: Sandjai Bhulai Rob van der Mei
Company:
TNO Informatie‐ en Communicatietechnologie Brassersplein 2 Postbus 5050 2600 GB Delft Supervisors: Rob Kooij Hans van den Berg
Oct 2005 ‐ May 2006
Performance Modeling of Interactive Gaming – Executive Summary
Executive
Summary
Interactive gaming has taken an enormous flight since the Internet enabled gamers to play over a globally accessible network. Increasingly, gaming looks to be one of the mainstay applications that help to strengthen retention and loyalty of high‐speed Internet consumers. By providing a superior gaming experience that produces reliable performance, broadband operators can likely retain relationships for years with the next generations of customers. However, in the past online gaming has been mainly approached from a marketing point of view. Relatively little time has been spent on scientific research. As a consequence, large gaming service providers often lack information on both gamers’ demands and estimations of delay times (ping times). This type of information is crucial before deploying large‐scale real‐time services over the Internet.
The objective of this research project was to provide insight into the estimation of ping times and into the quality experience of gamers.
In “Part I: Gaming Performance Model” the influence of different network parameters on First Person Shooter ping times was studied. We followed a mathematical approach which heavily relied on queuing theory. The ultimate result was a Mathcad implementation which enabled us to calculate delay quantiles for different network scenarios. We were particularly interested in the influence of VoIP traffic running over the same network. We found out that the addition of voice packets above 25% of total traffic leads to a decrease in ping times, while smaller fractions of additional voice packets result in an increase in ping times (compared to the situation in which only gaming traffic is running over the network). Other parameters of interest were the load on the aggregation link, the inter‐arrival time of gaming bursts and the Erlang order K of mean burst sizes. The first two mentioned parameters have a negative impact on the network quality of the FPS gamers: ping quantiles are significantly higher for increased parameter values. Increasing the Erlang order
K
has the opposite effect: the decrease in variation of the mean burst size results in less congestion in the system.
In “Part II: G‐model” we focused on the influence of network impairment on subjective and objective performance measures. We conducted a user experiment to quantify this impact. Our experiment results demonstrate that ping and jitter have a significant negative effect on both the subjective and objective gaming quality, while packet loss goes unnoticed for values up to 40%. Making use of a multi‐ dimensional regression analysis we developed the Quake IV G‐model which enabled us to predict a gamer’s quality rating (expressed in a Mean Opinion Score) based on ping and jitter values. A follow‐up validation experiment showed that the model is very accurate in estimating MOS values. A similar regression model was constructed to relate the network impairment to the objective performance measure kills. Concerning the objective performance of gamers, we conclude that although a player’s score is significantly affected by ping and jitter, interpretation of an objective measure value is very hard because of the additional dependence on other factors like the number of players, the size of the map and the skill level of the players.
Performance Modeling of Interactive Gaming ‐ Preface
Preface
This report is the final product of my internship at TNO Information and Communication technology. The internship is an obligatory part of the Master program of Business Mathematics and Informatics. From October 2005 to May 2006 I have conducted my research on performance aspects of interactive gaming as a trainee within the department Planning, Performance, and Quality.
I would like to take this opportunity to thank my TNO supervisor Rob Kooij for his great contribution to my graduation project. I have really enjoyed our cooperation, which was not bounded by the walls of the TNO office. His sparkling personality had a positive influence on both my project as well as on me as a person. Besides his sharp insights and remarks I am very grateful for all the opportunities he has created for me during my time at TNO. Also, I would like to thank my VU supervisors Sandjai Bhulai and Rob van der Mei for their valuable feedback.
Furthermore, I would like to thank Kamal Ahmed, Jeroen van Vugt, John Beerends and Rob Blokland for their support during the setup and execution of our gaming experiment. Of course my gratitude goes out to the participating players as well. I would specially like to thank Nono van den Hoek Ostende a.k.a. Tex, who hooked me up with some of Holland’s finest Quake IV players.
Altogether, the seven months at TNO have been great and would not have been the same without the fantastic group of trainees.
I hope you enjoy reading this report as much as I enjoyed writing it. Frank, May 2006
Performance Modeling of Interactive Gaming – Table of contents
Table
of
contents
EXECUTIVE
SUMMARY...V
PREFACE...VII
TABLE
OF
CONTENTS ...IX
1
INTRODUCTION ... 11
1.1
P
ROBLEM DESCRIPTION... 11
1.2
O
VERVIEW... 12
2
TNO ... 13
2.1
TNO
I
NFORMATION ANDC
OMMUNICATIONT
ECHNOLOGY... 14
2.2
D
EPARTMENTP
LANNING,
P
ERFORMANCE&
Q
UALITY... 14
3
GAMING
OVERVIEW... 15
3.1
M
ULTIPLAYER GENRES... 15
3.2
I
NDUSTRY ANALYSIS... 16
4
PART
I:
GAMING
PERFORMANCE
MODEL... 19
4.1
I
NTRODUCTION... 19
4.2
T
RAFFICS
OURCE MODEL... 20
4.3
U
PSTREAM... 21
4.4
D
OWNSTREAM... 23
4.4.1
Delay distribution of batches ... 24
4.4.2
Delay distribution of packets... 29
4.5
T
OTAL DELAY... 30
4.6
R
ESULTS... 31
5
PART
II:
G
‐
MODEL... 37
5.1
I
NTRODUCTION... 37
5.2
R
ELATED WORK... 37
5.3
F
ACTORS THAT INFLUENCE THE PERCEIVED QUALITY OF GAMERS... 38
5.4
T
HE EXPERIMENT... 40
5.4.1
Setup ... 42
5.4.2
Questionnaires ... 43
5.5
R
ESULTS... 44
5.5.1
Factor analysis ... 44
5.5.2
Regression Analysis... 44
5.5.3
G‐model... 44
6
CONCLUSIONS
AND
RECOMMENDATIONS... 45
6.1
C
ONCLUSIONS... 45
6.2
R
ECOMMENDATIONS... 46
REFERENCES... 47
APPENDIX
A:
MATHCAD
CALCULATION
SHEETS ... 49
APPENDIX
B:
EXPERIMENT
SCENARIOS ... 52
Performance Modeling of Interactive Gaming ‐ Introduction
1
Introduction
Interactive gaming has taken an enormous flight since the Internet enabled gamers to play over a globally accessible network. According to a report on backbone traffic 6 popular games make up for three to four percent of the traffic already [7]. Such numbers are expected to keep rising dramatically; percentages of up to 25% of total backbone traffic have been predicted for the year 2008. A number of factors contribute to this explosive growth of online gaming, of which the ongoing penetration of broadband connections and the introduction of console platforms are only two [18]. Increasingly, gaming looks to be one of the mainstay applications that help to strengthen retention and loyalty of high‐speed Internet consumers. By providing a superior gaming experience that produces reliable performance, broadband operators can likely retain relationships for years with the next generations of customers [21].
1.1
Problem
description
In the past online gaming has been mainly approached from a marketing point of view. Relatively little time has been spent on scientific research. This is possibly a consequence of the best effort character of the Internet. This best effort approach appears to lose ground to a Quality of Service approach, similar to developments in the VoIP market. Large gaming service providers lack information on both gamers’ demands and estimations of delay times (often denoted as ping times). This type of information is crucial before deploying large‐scale real‐time services over the Internet.
The goal of this project is two‐fold:
To provide insight into the estimation of ping times and into the quality experience of gamers
Concerning the ping times the following questions will be answered:
• In what way does interfering voice traffic influence ping times of online gamers? • What is the influence of different network parameters on estimated ping times?
Regarding the quality experience the following issues will be addressed:
• Which factors are responsible for influencing the quality experience of online gamers? • What is the relation between the perceived quality of gamers and these factors?
• Can we identify a relation between an objective performance measure and these factors?
In order to provide the desired insights two models will be developed:
I
Gaming Performance Model
II
G‐model
The Gaming Performance Model is an extension to the queuing model described in [5]. The extension will be able to quantify the impact of VoIP traffic running over the same network.
The G‐model, analogous to the E‐model for VoIP [1, 15], will be designed to capture the user’s quality experience in a Mean Opinion Score.
Performance Modeling of Interactive Gaming ‐ Introduction
1.2
Overview
This report starts with a description of TNO and the department where this research was carried out (Chapter 2). Subsequently, an overview of the gaming industry will be given in Chapter 3. The heart of the report can be roughly divided into two sections:
In Chapter 4 the Gaming Performance Model is constructed which will follow a theoretical approach for assessing the delay performance of a typical interactive game. First the problem background will be discussed, including a description of the underlying traffic source model which describes the main traffic characteristics of modern First Person Shooters. The queuing model is divided into an upstream and downstream component. In Section 4.4 the two separate parts are combined to calculate the total delay in the queuing system. The chapter will be concluded with an overview of numerical results.
In Chapter 5 the previously mentioned G‐model is constructed. The chapter starts with an overview of existing literature on the subjective quality experience of gamers. In Section 5.3 the final set of experiment factors is discussed, before moving over to Section 5.4 which focuses on the gaming experiment setup. The results in Section 5.5 give an outline of the relations between the chosen network parameters and both the objective and subjective measures.
Chapter 6 reviews the most important results of this research project, along with a number of recommendations for future research.
Performance Modeling of Interactive Gaming – TNO
2
TNO
Mission statement:
TNO makes scientific knowledge applicable in order to strengthen the innovative capacity of business and
government [28]
Figure 1: TNO organization scheme
TNO is a knowledge organization for companies, government bodies and public organizations. The daily work of some 5,000 employees is to develop and apply knowledge. The company provides contract research and specialist consultancy as well as grant licenses for patents and specialist software. They test and certify products and services, and issue an independent evaluation of quality. And TNO sets up new companies to market innovations. The development and application of innovative knowledge: that is what TNO is all about.
Quality of Life Defense, Security and Safety Science and Industry Built Environ‐ ment and Geoscience
Wireline Corporate Mobile Public
• Broadband Access & Homenetworking (BAHN)
• E‐business and Information Technology (E‐IT)
• Planning, Performance & Quality (PPQ)
• Broadband and Voice Solutions (BVS)
Performance Modeling of Interactive Gaming – TNO
2.1
TNO
Information
and
Communication
Technology
TNO Information and Communication Technology is a unique centre of innovation in the Netherlands that unites the ICT and Telecom disciplines of TNO. TNO ICT helps companies, government bodies and (semi‐) public organizations to realize successful innovations in ICT. Value creation for clients is the priority, and the added value lies in the combination of innovative strength and in‐depth knowledge. The approach to innovation is integrated and practical. Research involves more than the technologies themselves. Where necessary, TNO ICT also focuses on user‐friendliness, financial aspects, and business processes. Carrying out technical and market trials support the implementation process. They are also specialists in innovation strategy and policy, and the extensive ICT expertise is a valuable resource that can be used to address issues in the wider community.
2.2
Department
Planning,
Performance
&
Quality
The focus of Planning, Performance & Quality is to optimize the balance between costs and quality of ICT networks and services. In this way customers are able to guarantee quality requirements in a cost effective way. The expertise includes the development and application of models centered on performance analysis and network planning. It is based on a unique combination of both theoretical and practical knowledge of operations research and ICT networks. Developed products enable the customer to visualize decisions concerning design, parameter tuning and operational strategies. As a result decision‐making is optimally supported. The department builds on a broad background of expertise which makes it possible to flexibly adapt to new technological developments within the market.
Performance Modeling of Interactive Gaming – Gaming overview
3
Gaming
overview
“Games are evolving to entertain, educate, and engage us individually. These personalized
games will reflect who we are and what we enjoy, much as our choice of books and music does
now. They will allow us to express ourselves, meet others, and create things that we can only
dimly imagine. They will enable us to share and combine these creations, to build vast
playgrounds. And more than ever, games will be a visible, external amplification of the human
imagination.” [31]
Computer games have been part of people’s lives for a fair amount of time now. Ever since Pong was released, many players around the world have enjoyed playing interactive games. Over time faster computers enabled game developers to enhance graphics and gameplay features. Many different games and gaming platforms (dedicated gaming consoles like Nintendo and Playstation, and multifunctional platforms like the Personal Computer and the Mac by Apple) were released over the years, but it was only until the nineteen nineties that the Internet enabled gamers to meet and play over a globally accessible network. Until that moment gamers were restricted to play against the computer or against friends at the same location (either on the same computer or over a Local Area Network). Clearly, this technological breakthrough opened up a whole new variety of options to both software‐ and hardware developers. Many different genres emerged within these interactive multiplayer games.
3.1
Multiplayer
genres
The large portion of popular multiplayer games can be categorized using one of the following labels [30]:
• First‐person shooter
A first‐person shooter (FPS) is a combat computer or video game genre in which the user has a first person perspective of a relatively small environment. The main objective is to kill other players as often as possible, although some popular modifications like Capture The Flag have different goals. Popular examples: Counter‐strike (Valve), Quake IV (ID Software), Battle Field 2 (EA)
• Real‐time strategy
A real‐time strategy (RTS) game is a type of computer strategy game which does not have ʺturnsʺ like conventional turn‐based strategy video or board games. Rather, game time progresses in ʺreal timeʺ: that is, it is continuous rather than turn‐by‐turn. (The word ʺstrategyʺ originally referred to war planning at the level of armies and squadrons instead of giving orders for individual units or persons).
Popular examples: Starcraft, Warcraft III (both Blizzard), Age of Empires III (Microsoft)
• MMORPG
Massively Multiplayer Online Role‐Playing Games (MMORPGs) follow a client‐server model in which players, running the client software, are represented in the game world by an avatar — a graphical representation of the character they play. Providers (usually the gameʹs publisher) host the persistent worlds these players inhabit. This interaction between a virtual world, always available for play, and an ever‐changing, world‐wide stream of players characterizes the Massively Multiplayer Online Role‐Playing Game.
Performance Modeling of Interactive Gaming – Gaming overview
• Browser games
Browser games are distinct from other video and computer games in the sense that they are normally platform independent, relying solely on client‐side technologies (normally called ʹappletsʹ or ʹplug‐insʹ). Usually all that is required to play browser games is an Internet connection, a web browser and the appropriate plug‐ins (normally available for free via the plug‐in makerʹs website). Popular examples: Online Pictionary, Chess
• Online gambling games
Online gambling games are the virtual variants of betting games which are usually played in a casino. Just like regular casino games, the online versions are centered on money and winning (in most cases) requires a certain amount of luck. The online casino is usually a web site which hosts the different chance games and provides deposit and withdrawal functionality.
Popular examples: Blackjack, Poker
Next to the previously mentioned multiplayer categories, a number of single player genres are becoming more and more popular in a multi‐user setting. Especially racing games like Need for Speed and sports games like FIFA Soccer are nowadays played on the Internet.
3.2
Industry
analysis
The (online) gaming industry is booming and expected to keep growing explosively the next couple of years. Let us take a look at some numbers [21]:
• In 2003, total industry revenues rose to a record $7 billion, making video games a bigger industry than the Hollywood movie business
• The online gaming market is expected to grow from about $600 million in 2003 to over $2 billion in revenues in 2007 (Figure 2)
• Today, about one third of new video games sold feature some sort of online component
Figure 2: Total worldwide revenues and data transfers for online gaming [24]
A number of factors can be attributed to explain for the continuing growth of the online industry [18]:
• Ongoing broadband penetration
The large scale adaptation of high‐speed Internet through Cable and DSL has a dramatic impact on the accessibility of online gaming. A high speed connection is a necessity for any gamer wanting to play over the Internet.
• Adoption of more robust wireless networks
Wireless next‐generation networks are rapidly being deployed around the world, thereby enabling gamers to engage in online combat through their last generation handheld (Nintendo DS or Sony
Performance Modeling of Interactive Gaming – Gaming overview
PSP) or mobile phone. Mobile gaming already is a huge success in Japan, where gaming is responsible for 15% of iMode revenue.
• Expansion of online activities by console platform manufacturers
Online gaming roughly started halfway the nineties with the PC game DOOM. It was only until 2002 that two major console manufacturers Sony (Playstation) and Microsoft (Xbox) entered the online market with the release of Internet adapters. Writing this, Nintendo’s Gamecube still lacks any decent support for online facilities. Trying to make up for this late introduction, the latest generation consoles from all three hardware manufacturers offer or promise (the Playstation 3 and Nintendo Revolution have not been released yet) extensive online capabilities (e.g., Xbox 360 with Xbox Live!).
• Legislation of online gambling
Online gambling is already legal in a big part of the world. It is also expected that countries with more conservative gambling policies will loosen their policies in the near future, because the missed revenue is too great to pass up. Online gambling enables people to enter (virtual) casinos without leaving their homes, thereby taking away barriers to engage in gambling activities. Especially poker has taken an enormous flight. Over $180m is being wagered in cash game pots in online poker every day (April 2005), in comparison to just $10m in 2003.
• Maturing of the consumer base
When talking about gamers, people tend to think of pimpled male teens. And for many years this image has correctly covered the dominant part of the gaming community. But the last couple of years the consumer base seems to be shifting towards a more mixed audience; young and old, including a growing number of female gamers, meeting each other on the Internet to play computer games in an interactive setting (see Figure 3). This shift is mainly brought about by the explosive growth of Internet gambling (especially poker), the rise of casual gaming [22] and the releases of several MMORPG monster hits like Blizzard’s ‘World of Warcraft’ and Sony’s ‘Everquest 2’. The MMORPG seems to attract a broader audience thanks to the creation of a virtual world in which gameplay is closely related to people’s daily routine, in comparison to classic multiplayer genres like FPS and RTS which are extremely combat oriented.
Figure 3: Age and gender of American gamers [27]
• Increasing media attention
The explosion of the industry’s popularity has not gone unnoticed. Internet journalists have written about the development of the industry since day one. But today also traditional media, like television and newspapers, are keeping a close look on what is going on in gaming land. Especially professional gaming events like the World Cyber Games [32] and The Cyberathlete Professional League[26]are getting a lot more coverage through traditional channels than before (e.g. [34]).
• The rise of the cyber‐athlete
Korea is seen by many as the cradle of professional gaming, with hundreds of Starcraft and Warcraft III players under contract by large gaming clans. Important matches including commentary are broadcasted on three national channels. Although nowhere near the celebrity status of Korean pro‐gamers, cyber‐athletes from the United States and Europe are getting their
Performance Modeling of Interactive Gaming – Gaming overview
share of media attention [34]. This media coverage attracts more sponsors and thereby boosts the expansion of Electronic‐sports in its turn. Following their Asian counterparts, gamers and other people from the community gather in national E‐sports associations and by doing so get recognition from authorities just like regular sport associations.
• In‐game advertising and Advergaming
While still on the outer edge of marketing budgets (games’ share in the overall advertising spending remained at a small 0.1%), in‐game advertising and advergaming is expected to grow to a billion dollar business by 2009 [29]. Advergaming can be described as the practice of using games to advertise or promote a product, organization or viewpoint. Both in‐game advertising and advergames are a natural and increasingly accepted evolution from print ads, T.V. ads, and banners, taking full advantage of the interactivity of the Internet and involving consumers in ways not possible with other media.
• Growing virtual economy
The virtual marketplace is a very popular Internet application for a number of years now. While tangible products are still by far the most traded items on online auction sites such as eBay, virtual products and services are becoming increasingly popular. It is today considered common practice that goods and services within virtual economies (mainly MMORPGs) are sold on online auction sites and are traded for real currencies. Since players of these games are willing to substitute real economic resources of time and money (monthly fees) in exchange for these resources, by definition they have demonstrated utility to the user. In fact the first cyber real estate agents are already running a profitable business in the virtual world of ‘Second Life’ [35].
Performance Modeling of Interactive Gaming – Part I: Gaming Performance Model
4
Part
I:
Gaming
Performance
Model
As explained earlier, the gaming performance queuing model is an extension to the model described in the paper [5] “Predicting Ping times in FPS games”. The original paper follows a theoretical approach for assessing the delay performance that could be attained under certain traffic assumptions. In this chapter we will use this same approach to predict ping times in FPS games, but in addition the impact of VoIP traffic will be included. Before starting with the mathematical modeling, let us give an overview of the problem background.
4.1
Introduction
Since the birth of the Internet years ago, a variety of services have been deployed over this globally accessible network. Originally, the majority of those consisted of data‐driven services, such as e‐mail and file‐sharing applications. However with the ongoing penetration of broadband Internet access real‐ time services like VoIP, video streaming and online gaming have become increasingly popular. Unfortunately there is no QoS guarantee in the current best effort Internet model; traffic stemming from interactive services is likely to mix with other traffic running over the Internet. In the worst case it interferes with data streams of TCP sources, which tend to increase their sending rate until a part of the network is congested. For that reason The Internet Engineering Task Force (IETF) has defined two different approaches to support Quality of Service in IP networks:
• Integrated Services (IntServ)
The idea of IntServ is that every router in the system implements IntServ, and every application that requires some kind of guarantees has to make an individual reservation. The problem with IntServ is that many states must be stored in each router. As a result, IntServ works on a small scale, but as it scales up to a system the size of the Internet, it is difficult to keep track of all of the reservations.
• Differentiated Services (DiffServ)
Instead of classification per‐flow, DiffServ classifies packets into classes, depending on the value of the codepoint in the packet’s IP header. DiffServ does not provide absolute guarantees, but instead each router acts on classes depending on a Per‐Hop Behavior.
But even when interactive and elastic services are segregated, different interactive services (each with their own delay requirements) may interfere in nodes of the network, leading to a possible violation of those requirements. The impact of running multiple real‐time traffic streams over the same network will be the main research subject of this chapter.
A number of different processes contribute to the end‐to‐end delay of an online gamer. These delay contributions can be divided into three different groups [9]:
• Delay caused by hardware and software that registers and processes user input
• Network delay introduced by sending gaming data (including user input) over the Internet
• Rendering delay introduced by hardware and software responsible for updating the virtual world (both client‐ and server side)
A recent study [12] indicates that most users attribute the large part of their gaming experience disruptions to network related problems. For that reason and the fact that the other two delays can be minimized by using PC configurations with last generation hardware, only the network delay will be discussed in this report. The network delay itself can be split into several components [9]:
Performance Modeling of Interactive Gaming – Part I: Gaming Performance Model
• Propagation delay • Packet processing delay • Serialization delay • Queuing delay
Of these components the first three delays are deterministic and relatively easy to assess. The queuing delay is harder to assess because of its stochastic nature. Studies in the past have shown that deterministic upper bounds can be obtained, but this worst‐case approach leads to unrealistically high delay values. Therefore delay quantiles will be derived, leading to more realistic values [5].
The choice of FPS games out of the large pool of multiplayer games is all but random. Various recent studies (e.g. [6]) have shown that within this genre of multiplayer games the quality experience of users is extremely sensitive to delay. In order to respect the strict delay requirements of these services, the generated data is transported over the UDP protocol. UDP does not adjust the speed of packets being sent onto the network, even when the network is congested. TCP will re‐send any dropped or corrupted packets, introducing jitter or variation in delay. This will reduce the quality of the game. Although the player would have perfect information, they would find that the game would pause whenever packets were lost as TCP tries to recover from the error.
4.2
Traffic
Source
model
The original Gaming Performance model is based on a traffic source model which describes the main traffic characteristics of modern FPS games. The traffic flows of a typical FPS are generated in the following way [5]: a central dedicated server keeps track of the global gaming state. At timer‐based intervals it sends a burst of packets containing this gaming state to the clients. The clients then receive and process these packets to update the view on the screen. Afterwards the client’s input is processed and an update packet is sent back over the network.
The traffic source model itself is based on a combination of papers published on the subject [3, 7] as well as research that was carried out by the authors of [5]. Earlier conducted traffic traces, discussed in the related work section of [5], have been approximated by a variety of distribution functions, including the shifted Weibull, the lognormal and the extreme distribution. It becomes clear that even within the FPS genre traffic characteristics can show large fluctuations. The traffic source model can be divided into two parts: the client traffic model (upstream direction) and the server traffic model (downstream direction). The characteristics of the traffic traces conducted by the authors of [5] are summarized below:
Client ‐> Server traffic
Mean CoV Distribution
Inter Arrival Time [ms] 30 0.65 Deterministic Packet Size [byte] 73 0.06 Deterministic
Server ‐> Client traffic
Mean CoV Distribution
(Burst) Inter Arrival Time [ms] 47 0.07 Deterministic Packet Size [byte] 154 0.28 ‐
Burst Size [byte] 1852 0.19 Erlang(K)
The above tables also include four distribution fits. These distributions are chosen by the authors of the original Gaming Performance Model and are based on both their own measurements as well as earlier fitted traffic data of various FPS games. The source model constructed in [5] is unique in the sense that the distribution functions of the server traffic model are fitted on tail behavior instead of the first two central moments. However, the limited size of their traffic measurements has to be taken into account.
Performance Modeling of Interactive Gaming – Part I: Gaming Performance Model
The authors have chosen to model the size of the bursts sent by the server with an Erlang distribution, with general K. The number of gamers appears to only affect the mean burst size; the CoV of the burst size is insensitive to the number of gamers. The choice of the Erlang distribution is not only a consequence of the tail fit but it also enables the authors to find a closed form expression for the waiting time distribution.
4.3
Upstream
The above traffic source model contains all the information needed to start with the construction of our mathematical model. Following the structure of this underlying traffic model, we have divided the model in an upstream and downstream component. The assumptions on inter‐arrival and service times will be the building blocks of our mathematical queuing model. Later in this chapter both separate parts will be merged again to arrive at the desired queuing model, which will enable us to calculate ping times. For now let us start with the upstream direction.
We are to analyze the situation in which two Constant Bit Rate streams interfere (Figure 4). The upstream queuing delay is the result of the competition of packets stemming from VoIP users and gamers on the link to the server. It may happen that a packet from a certain client arrives on that aggregation point at the instant a packet from another client is being transported over the link towards the server. As a result, a queue can temporary build up in that part of the network. We assume that on the long run fewer packets arrive than can be served (per time unit) and therefore this queue should regularly empty.
It is shown that we are really looking at the M/G/1 queue when the number of users grows large [4, 5]. So in order to calculate the upstream queuing delay it is possible to model the aggregation node as an M/D1+D2/1 queuing system instead of using the more complex N1*D1+N2*D2/D1+D2/1 system. Modeling
this aggregate as a Poisson process enables us to derive an upper bound for ping times, since the real arrival process will likely show a lot less variation. Empirical observations [16] indicate that this worst case approximation is very accurate when we are examining situations with relatively low loads. GAMERS VOIP VOIP SERVER UPSTREAM
Performance Modeling of Interactive Gaming – Part I: Gaming Performance Model
As stated in the introduction of this chapter, we have chosen to derive delay quantiles instead of deterministic upper bounds. This approach enables us to calculate more realistic delay values. In order to calculate these delay quantiles, let us define the moment generating function (mgf) of a random variable
d
as
D
(
s
)
=
Ee
sd. (0)In both [4] and [5] it is stated that the mgf of the delay in a M/G/1 queuing system can be approximated as follows
s
R
R
s
D
u−
+
−
≈
λ
λ
1
)
(
. (1) We use this approximation instead of the exact mgf of the waiting time distribution (which can be found in e.g. [11]), because it will later enable us to derive a closed form expression for the mgf of the total delay. In equation (1), λ refers to the dominant pole of the exact mgf of the waiting time distribution. Its value follows from solving the following equation
ρ
(
B
( )
λ
−
1
)
=
λ
B
'
(
0
)
, (2)
where
B(.)
denotes the mgf of the service time andρ
stands for the load. The load in a M/G/1 queue is defined as the mean arrival intensity multiplied by the mean service time [19]. Once λ is determined we can determine the last unknown parameterR
of equation (1) by evaluating equation (3)
( )
1
)
0
(
'
'
)
1
(
−
−
=
B
B
R
λ
ρ
ρ
. (3)Equations (1), (2), and (3) provide the framework for the approximation of the mgf of the delay in the upstream direction. However, we first need to describe the traffic characteristics of our uplink M/G/1 queuing system. We introduce the following parameter notation (Table 1).
Table 1: Upstream M/G/1 parameter notation
Gaming VoIP
No. Users
N
1N
2Mean IAT [ms]
D
1D
2Mean Service time [ms]
S
1S
2
Aggregation link rate [kbit/s]
R
u
Now let
P
1 andP
2 denote the fraction of packets with service timeS
1 andS
2.2 2 1 1 1 1 1
/
/
/
D
N
D
N
D
N
P
+
=
, 2 2 1 1 2 2 2/
/
/
D
N
D
N
D
N
P
+
=
. (4)To simplify calculations a scaling of the actual service times is applied.
S
1 andS
2 are expressed as multiples of the minimum service time in the entire system (including the service times in the downstream direction). The packet sizes of the two different packets are deterministic and thus because of the constant link speed the service times are deterministic as well. We therefore know that the mgf of the combined service time, its derivative and the derivative’s value ats
=0 are given by1 2 2 1
)
(
s
P
e
sSP
e
sSB
=
⋅+
⋅ , (5)Performance Modeling of Interactive Gaming – Part I: Gaming Performance Model 1 2 2 2 1 1
)
(
'
s
P
S
e
sSP
S
e
sSB
=
⋅+
⋅ , (6)B
'
(
0
)
=
P
1S
1+
P
2S
2. (7) The uplink load is determined by the formulau u
R
D
S
N
D
S
N
2 2 2 1 1 18
8
+
=
ρ
. (8)We use the notation
ρ
u for the uplink load (andρ
d for the downlink load in the next section) instead ofρ
. Equation (8) can be intuitively explained in the following way: the uplink load can be defined as the total bit rate generated by the voice and gaming traffic divided by the aggregation link rate. The sum in the numerator is multiplied by 8 because the link rateR
u in the denominator is expressed in bits persecond, while the packet sizes
S
1 andS
2 in the numerator are expressed in bytes.
We are now ready to determine the values of
λ
andR
by filling in and solving the equations (2) and (3)(
P
1e
1P
2e
21
)
(
P
1S
1P
2S
2)
S S u+
−
=
+
⋅ ⋅λ
ρ
λ λ . (9)1
)
1
(
2 2 1 1 2 2 1 1 1 2−
+
⋅
+
⋅
−
=
⋅ ⋅S
P
S
P
e
S
P
e
S
P
R
S S u u λ λρ
ρ
. (10)Once
λ
andR
are determined, the mgf of the upstream delay is approximated by equation (1) as stated earliers
R
R
s
D
u−
+
−
≈
λ
λ
1
)
(
. (11)4.4
Downstream
In this section we will derive an expression for the mgf of the downstream delay. Our mathematical model is again based on underlying traffic characteristics, which stem from the traffic source model of Section 4.2.
We observe that a tagged packet arriving in a batch of gaming packets experiences a delay
d
n,tcomposed of two contributions
d
n,t=
w
n+
p
n,t. (12)
First, the tagged packet has to wait for all the remaining work in the system the instant it arrived, which is equal to the delay
w
n the batch sees. Second, it has to wait a timep
n,t due to packets that arrived in thesame batch and that are in front of the tagged packet.
Let us define the moment generating functions
D(s)
andP(s)
for the steady state random variablesd
n,tand
p
n,t, respectively. Sincew
n andp
n,t are statistically independent, we get
D
d(
s
)
=
W
(
s
)
P
(
s
)
. (13)Performance Modeling of Interactive Gaming – Part I: Gaming Performance Model GAMERS VOIP VOIP SERVER DOWNSTREAM Figure 5: Downstream situation
4.4.1
Delay
distribution
of
batches
The gaming server sends batches of gaming packets back over the network at a constant rate. This rate is server‐side configurable in most modern First Person Shooters. Server administrators often pick values in the range of 25‐50 milliseconds. Low inter‐departure times result in a responsive, fluid experience for gamers, but at the cost of higher bandwidth usage. The batch sizes are modeled as i.i.d. random variables with an Erlang distribution of order
K
as marginal distribution. These batches interfere with small voice packets stemming from a certain number of VoIP users (Figure 5). The VoIP traffic is again modeled as a CBR stream and thus the resulting queuing can be described by the D+M/Ek+D/1 system,which falls in the category of G/G/1 queuing theory. Few explicit formulas are known for these systems; especially tail probabilities are hard to derive.
Simulation
In order to get the necessary insight into the behavior of the D+M/Ek+D/1 queue, we have implemented
a simulation model in the Matlab environment. During simulation we have used the following set of traffic parameter values (Table 2;
N
1 andN
2 are determined after we have chosen the load and the fraction VoIP).
Table 2: Traffic parameter values
Gaming VoIP
No. Users
N
1N
2Mean IAT [ms] 40 40 Mean Packet size [ms] 125 160
Aggregation link rate [kbit/s] 5000
Performance Modeling of Interactive Gaming – Part I: Gaming Performance Model
Simulation of the G/G/1 system shows some very interesting behavior. When we add VoIP users and simultaneously lower the number of Gamers (such that the downstream load stays the same), the 0.999 quantile of the one‐way delay increases instantly with only the slightest interference with VoIP traffic (Figure 6).
The global behavior of the system is similar for different values of the Erlang order
K
and the downlink loadρ
d. The magnitude of the observed ‘jump’ is however dependent on the two previously mentioned parameters; the jump is magnified for larger values ofK
, while an increasing load has a diminishing effect. The shape of the curve can be intuitively explained in the following way:
When the Fraction VoIP (∆) is zero, we are really looking at the D/Ek/1 queue and the simulation results
coincide with the analytical solution of this queue, as derived in [5].
When we add a little bit of VoIP traffic, ∆ becomes non‐zero and the large gaming bursts start to interfere with small voice packets with relatively high arrival intensities. The mean service time of a gaming burst is large compared to the mean inter‐arrival times of the voice packets, so during the regular service time of a gaming burst, many voice packets are being queued in the buffer. On the other hand very few gaming bursts are being queued, due to the small deterministic service times of the voice packets. Once the next gaming burst arrives, all voice packets have received service and consequently the burst finds the buffer empty most of the time.
Following the x axis of the graph, the traffic in the system consists of more and more VoIP traffic. The phenomenon described above becomes less dominant, because the mean size of the gaming bursts decreases (and therefore service times as well because of the constant link speed). Although mean inter‐ arrival times of voice packets decrease, less of those packets have to wait on gaming bursts because of this decrease in burst service times.
Eventually ∆reaches 1. This is the scenario in which traffic only consists of VoIP traffic. Following the reasoning of for example [4], this situation corresponds to the M/D/1 queue. Delay quantiles of this queue are well known and are similar to our simulation results.
0 5 10 15 20 25 30 35 40 45 50 0,00 0,10 0,20 0,30 0,40 0,50 0,60 0,70 0,80 0,90 1,00 Fr action V oIP O n e-w ay d e lay [m s] Simulation Figure 6: Simulation of G/G/1 delay quantiles
Performance Modeling of Interactive Gaming – Part I: Gaming Performance Model
M/G/1 approximation
Now let us start our queuing analysis with the assumption that the aggregate arrival process can be approximated with a Poisson process. This assumption enables us to derive the delay distribution of batches making use of the M/Ek+D/1 system, instead of the more complex D+M/Ek+D/1 system.
Modeling an aggregate as a Poisson process is again worst case and the accuracy of our assumption will become evident when we compare the results to our simulation.
Analog to the uplink queuing system, the downlink M/G/1 queuing system can be described using the parameter notation of Table 3.
Table 3: Downlink M/G/1 parameter notation
Gaming VoIP
No. Users
N
1N
2Mean IAT [ms]
D
1D
2Mean Service time [ms]
S
1S
2
Aggregation link rate
R
d
Let
P
1 andP
2 again denote the fraction of packets with service timeS
1 andS
2 2 2 1 1 1/
/
1
/
1
D
N
D
D
P
+
=
, 2 2 1 2 2 21
/
/
/
D
N
D
D
N
P
+
=
. (14)P
1 andP
2 are calculated in almost the same way as the fractions in the uplink direction, but they dodiffer in one important way. The difference lies in the fact that all the gaming packets are sent back over the network in one burst. Therefore, if we want to calculate the probability that a randomly arriving packet belongs to a certain class (either gaming or voice), we have to use 1 instead of
N
1 in both fraction formulas (14).S
1 andS
2 are again expressed as multiples of the minimum service time in the entire system (including the service times in the upstream direction).
From the traffic source model we know that the service times of the voice packets are deterministic while the service times of the gaming bursts can be described with an Erlang distribution. As a result the mgf of the combined service time, its derivative and the derivative’s value at
s
=0 are given by 2 2 1)
(
sS Ke
P
s
P
s
B
⎟⎟
+
⋅⎠
⎞
⎜⎜
⎝
⎛
−
=
β
β
, (15)(
)
1 2 2 2 1)
(
'
sS K Ke
S
P
s
K
P
s
B
++
⋅
⋅−
=
β
β
, (16)B
'
(
0
)
=
P
1K
+
P
2S
2β
. (17)In the above formulas
β
is defined as the Erlang orderK
divided by the mean service time of a gaming batch. Equations (2) and (3) again determine the unknown parameter values of our mgf approximation. However, for the downstream direction we introduce a slightly different notation. The downstream load is now denoted byρ
d and is determined (in similar fashion to the upstream situation) by the following equationPerformance Modeling of Interactive Gaming – Part I: Gaming Performance Model d d
R
D
S
N
D
S
N
2 2 2 1 1 18
8
+
=
ρ
. (18)The dominant pole
λ
in equation (2) is now calledγ
to avoid notation problems when we arrive at the derivation of the total delay. Its value follows from equation (19),
(
P
1P
2e
S21
)
(
P
1K
P
2S
2)
K d⎟⎟
+
−
=
+
⎠
⎞
⎜⎜
⎝
⎛
−
⋅β
γ
γ
β
β
ρ
γ . (19) Instead ofR
in the upstream direction, we now useC
in the downstream direction to refer to the last unknown parameter of our mgf approximation,
(
)
1
)
1
(
2 2 1 2 2 1 1 2−
+
⋅
+
−
−
=
⋅ +S
P
K
P
e
S
P
K
P
C
S K K d dβ
γ
β
β
ρ
ρ
γ . (20)Once
γ
andC
are determined, the mgf of the downstream burst delayW(s)
is approximated in the following way:s
C
C
s
W
−
+
−
≈
γ
γ
1
)
(
. (21)Let us compare the simulation of the original D+M/Ek+D/1 system with the M/G/1 approximation. 0 20 40 60 80 100 120 140 160 0,10 0,20 0,30 0,40 0,50 0,60 0,70 0,80 0,90 Fr action V oIP O n e-w ay d e lay [m s] Simulation M/E15+D/1 Figure 7: Comparison of M/E15+D/1 and simulated G/G/1 quantiles (K = 15, Load = 0.6)
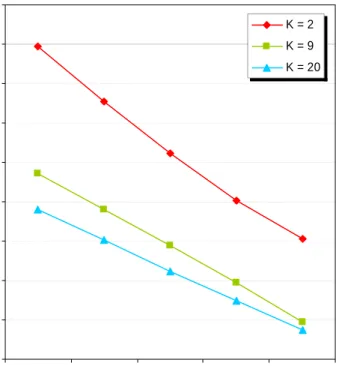
Performance Modeling of Interactive Gaming – Part I: Gaming Performance Model 0 20 40 60 80 100 120 0,1 0,2 0,3 0,4 0,5 0,6 0,7 0,8 0,9 Fr action V oIP O n e -w a y d e la y [ m s] Simulation M/E5+D/1 LINEST 0 50 100 150 200 250 300 0,1 0,2 0,3 0,4 0,5 0,6 0,7 0,8 0,9 Fraction V oIP O n e-w a y d e la y [ m s ] Simulation M/E20+D/1 LINEST Because we are really interested in the situation in which traffic consists of both voice and gaming packets, we will only consider fractions VoIP between 0.1 and 0.9. The traffic parameters are again determined by Table 2. Figure 7 clearly demonstrates that our approximation leads to unrealistically high delay quantiles. Therefore we have come up with a way to scale our M/G/1 results.
We have chosen to divide the M/G/1 delay quantiles by our simulated quantiles. Subsequently regression analysis was carried out on those quotients, based on the factors fraction VoIP, downlink load, and the Erlang order. All of our simulation results are based on the combinations of the following factor values (in combination with the traffic values summarized in Table 2):
• Fraction VoIP
∆
: 0.1 – 0.9 (steps of 0.1) • Dowlink loadρ
d: 0.4, 0.6, 0.8 • Erlang orderK
: 2, 9, 15
Ultimately we have chosen to use the built‐in Excel LINEST function, which is based on the Least Squares Method to calculate the line that best fits the quotients. Based on regression statistics provided by the same LINEST function we have chosen not to include an intercept, as the coefficient of determination
R
2(ratio of the explained variation to the total variation) of that model was considerably lower.
∆
−
+
=
=
/
/
1
5
.
792
0
.
115
K
3
.
172
Sim
G
M
S
ρ
d . (22)The above linear regression model has a coefficient of determination of 0.932, which means that 93.2% of the total variation in the quotients can be explained by regression equation (22). The t‐values of the factors
ρ
d,K,
and ∆ are, respectively, 17.841, 7.316, and ‐11.230. The critical t‐value, two tailed, with 87 degrees of freedom and Alpha = 0.05 is 2.447. We can therefore conclude that all three independent factors are statistically significant.
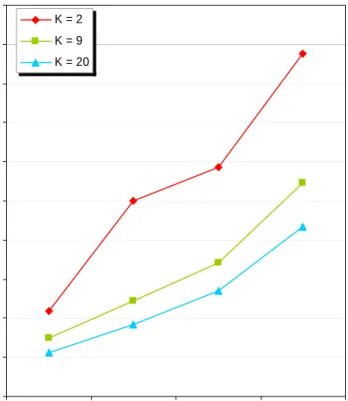
Now let us take a look at two test scenarios:
Figure 8: Test scenario 1 (K = 5, Load = 0.5) Figure 9: Test scenario 2 (K = 20, Load = 0.7)
When we use our regression model to scale M/G/1 quantiles of new scenarios and subsequently compare them to new simulated quantiles (which have not been used for fitting of the regression line),