By
Hildebrand Weisenborn
A Thesis submitted for the degree of Doctor of Philosophy School of Computer Science and Electronic Engineering
University of Essex October 2017
title “Information-centric networking for video delivery over existing and emerging ISP networks.”
A special thanks to my supervisor, Dr Martin Reed, and my family and friends who have supported me throughout my research.
72% of the total traffic, with over 883 PB of data per month in 2016 [1]. Large scale CDN solutions [2–5] are available that offer a variety of distributed hosting platforms for the purpose of transmitting video over IP. However, the Internet Protocol (IP) pro-tocol, unlike Information Centric Networking (ICN) protocol implementations, does not provide an any-cast architecture from which a CDN would greatly benefit. In this thesis we introduce a novel cache eviction strategy called “Bubble,” as well as two variants of Bubble, that can be applied to any-cast protocols to aid in optimising video delivery. Bubble, Bubble-LRU and Bubble-Insert were found to greatly reduce the quantity of video associated traffic observed in cache enabled networks. Additionally, analysis on two British Telecom (BT) provided video popularity distributions leveraging Kullback-Leibler and Pearson Chi-Squared testing methods was performed. This was done to assess which model, Zipf or Zipf-Mandelbrot, is best suited to replicate video popular-ity distributions and the results of these tests conclude that Zipf-Mandelbrot is the most appropriate model to replicate video popularity distributions. The work concludes that the novel cache eviction algorithms introduced in this thesis provide an efficient caching mechanism for future content delivery networks and that the modelled Zipf-Mandelbrot distribution is a better method for simulating the performance of caching algorithms.
List of Figures vi
List of Tables x
List of Acronyms xiii
1 Introduction to Thesis 1
1.1 Thesis Motivation and Contribution . . . 2
1.2 Thesis Outline . . . 5
2 Background Research 7 2.1 Video Delivery System Characteristics . . . 8
2.1.1 Video Segmentation in the context of caching . . . 8
2.1.2 Media and WWW Popularity Distributions . . . 11
2.1.3 Video Popularity Decay . . . 16
2.2 Any-cast protocols/systems . . . 18
2.2.1 ICN Implementations . . . 19
2.3 Cache Conscious Routing Strategies . . . 20
2.3.1 Cache Less for More (CL4M) . . . 20
2.3.2 Leave Copy Down (LCD) . . . 21
2.3.3 Probabilistic Caching (ProbCache) . . . 21
2.3.4 Leave Copy Everywhere (LCE) . . . 21
2.3.5 Hash-routing . . . 21
2.4 Cache Eviction Algorithms . . . 22
2.4.1 LRU . . . 22
2.4.2 LFU . . . 23
2.4.3 RANDOM . . . 23
2.4.4 FIFO . . . 23
2.4.5 Most Recently Used (MRU) . . . 23
2.5 Icarus (ICN Simulator) . . . 24
2.6 Conclusions and Scope . . . 24
3 Video Popularity Distribution Analysis 26 3.1 Introduction . . . 27
3.2 Video Popularity Metrics . . . 28
3.2.1 Existing Popularity Distribution Models . . . 29
3.2.2 Candidate Models for Popularity . . . 30
3.2.3 Fitting Models and Problem Description . . . 31
3.2.4 Cache Miss Error Ratio Calculation using Kullback-Leibler (KL) 36 3.3 Application in Video Delivery Systems . . . 39
3.4 Tests and Evaluation . . . 40
3.4.1 Empirical Data . . . 40
3.4.2 Finding Resembling Zipf & Zipf-Mandelbrot Distributions . . . . 41
3.4.3 Network Caching Simulation Environment (Icarus) . . . 54
3.4.4 Conclusion . . . 64
4 Video On Demand (VoD) Request Simulation Environment 65 4.1 Introduction & Motivation . . . 66
4.2 Breakdown of parameters . . . 67
4.2.1 Parameters included . . . 67
4.2.2 Parameters not considered . . . 72
4.3 Simulator Breakdown . . . 73
4.3.1 Storyboard Generation . . . 74
4.4 Request Generation . . . 79
4.5 Conclusion . . . 81
5 Bubble Cache Eviction Algorithm 83 5.1 Abstract . . . 83
5.2 Introduction . . . 84
5.3 Known Algorithms . . . 84
5.3.1 Least Recently Used (LRU) . . . 84
5.3.2 First-in First-out (FIFO) . . . 86
5.3.3 Least Frequently Used (LFU) . . . 86
5.4 Bubble Eviction Algorithm . . . 88
5.4.1 Motivation . . . 88
5.4.2 Solution . . . 88
5.5 Variations of Bubble . . . 90
5.5.1 Bubble-Insert . . . 90
5.5.2 Bubble-LRU . . . 91
5.6 Introduction to the analytical and simulation techniques . . . 93
5.6.1 Markov Chain Analysis . . . 94
5.6.2 Icarus - ICN Simulation Environment . . . 105
5.6.3 Single Cache Bubble Analysis . . . 107
5.7 Analytical and Simulation Results of Bubble & Variations . . . 108
5.7.1 Markov Chain Analysis tests . . . 110
5.7.2 Icarus Simulations . . . 120
5.7.3 Complex Request Single Cache Analysis . . . 137
5.7.4 Exploration of Insertion Index . . . 154
5.8 Conclusion Bubble Eviction Algorithm . . . 157
6 Conclusion 161 6.1 Motivation for work . . . 162
6.2 Summary . . . 162
6.3 Conclusions . . . 163
6.4 Future Work . . . 166
A Supplementary Evaluations and Results 169 A.1 Markov-Chain Empirical Analysis Results - Bubble-LRU & Bubble-Insert 169
2.1 Segmentation of a video according to the Pyramid segmentation regimen 9 2.2 Segmentation of a video according to the Skyscraper segmentation regimen 10
2.3 Zipf a = 1. Zipf Law Applied to Web Documents . . . 12
2.4 Miss rate for a Zipf-based synthetic workload and for an actual trace . . 12
2.5 Zipf = 0.66 ˜0.83 Web Caching and Zipf-like Distributions: Evidence and Implications . . . 13
2.6 Zipf a=1, Characteristics of WWW client-based traces . . . 13
2.7 The Rank vs Rating of videos in the Netflix system pre-2006 . . . 14
2.8 UGC video request data. Views vs. Video Rank . . . 15
3.1 Model for performing the Pearson Chi-Squared Testing for deciding a superior fitting Model and permutation of Model. . . 34
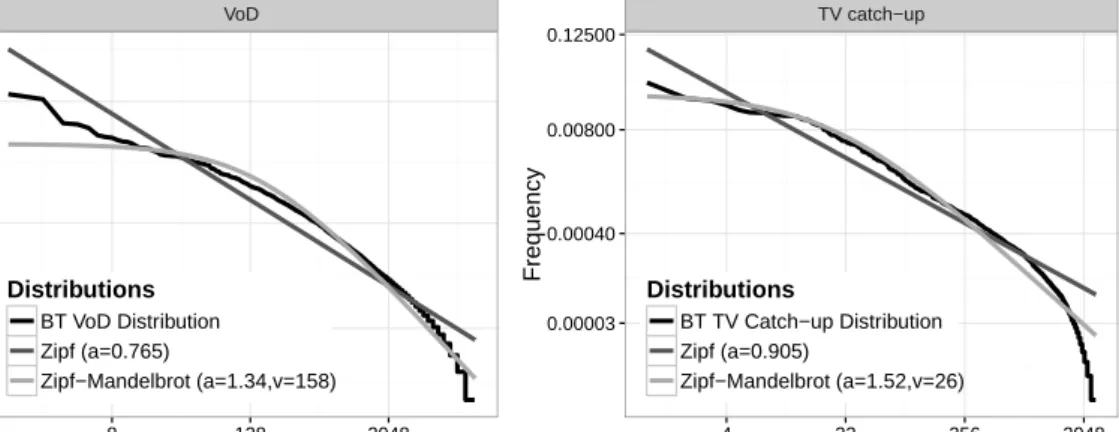
3.2 Pearson Chi-Squared (PCS) Fitting results Popularity Distributions Zipf, Zipf-Mandalbrot and VoD Empirical Data-sets . . . 42
3.3 PCS Fitting results Popularity Distributions Zipf, Zipf-Mandalbrot and TV catch-up Empirical Data-sets . . . 42
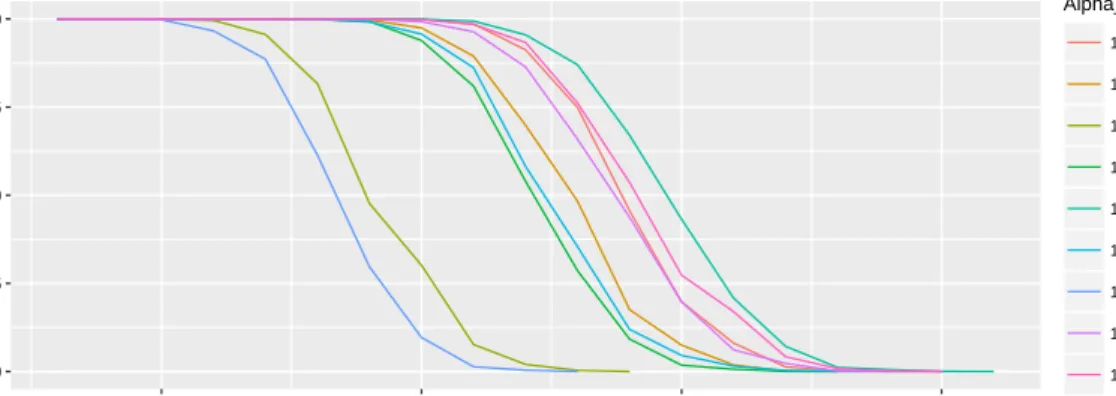
3.4 P values as occurrences increase | TV catch-up data-set (the parameter named “Variable” in this figure is a place-holder forν) . . . 44
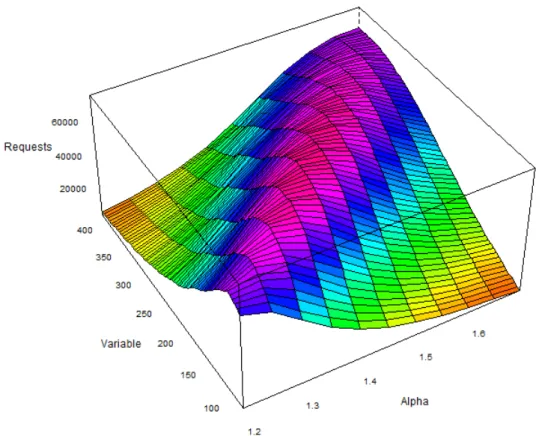
3.5 Fitting TV Catch-up to Zipf using Pearson Chi-Squared. Each point represents the point at which the p-value returned by the Pearson Chi-Squared fell below 0.05 as requests increased. . . 45
3.6 Fitting TV Catch-up to the Zipf-Mandelbrot model using Pearson Chi-Squared. Each point represents the point at which the p-value returned by the Pearson Chi-Squared fell below 0.05 as requests increased. (the parameter named “Variable” in this figure is a place-holder for ν) . . . . 45
3.7 Fitting VoD to Zipf using Pearson Chi-Squared. Each point represents the point at which the p-value returned by the Pearson Chi-Squared fell below 0.05 as requests increased. . . 46
3.8 Fitting VoD to the Zipf-Mandelbrot model using Pearson Chi-Squared. Each point represents the point at which the p-value returned by the Pearson Chi-Squared fell below 0.05 as requests increased. (the parameter named “Variable” in this figure is a place-holder forν) . . . 46
3.9 KL Fitting results including: Popularity Distributions Zipf, Zipf-Mandalbrot and VoD Empirical Data-sets . . . 47
3.10 KL Fitting results including: Popularity Distributions Zipf, Zipf-Mandalbrot and TV catch-up Empirical Data-sets . . . 47
3.11 Fitting results for TV Catch-up to Zipf using Kullback-Leibler. The KullBack-Leibler value is plotted for when Θ and Φ were directly com-pared using a varyingα variable. . . 48
3.12 Fitting results for VoD to Zipf using Kullback-Leibler. The KullBack-Leibler value is plotted for when Θ and Φ were directly compared using a varying α variable. . . 48 3.13 Fitting results for TV Catch-up to Zipf-Mandelbrot using Kullback-Leibler.
The KullBack-Leibler value is plotted for when Θ and Φ were directly compared using varyingα and ν variables (the parameter named “Vari-able” in this figure is a place-holder forν). . . 49 3.14 Fitting results for VoD to Zipf-Mandelbrot using Kullback-Leibler. The
KullBack-Leibler value is plotted for when Θ and Φ were directly com-pared using varying αand ν variables (the parameter named “Variable” in this figure is a place-holder for ν). . . 49 3.15 Q - Q plot including: contrasts Popularity Distributions Zipf, Zipf-Mandalbrot
vs. TV catch-up Empirical Data-set . . . 51 3.16 Q - Q plot including: contrasts Popularity Distributions Zipf, Zipf-Mandalbrot
vs. VoD Empirical Data-set . . . 51 3.17 Icarus: Average Cache Hit Ratio for the BT TV dataset and the KL
determined, closely matched, Zipf and Zipf-Mandelbrot distributions . . 57 3.18 Icarus: Average Cache Hit Ratio for the BT VoD dataset and the KL
determined, closely matched, Zipf and Zipf-Mandelbrot distributions . . 57 3.19 Icarus: Average Latency for the BT TV dataset and the KL determined,
closely matched, Zipf and Zipf-Mandelbrot distributions . . . 57 3.20 Icarus: Average Latency for the BT VoD dataset and the KL determined,
closely matched, Zipf and Zipf-Mandelbrot distributions . . . 57 3.21 Icarus: Average Path Stretch results for the BT TV dataset and the KL
determined, closely matched, Zipf and Zipf-Mandelbrot distributions . . 57 3.22 Icarus: Average Path Stretch results for the BT VoD dataset and the KL
determined, closely matched, Zipf and Zipf-Mandelbrot distributions . . 57 3.23 Icarus: Average Cache Hit Ratio for the BT TV dataset and the PCS
determined, closely matched, Zipf and Zipf-Mandelbrot distributions . . 61 3.24 Icarus: Average Cache Hit Ratio for the BT VoD dataset and the PCS
determined, closely matched, Zipf and Zipf-Mandelbrot distributions . . 61 3.25 Icarus: Average Latency for the BT TV dataset and the PCS determined,
closely matched, Zipf and Zipf-Mandelbrot distributions . . . 61 3.26 Icarus: Average Latency for the BT VoD dataset and the PCS
deter-mined, closely matched, Zipf and Zipf-Mandelbrot distributions . . . 61 3.27 Icarus: Average Path Stretch results for the BT TV dataset and the PCS
determined, closely matched, Zipf and Zipf-Mandelbrot distributions . . 61 3.28 Icarus: Average Path Stretch results for the BT VoD dataset and the
PCS determined, closely matched, Zipf and Zipf-Mandelbrot distributions 61 4.1 Single YouTube Video demonstrating decay over the duration of a month
observed on 10/04/2017 with a total view count of 2,511,009. The ob-servation and screen capture was made by Hildebrand Weisenborn, the author of this Thesis . . . 71 4.2 Total Probability of items when they are introduced into the system over
4.3 Probability of items at single ∆t(Current & Total) — The Index refers
to the same items in terms on Current and Total probability. . . 78
4.4 Probability of items at single ∆t(Current & Total) — The index for the Current & Total probabilities are not referring to the same items. . . 78
4.5 Probability of items at intervals of 15 ∆t. Observations were made 4 times accounting for each Period as shown in the legend. . . 80
4.6 Probability of items at intervals of 6 ∆t. Observations were made 10 times accounting for each Period as shown in the legend. . . 81
5.1 Bubble & Bubble Variation Algorithms Diagrams . . . 89
5.2 Bubble Algorithm Flow Chart . . . 90
5.3 Bubble-Insert Algorithm Flow Chart . . . 91
5.4 Bubble-LRU Algorithm Flow Chart . . . 93
5.5 Insertion Points - Markov-Chain - Cache Size: 10 . . . 112
5.6 Insertion Points - Markov-Chain - Cache Size: 10 . . . 114
5.7 Cache-Hit Ration for each Cache Eviction Algorithm. Each Figure Dis-plays the results for a different Pseudo-Realistic Video Request Distribution116 5.8 Cache-Hit Ration for each Cache Eviction Algorithm. Each Figure Dis-plays the results for a different Zipf Video Request Distribution . . . 118
5.9 Each Figure Displays the results for a different Zipf-Mandelbrot Video Request Distribution . . . 119
5.10 Insertion Points - Icarus - Unique Item Count: 11000 - Cache Size: 5635 124 5.11 Insertion Points - Icarus - Unique Item Count: 2500 - Cache Size: 1280 124 5.12 Cache-Hit Ration for each Cache Eviction Algorithm. Each Figure Dis-plays the results for a different Pseudo-Realistic Video Request Distribu-tion (unique items: 2500) . . . 126
5.13 Cache-Hit Ration for each Cache Eviction Algorithm. Each Figure Dis-plays the results for a different Pseudo-Realistic Video Request Distribu-tion (unique items: 11000) . . . 127
5.14 Cache-Hit Ration for each Cache Eviction Algorithm. Each Figure Dis-plays the results for a different Zipf Video Request Distribution (unique items: 2500) . . . 130
5.15 Cache-Hit Ration for each Cache Eviction Algorithm. Each Figure Dis-plays the results for a different Zipf Video Request Distribution (unique items: 11000) . . . 131
5.16 Each Figure Displays the results for a different Zipf-Mandelbrot Video Request Distribution (unique items: 2500) . . . 134
5.17 Each Figure Displays the results for a different Zipf-Mandelbrot Video Request Distribution (unique items: 11000) . . . 135
5.18 Insertion Points - Complex Request Single Cache Analysis - Cache Size: 352 — M = 11000 . . . 142
5.19 Insertion Points - Complex Request Single Cache Analysis - Cache Size: 2500 — M = 2500 . . . 143
5.20 Cache-Hit Ration for each Cache Eviction Algorithm. Each Figure Dis-plays the results for a different Pseudo-Realistic Video Request Distri-bution in a Complex Request Single Cache Analysis environment — M = 11000 . . . 144
5.21 Cache-Hit Ration for each Cache Eviction Algorithm. Each Figure Dis-plays the results for a different Pseudo-Realistic Video Request Distribu-tion in a Complex Request Single Cache Analysis environment —M = 2500144 5.22 Cache-Hit Ration for each Cache Eviction Algorithm. Each Figure
Dis-plays the results for a different Zipf Video Request Distribution in a
Complex Request Single Cache Analysis environment — M = 11000 . . 149
5.23 Cache-Hit Ration for each Cache Eviction Algorithm. Each Figure Dis-plays the results for a different Zipf Video Request Distribution in a Complex Request Single Cache Analysis environment — M = 2500 . . . 149
5.24 Cache-Hit Ration for each Cache Eviction Algorithm. Each Figure Dis-plays the results for a different Zipf-Mandelbrot Video Request Distri-bution in a Complex Request Single Cache Analysis environment — M = 11000 . . . 152
5.25 Cache-Hit Ration for each Cache Eviction Algorithm. Each Figure Dis-plays the results for a different Zipf-Mandelbrot Video Request Distribu-tion in a Complex Request Single Cache Analysis environment —M = 2500152 5.26 . . . 155
5.27 . . . 156
5.28 . . . 156
2.1 Results gathered by Avramova et al. The results are approximated from the graphs in the publication which can be factored in to the simulator . 18 3.1 Published statistics from VoD and UGC systems + BT provided statistics 29 3.2 Pearson Chi-Squared optimised result correlation between Zipf-like &
Zipf-Mandelbrot . . . 44 3.3 Kullback-Leiber optimised result correlation between like &
Zipf-Mandelbrot . . . 50 3.4 TV Catch-up Pearson Correlation Coefficient (PCC) comparison between
Zipf-like & Zipf-Mandelbrot . . . 52 3.5 VoD PCC comparison between Zipf-like & Zipf-Mandelbrot . . . 53 3.6 Difference between Cache-Hit Ratios relative to Empirical Results in
test where Zipf and Zipf-Mandelbrot models were selected based on a “goodness-of-fit” produced in KL . . . 59 3.7 Difference between Cache-Hit Ratios relative to Empirical Results in
test where Zipf and Zipf-Mandelbrot models were selected based on a “goodness-of-fit” produced in PCS . . . 62 3.8 Total Average Difference between Cache-Hit Ratios relative to Empirical
Results in test where Zipf and Zipf-Mandelbrot models were selected based on a 11goodness-of-fit” produced in PCS and KL matching processes 64 4.1 Results gathered by Avramova et al. The results are approximated from
the graphs in the publication which can be factored in to the simulator . 70 4.2 User supplied data for generating sudo-realistic requests . . . 75 4.3 Storyboard for generating sudo-realistic requests . . . 76 4.4 Observations for every 15 ∆tmatched to a Zipf / Zipf-Mandelbrot
Dis-tribution using Kullback-Leibler divergence as the method of matching . 81 4.5 Observations for every 6 ∆tmatched to a Zipf / Zipf-Mandelbrot
Distri-bution using Kullback-Leibler divergence as the method of matching . . 81 5.1 Bubble Algorithm Example Sequence . . . 90 5.2 Zipf-Mandelbrot correlated to Zipf(a=0.8) with a range of alpha values
with fitted ν values confirmed with Kullback-Leiber divergence . . . 110 5.3 Insertion Points of Bubble-LRU with the highest Cache-Hit Ratios . . . 111 5.4 Insertion Points of Bubble-Insert with the highest Cache-Hit Ratios . . 112 5.5 Insertion Points of Bubble-LRU with the highest Cache-Hit Ratios . . . 113 5.6 Insertion Points of Bubble-Insert with the highest Cache-Hit Ratios . . 113 5.7 Insertion Points of Bubble-LRU with the highest Cache-Hit Ratios (Unique
Item Count: 11000) . . . 123
5.8 Insertion Points of Bubble-Insert with the highest Cache-Hit Ratios (Unique Item Count: 11000) . . . 123 5.9 Insertion Points of Bubble-LRU with the highest Cache-Hit Ratios (Unique
Item Count: 2500) . . . 125 5.10 Insertion Points of Bubble-Insert with the highest Cache-Hit Ratios (Unique
Item Count: 2500) . . . 125 5.11 Mean difference of the cache-hit ratios between Bubble and other Cache
Eviction Algorithms (Unique Item Count: 11000) . . . 127 5.12 Mean difference of the cache-hit ratios between Bubble-Insert and other
Cache Eviction Algorithms (Unique Item Count: 11000) . . . 128 5.13 Mean difference of the cache-hit ratios between Bubble-LRU and other
Cache Eviction Algorithms (Unique Item Count: 11000) . . . 129 5.14 Mean difference of the cache-hit ratios between Bubble and other Cache
Eviction Algorithms in the scenario of a Zipf Popularity Distribution (Unique Item Count: 11000) . . . 131 5.15 Mean difference of the cache-hit ratios between Bubble-LRU and other
Cache Eviction Algorithms in the scenario of a Zipf Popularity Distribu-tion (Unique Item Count: 11000) . . . 132 5.16 Mean difference of the cache-hit ratios between Bubble-Insert and other
Cache Eviction Algorithms in the scenario of a Zipf Popularity Distribu-tion (Unique Item Count: 11000) . . . 133 5.17 Mean difference of the cache-hit ratios between Bubble and other Cache
Eviction Algorithms in the scenario of a Zipf Popularity Distribution (Unique Item Count: 11000) . . . 135 5.18 Mean difference of the cache-hit ratios between Bubble-LRU and other
Cache Eviction Algorithms in the scenario of a Zipf Popularity Distribu-tion (Unique Item Count: 11000) . . . 136 5.19 Mean difference of the cache-hit ratios between Bubble-Insert and other
Cache Eviction Algorithms in the scenario of a Zipf Popularity Distribu-tion (Unique Item Count: 11000) . . . 136 5.20 Insertion Points of Bubble-LRU with the highest Cache-Hit Ratios . . . 140 5.21 Insertion Points of Bubble-Insert with the highest Cache-Hit Ratios . . 140 5.22 Insertion Points of Bubble-LRU with the highest Cache-Hit Ratios . . . 141 5.23 Insertion Points of Bubble-Insert with the highest Cache-Hit Ratios . . 141 5.24 Mean difference of the cache-hit ratios between Bubble and other Cache
Eviction Algorithms in the scenario of a pseudo-realistic Popularity Dis-tribution (Unique Item Count: 2500) . . . 145 5.25 Mean difference of the cache-hit ratios between BubbleLRU and other
Cache Eviction Algorithms in the scenario of a pseudo-realistic Popularity Distribution (Unique Item Count: 2500) . . . 147 5.26 Mean difference of the cache-hit ratios between BubbleInsert and other
Cache Eviction Algorithms in the scenario of a pseudo-realistic Popularity Distribution (Unique Item Count: 2500) . . . 147 5.27 Mean difference of the cache-hit ratios between Bubble and other Cache
Eviction Algorithms in the scenario of a Zipf Popularity Distribution (Unique Item Count: 2500) . . . 150
5.28 Mean difference of the cache-hit ratios between BubbleLRU and other Cache Eviction Algorithms in the scenario of a Zipf Popularity Distribu-tion (Unique Item Count: 2500) . . . 150 5.29 Mean difference of the cache-hit ratios between BubbleInsert and other
Cache Eviction Algorithms in the scenario of a Zipf Popularity Distribu-tion (Unique Item Count: 2500) . . . 151 5.30 Mean difference of the cache-hit ratios between Bubble and other Cache
Eviction Algorithms in the scenario of a Zipf-Mandelbrot Popularity Dis-tribution (Unique Item Count: 2500) . . . 153 5.31 Mean deviation between BubbleLRU and other Cache Eviction
Algo-rithms in the scenario of a Zipf-Mandelbrot Popularity Distribution (Unique Item Count: 2500) . . . 153 5.32 Mean difference of the cache-hit ratios between BubbleInsert and other
Cache Eviction Algorithms in the scenario of a Zipf-Mandelbrot Popu-larity Distribution (Unique Item Count: 2500) . . . 154 6.1 Difference between Cache-Hit Ratios relative to Empirical Results in
test where Zipf and Zipf-Mandelbrot models were selected based on a goodness-of-fit produced in KL — This table is a reduced replicate of Table 3.6 . . . 164 A.1 The All Cache Eviction Algorithm Markov-Chain Cache-Hit Ration
re-sults for Zipf scenario rere-sults . . . 170 A.2 The All Cache Eviction Algorithm Markov-Chain Cache-Hit Ration
re-sults for pseudo-real scenario rere-sults . . . 171 A.3 The All Cache Eviction Algorithm Markov-Chain Cache-Hit Ration
IP Internet Protocol P2P Peer-to-Peer
CDN Content Delivery Network WWW World Wide Web VoD Video On Demand
ICN Information Centric Networking CCN Content Centric Networking NDN Networking Named Content
DONA Data-Orientated Network Architecture PURSUIT Publish-Subscribe Internet Technology PSIRP Publish-Subscribe Internet Routing Paradigm LCE Leave Copy Everywhere
SAIL Scalable & Adaptive Internet soLutions
COMET COntent Mediator architecture for content-aware nETworks RAND Random
LRU Least Recently Used FIFO First-in First-out LFU Least Frequently Used
LFUDA Least Frequently Used with Dynamic Aging Perfect-LFU Perfect Least Frequently Used
VoDu VoD-time-unlimited UGC User Generated Content BT British Telecom
SLA Service Level Agreement KL Kullback-Leibler
PCS Pearson Chi-Squared
PCC Pearson Correlation Coefficient PDF Probability Density Function BU Boston University
HTML Hypertext Markup Language DDoS Distributed Denial of Service CDF Cumulative Distribution Function OSI Open Systems Interconnection
PSIRP Publish-Subscribe Internet Routing Paradigm BF Bloom Filters
URL Uniform Resource Locator PhD Philosophiae Doctor DNS Domain Name System
TCP Transmission Control Protocol UDP User Datagram Protocol
1
Introduction to Thesis
Video On Demand is vastly expansive and makes up a large quantity of the total traffic on the internet. Global IP video traffic is predicted to constitute 82% of all consumer internet traffic by 2020, up from 70% in 2015 [6] and 72% in 2016 which equates to approximately 883 PB per month [1]. As Video on Demand becomes increasingly more prevalent the research community has sought ways to alleviate the strain video request and data delivery has on a network. To contribute to this effort, a great understanding of Video request data is required, as well as strategies as to how one may achieve alleviation of strain of video data on a network.
1.1
Thesis Motivation and Contribution
As previously stated in the introduction of this Chapter, Video has become a dominant source of traffic on the Internet. This Thesis aims to provide analysis of video request data, as well as introduce methods one can use to achieve a reduction in video traffic on a network without penalties to performance or quality, using technologies that leverage caching in nodal computer networks.
Video Request Data is complex and intricate and is responsible for a tremendous amount of strain on most consumer-facing network infrastructures. If a naive perspec-tive were to be presented, the total amount of requests made to a Video Distribution Platform can be equated and used to assess how many video objects are delivered to users from a Video Delivery System. This approach appears to be the most intuitive method of observing video traffic. However, it does not include important details such as segmentation, the distributed Content Delivery Network (CDN) servers, and the routing that occurs to ensure that the video data reaches the distributed users. Observations of video popularity distributions [7–18] are typically made over time and then concluded to be such. This means that the items measured are frequently introduced before the observations start or remain to receive requests after the observations end, meaning that data is often incomplete. Although not all these errors in observation are addressed and tackled with structurally better observations in this Thesis due to a limited dataset, a new video request generator is proposed in an effort to encompass and overcome ob-served shortcomings in other simulation environments and obob-served data-sets that are available today, which bear the constraints that those who came before were subjected to during development. The request generator provides a request generation platform that accounts for changing popularity in items over time with the introduction of decay and a changing data-set over time that retires items and introduces new ones.
items observed in the system. This popularity distribution has caused discussion in the research community [14] largely due to the lack of data currently available to researchers. Additionally, the methods of analysing video request distributions appear overly sim-plified, often using a see-by-eye test to describe two sets of data, one generated and one observed, side-by-side to be similar enough to consider them approximately equal. In this Thesis, two individual VoD data-sets provided by British Telecom (BT), the sponsor of this Philosophiae Doctor (PhD) and Thesis, aid to help us discover which popularity distribution suggested in the research community shares the greatest resemblance to real video request data. A number of different analytical tests and simulations were performed to rule out bias as to what generated popularity distribution best matches the video request data of a real VoD platform. The tests used were a combination of Pearson Chi-Squared, Pearson Correlation Coefficient and Kullback-Leibler which indi-vidually provided a method to confirm what model was more appropriate in replicating an existing data-set. The models considered as appropriate replications models for the BT data-sets were the Zipf-Mandelbrot model and the Zipf-Like model. To conclude, Zipf-Mandelbrot was demonstrated to be more appropriate for modelling a video re-quest distribution such as the observed video rere-quest distributions provided by BT.
The technologies used to currently distribute video content are large scale CDNs. Websites such as YouTube [19], owned by Google, house their own CDN infrastructure however most VoD providers use CDN services offered by companies such as Akamai [3], Cloud Flare [4] and Microsoft Azure [5]. These providers deliver content to consumers in a quick and secure manner by delivering data from a server local to the user. A CDN provider, such as Microsoft Azure, outsources traffic managing to a Traffic Manager to assure a server that is local to the user, responds to the user request. Other services may distribute their servers and hand off the forwarding of requests to a local server to Domain Name System (DNS), forwarding [2] solutions implemented by companies such as Microsoft. Akamai handles load balancing by using a combination of application layer awareness and DNS forwarding. All these methods are used to ensure users are
served data locally to their own physical location, a challenge not handled by the clas-sic IP infrastructure, but by the application layer and network layer in the case of the Akamai infrastructure and their Modern Load Balancing examples. This innovation in load balancing and traffic management demonstrated in Azure and Akamai, addition-ally demonstrates the constraints inherent to the current infrastructure of the Internet. Many of the mentioned constraints of distributed servers providing the same content in different geo-locations can be solved with modern alternatives to IP and Transmission Control Protocol (TCP)/User Datagram Protocol (UDP) with an any-cast architecture such as ICN. These architectures are introduced and discussed in the Thesis and, ad-ditionally enable the possibility of seamless distributed networks and enable caching functionality.
Caching is often suggested as a method of reducing traffic associated with frequently requested objects on a network, as well as frequently performed operations in a pro-cessor. It also helps alleviate the amount of operations required and optimises the performance of many hardware and software infrastructures. Caching can also be lever-aged specifically to alleviate a network of a large quantity of traffic when applied to video delivery, as video request data exhibits repetitive behaviours as the frequency of requests for items is often heavily skewed, majoritively only towards a small subset of items [9, 10, 12], favouring local storage as being able to cache frequently requested ob-jects. This Thesis introduces cache eviction algorithms that can be applied to a cache enabled network. The eviction algorithms are a method of caching that operate with no knowledge of the network and its state, but rather operate in an inexpensive manner that, in some scenarios, rivals the more well known cache eviction algorithms; namely LRU and LFU.
The algorithm introduced in this Thesis is the Bubble cache eviction algorithm. A patent application was submitted by BT and later rejected on the premise that prior art [20] was found to contain a switching mechanism similar to the mechanism used in
the Bubble algorithm. The creating and submitting of the patent application to the European Patent Office took upwards of a year, thus delaying the option to submit a publication introducing the Bubble algorithm to the wider research community.
1.2
Thesis Outline
This Thesis is structured in the manner one may assume to follow when aiming to improve video delivery over a cache enabled network.
Chapter 2 introduces technologies and methods associated with caching and video delivery systems. A number of different aspects of video delivery will be explored such as; the year of observation, user counts, requests per day, requests per user, locations of observation and the number of unique videos; all within diverse VoD systems. Iden-tifying these characteristics as well as other areas of research that impact local caching and the technologies associated with such systems will also be explored here.
Chapter 3 addresses the shortage in evaluation of video-focused consumption mod-els. While there has been conjecture that Zipf-Mandelbrot is a good model, this work shows, through empirical data, that consumption patterns do indeed comply to this distribution. This is achieved by analysing two example, large-scale, empirical datasets, provided by BT, as well as using synthetically generated consumption data, following Zipf and Zipf-Mandelbrot distributions. These models include standard testing meth-ods such as; Pearson chi-square, Pearson’s correlation-coefficient, as well KL divergence. This Thesis’ study demonstrates that Zipf-Mandelbrot better fits realistic consumption data than the previously most widely considered model, the Zipf-like distribution. Fur-thermore, the study shows that the expected behaviour of cache-enabled video delivery systems is closer to that of the empirical dataset when using the Zipf-Mandelbrot model than the Zipf-like model.
Chapter 4 assesses video delivery systems closely to outline the required data to more closely simulate a video delivery system. This chapter introduces a method by
which one can create pseudo-real requests that demonstrate time based characteristics in an effort to achieve a greater understanding of the effects of video decay, introduction and removal. This additionally aids in concluding that the current method of observing video request data is flawed as the passage of time over the period of observation can have many effects on the popularity distributions experienced.
In Chapter 5 a novel eviction algorithm is introduced. The algorithm is called the Bubble cache eviction algorithm, which is in reference to the Bubble sort algorithm, [21] which it resembles in some of its behaviours. The introduction of Bubble, together with the introductions of variations of Bubble, are intended to provide an alternative set of al-gorithms to the known cache eviction alal-gorithms such as LRU, FIFO, Random (RAND) and LFU. Investigated in this chapter is the Bubble algorithm and its variations and the results one can expect in a variety of simulated VoD systems, as well as analysis investigating the effectiveness of the introduced algorithms.
2
Background Research
VoD systems vary and are diverse in characteristics and behaviours [9, 10, 14, 17, 18, 22]. The years of observation, user counts, requests per day, requests per user, locations of observation and the number of unique videos are the gross level of varying character-istics when expressing the diversity of VoD systems currently live. Identifying these characteristics as well as other areas of research that impact local caching and the tech-nologies associated with such systems will be explored in this Chapter. An additional focus of the study is that of technologies that would provide a platform from which video delivery could be seen to express a lesser strain with the option of localised caching, currently not natively possible in IP.
2.1
Video Delivery System Characteristics
2.1.1 Video Segmentation in the context of caching
Caching whole, uninterrupted multimedia objects can be very inefficient in network caching. This is due to the size of the multimedia objects and the sections of the multimedia objects that are consumed by the end-users. Video files could reach the size of a number of gigabytes and a large number of consumers may only watch the first 14 of video. A method to avoid unnecessary latency and storage of multimedia objects is through segmentation. Segmentation suggests splitting the original multimedia objects into a number of smaller objects which are stored and treated as unique objects in the cache-enabled system/network. A number of varying strategies have been developed in an effort to minimise the latency experienced on a network and reduce the quantity of resources occupied in, for example, a cache of limited size. Key indicators were: Byte-hit ratio, deduction of requests with delayed start.
2.1.1.1 Fixed Segmentation
Fixed Segmentation splits the multimedia objects into a multitude of fractions evenly distributed to fill segments homogeneously. The fixed segmentation method has one clear benefit over Pyramid and Skyscraper segmentation regimes as it does not require segments to be valued separately. A cache eviction algorithm does not require knowledge of the size of the segment to increase the byte-hit ratio and performance of a cache, as would be required for Pyramid and Skyscraper segmentation schemes.
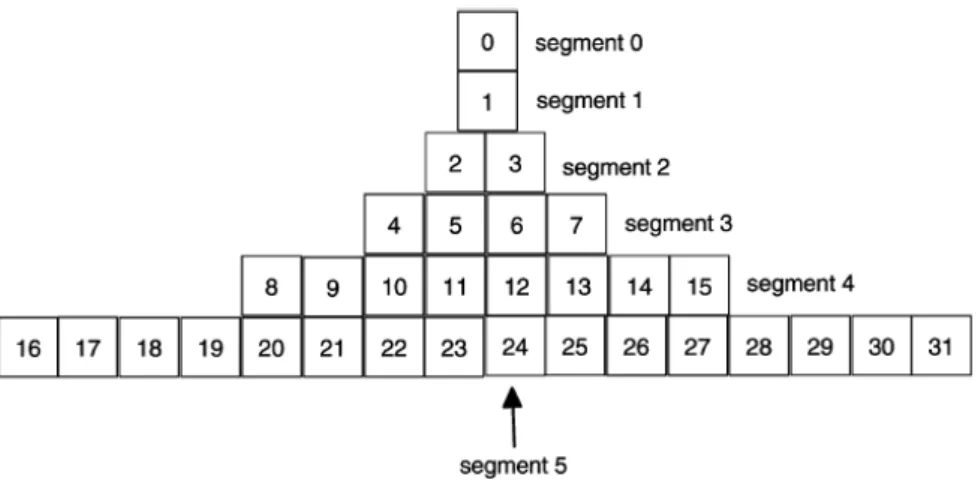
2.1.1.2 Pyramid Segmentation [23]
Pyramid segmentation postulates that the start of the multimedia object will most likely be requested and will remain most popular. The parts following the start are increasingly less important and thus kept in larger segments. The segments start at a fixed size at the beginning, exponentially increasing in size. This way the last half of the multimedia object can be removed with one single action. The first parts of the
Figure 2.1: Segmentation of a video according to the Pyramid segmentation regimen
video will be segmented to be easily interchangeable in a cache. Nip denotes the size of segmenti of a multimedia object under the pyramid segmentation regimen. Assume b is a constant and b >1. Nip = 1, ifi= 0 (b−1)b(i−1), ifi >0 (2.1)
b decides the segment size increase with each i+ 1. Figure 2.1 shows an example pyramid segmentation structure where b = 2, as shown in Equation 2.1. Each box in Figure 2.1 indicates an equal sized fraction of the original multimedia object.
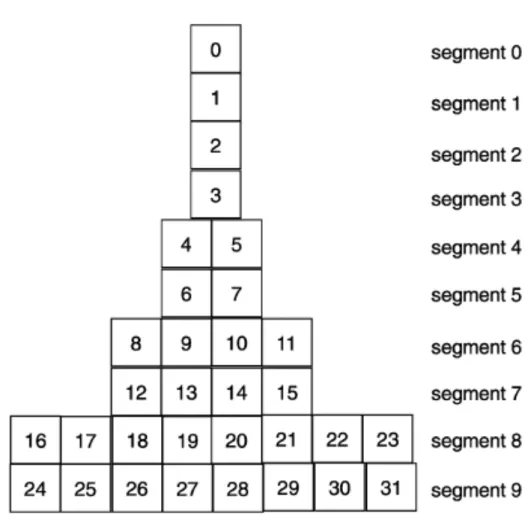
2.1.1.3 Skyscraper Segmentation [24]
A criticism of pyramid segmentation is that some segments grow to be very large. This may be detrimental to caches and user devices, such as set-up boxes, as storage is limited. A suggested solution to this problem is skyscraper segmentation which, as pyramid segmentation, increases the size of each subsequent segment, but more gradually. Nip
denotes the segment size of segment i of a multimedia object under the Skyscraper regimen.
Figure 2.2: Segmentation of a video according to the Skyscraper segmentation regimen Nip = 1, ifi= 0,1, , n (b−1)b i (n+1) −1 ifi > n (2.2)
bandndecide the segment size increase with eachi+1 in a sky scraper segmentation scheme, such as is described in Equation 2.2. Figure 2.2 shows an example skyscraper segmentation structure with b = 2. Each box in Figure 2.1 indicates an equal size fraction of the original multimedia object. Each row symbolises a single chunk on data that may be cached. n reduces the exponential increase that we experience in the pyramid segmentation scheme visible as repeating segment sizes for not just the first number of segments.
devices can more easily handle the larger segments when storage is of limited capacity.
2.1.1.4 Cache Admission Policy for Segmentation [23]
A cache admission policy can be used, before object submission to a cache to function, as a pre-selection process. A Cache Admission Policy would be required for a segmentation scheme, such as Pyramid or Skyscraper segmentation schemes, as not each segment can be considered equally due to the range in size of each segment. Segment i should only replace segment j in a cache ifi experiences a greater byte-hit ratio in the cache than j in the same time frame. This may be possible to determine in a Perfect Least Frequently Used (Perfect-LFU) enabled cache as the total requests for items not cached are recorded and considered when selecting items for caching, however most other cache eviction algorithms would be challenged to account for varying segment size.
2.1.2 Media and WWW Popularity Distributions
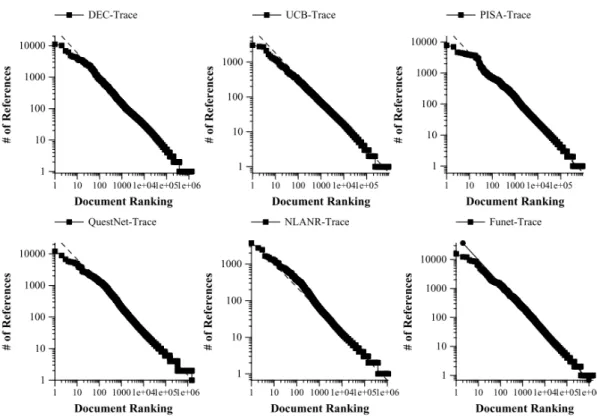
Many online media types have been identified to follow the same or similar trends in the frequency of requests. The objects have many different formats from Hypertext Markup Language (HTML) pages to images or videos. A number of studies have described a Zipf-like distribution to be a very closely fitting distribution to most generalised content observed through proxy servers available on the World Wide Web [25–28]. A simple see-by-eye test indeed confirms that a Zipf-like distribution can be observed in the recorded proxy data as show in Figures 2.3 [25], 2.4 and 2.5.
Almeida et al. [25] does suggest a Zipf distribution can be considered present, as is illustrated in Figure 2.3, as the data is shown on a log-log scale to be depicted as an almost straight line, which is a Zipf-like property. Almeida et al. [25] subjects the original data to a cache which measures cache-hit ratio by arbitrarily selecting objects for request according to the popularity distribution observed in the Boston University (BU) servers. The same test is performed for the Zipf distribution as items are arbitrarily selected with probabilities decided by the generated Zipf distribution.
Figure 2.3: Zipf a = 1. Zipf Law Applied to Web Documents
Figure 2.4: Miss rate for a Zipf-based synthetic workload and for an actual
trace
Figure 2.4 illustrates the cache-hit ratios observed for a range of cache sizes. In a scenario where each distribution can be considered equal, the two lines for each Zipf and the BU trace would sit exactly atop each other, however, it is clear that the two observed cache-hit ratios are indeed different. The Zipf-based model is shown to be nearly 33% less likely to receive a cache hit rate with a cache size of 400 than the original BU dataset that is suggested to be an accurate hit-rate.
Breslau et al. [26] performed a fitting using the MatLabs curve fitting tool, excluding the top 100 items. The top 100 times are arguably the most influential items in the distribution as they are responsible for the 52% of requests of all the documents. The most probable reason for excluding the 100 most popular documents when fitting is due to the erratic nature of the most popular documents. Breslau et al. [26] do indicate that Zipf is indeed a model that closely resembles the original proxy popularity distribution which includes the 100 most frequently requested items as is illustrated in the graph Figure 2.5 [26].
Cunha et al. [27], illustrated in Figure 2.6 [27], Perform R-Squared testing to confirm that a Zipf Distribution is present in the observed object request distribution. The results suggest an exact fit to a Zipf-like distribution with a value of 1.00. The objects observed are categorised into a number of different groups such as, HTML, Images, Sound, Video, Text, Formatted Documents, Archive and other files. Image files are the great majority of requests, a result of many images contained in a single HTML file.
Figure 2.5: Zipf = 0.66 ˜0.83 Web Caching and Zipf-like Distributions: Evidence and Implications
Figure 2.7: The Rank vs Rating of videos in the Netflix system pre-2006
2.1.2.1 Video Popularity Distributions
There seems to be majority consensus [7–18, 29, 30] that Zipf-like distributions are most representative of VoD systems. The main consensus originates from the observations first performed on general online systems and not exclusively video systems [25], [27], [31] which was later applied to VoD, assuming the two are interchangeable in regards to the observed popularity distributions. A number of studies [12, 16, 17] have expressed caution assuming that the popularity distribution of video content is Zipf-like, due to the heavy tail and the flat head seen on a log-log scale. Cha et al. [17] suggest that perhaps the truncation of the heavy tail is caused by the system implementation (Netflix [32]), which does not make niche content easily accessible. However, analysis of other studies [9, 10, 14, 18, 22] show that the truncated tail, and the flat head, appear in many other VoD systems thus opening up discussion on what model can be used to represent VoD popularity distributions accurately. Just as the Zipf-Mandelbrot and Zipf-like power-law distributions are frequently considered an appropriate model for video request data, a log-normal distribution may provide an equally appropriate model. The log-normal distribution has frequently demonstrated to be almost the same as power-law models [17, 33, 34].
Figure 2.8: UGC video request data. Views vs. Video Rank
Alternatively, Tang et al. [14] suggests that Zipf-Mandelbrot represents VoD pop-ularity distributions more accurately, which have also been witnessed in comparable systems, such as P2P [15]. This trend may not be exclusive to video content but rather general multimedia-based content [12]; thereby, showing Zipf-Mandelbrot to be emerg-ing as an alternative distribution model for describemerg-ing general multimedia-based content (including video), as opposite to the conventional Zipf model. Though there is evidence that Zipf-Mandelbrot demonstrates to be an appropriate alternative to Zipf-like when modelling the popularity distributions seen on VoD systems, the evidence is limited as it largely has been researched to model multimedia systems which show resemblance to VoD instead of pure VoD systems.
2.1.2.2 User Generated Content (UGC) Videos
User Generated Content (UGC) is a large section of the total video traffic with the emer-gence of large UGC video delivery platforms such as YouTube, Daum, Vimeo, Vine and many more. UGC is content that is generated and consumed by a large amount of producers and consumers and typically contains videos which are more ephemeral, un-predictable and numerous [33]. UGC is very diverse and thus creates an environment where individuals will choose to watch a more diverse group of videos which is unlike previous Video Delivery Systems such as traditional television where focus of a large group of viewers was decided by a small group of TV channels, keeping focus towards a smaller sections and variation of video content.
Video popularity distributions experienced in UGC systems, such as the one shown in Figure 2.8 [33], demonstrates a longer tail and a smaller set of extremely popular videos relative to the total number of videos. In a Zipf-Like distribution this would appear as a distribution with α > 0.8 such as an alpha variable as suggested in [25] and [26].
2.1.3 Video Popularity Decay
Video Popularity Decay has been discussed about in a range of research [16, 35–37], however it appears to rarely be quantified or analysed beyond the effects of the specific tests performed by the researchers in question. Additional to the lack of analysis of video decay, is the frequent omission of growth of popularity of video objects.
The subject of decay is discussed by Gummadi et al. [16] in the context of a peer-to-peer system called “Kazaa” in a rather poor manner as items larger than 100 MB are declared to experience a larger amount of request for items older than one month by 72% and items smaller than 10 MB are declared to experience a larger amount of requests towards items older than one month but by only 52% with the omission of medium sized items. The decay here is for multimedia items, not exclusively VoD, which causes some doubt as to how much this data resembles exclusively VoD data. It may well be possible that the majority of items observed are not video, dictating the decay-rate experienced by items in the system.
The subject of decay is also discussed by Li et al. [36] and Chen at al. [38] appear to agree that within their observed datasets that the initial day of observations see the videos decrease in popularity by 20%, and again decrease by 20% 9 days later. This observation is based in video request data that is explicitly not UGC on both Peer-to-Peer (P2P) based systems, as well as CDN run systems, such as Hulu and PPLive. Li et al. [36] appear to consider items once they are stored on the cloud device and then observed the decreasing popularity. This comes after a video is identified as popular enough to be submitted to the cloud, which may see a large part of the item’s lifetime
be omitted (an hour minimum due to design), as the time before the item became pop-ular it was not yet considered for measurement of poppop-ularity, especially considering the initial surge in popularity.
Chen et al. [39] follow the lifetime of video items in a system which includes the decay. The observation is made in a VoD service run by Tencent, which is one of the largest VoD services in China. It provides video to an active user base of over 50 million people. For the purpose of measuring video decay, videos are separated into categories, easily distinguishable by key characteristics (Movies, Music Videos, TV content, News and Sports), for which each category has a total decay rate measured over the duration of 7 days. The observations made suggest that most categories appear to see a great quantity of requests on the day of release, as well as the day following. After this period all categories see a drastic decrease in popularity, with the exception of the “Movies” category which appears to see a peak in interest on the third day the item is in the system. It is unclear if items on day 0 (the initial day of release) were in the system for the entirety of it, or just the later section of the day. This additional bit of missing information would point out if the items, almost immediately after release, start seeing a decreasing request rate or if this happens, as suggested by Chen et al., on the second day in the system. The conclusive statement by Chen et al. [39] is that video items in their infancy receive a great amount of promotion, mainly on the front-page of the VoD application, which may be the primary reason for the popularity received by these newly introduced video items.
Avramova et al. [37] provide a close look at the decay of video popularity of primarily video items which have already achieved a great deal of popularity by their submission to the top 50, list on their respective platforms, such as YouTube (US and JP platforms), IMDB rental records, and “Uitzending Gemist(.nl)” which is a Dutch TV catch-up service. Once submitted to the top 50 the items were observed for a minimum of 30 days. The observations concluded that it is primarily the UGC that sees a thick tail in the observed decay curve which can be described as a power-law distribution. All other
VoD System Nr. of Observed Entries τ α β
YouTube (Japan & USA) ≤160 ≤20 ≈0 0.5
UitZending Gemist ≤42 ≥10 ≈106 0.5
IMDB ≤18 ≥10 ≈106 0.5
Table 2.1: Results gathered by Avramova et al. The results are approximated from the graphs in the publication which can be factored in to the simulator
traces, described as TV catch-up services, appear to follow a more drastic decrease over time described as following exponential decay. The formula used by Avramova et al. [37] to plot the decay in the form of a Cumulative Distribution Function (CDF) experienced by video items in all systems is as shown in Equation 2.3
Ik(t) =ρk 1− 1 + β −1 αk −1(t−Θk) τk −αk (2.3)
In Equation 2.3 [37] τ describes the time it takes for a fraction 1−β of the total view count to accumulate. ∆t describes the time at which the item is observed and Θ describes the time of entry in the system. α is the important variable to consider as it is the variables that is form-determining in the function. If α is large, the function produces an exponential curve which would see the item gain the majority of its requests in the beginning of its existence. Ifαis small, the function produces a power-law curve which would see the item remain relevant for an extended period of time, with a small amount of popularity remaining throughout the item’s existence.
2.2
Any-cast protocols/systems
IP is the current protocol used exclusively on the internet at the Open Systems Inter-connection (OSI) [40] network layer protocol. It provides a location based method of accessing machines and was designed between the 1960s and 70s. The problem IP aimed to resolve was the sharing of resources over a distance between machines. The method used to retrieve resources was to reach a machine in a specific location to then request
the resource, creating a location based request methodology. The internet in current days sees less interest in the physical location from which the content originates, but rather the content itself irrespective of the origin. In the current architecture of the internet we see a need for any-cast algorithms which do not discriminate based on the location of data, but instead focuses on the proximity of the data required. Any-cast functions on the premise that requests can originate from many or one source and be satisfied by many or one single source on the network. An architecture such as the ICN model has been conceived to provide a method of delivering requested data objects without emphasising on the location of the data. ICN functions at layer 3.5 of the OSI depending on the implementation.
2.2.1 ICN Implementations
There are a number of projects and exemplar implementations of ICN such as; Data-Orientated Network Architecture (DONA) [41], Publish-Subscribe Internet Technology (PURSUIT) [42, 43], Scalable & Adaptive Internet soLutions (SAIL) [44], COntent Mediator architecture for content-aware nETworks (COMET) [44] and Content Centric Networking (CCN), a US funded project that later became Networking Named Content (NDN). All of these architectures follow an ICN architecture of which the PURSUIT implementation is used in this Thesis to aid in assessing effectiveness of caches as the ICN architecture is uniquely able to utilise caches in an a manner considerate of the location of the content. Reed et al. [42] describes the PURSUIT the publish-subscribe Internet routing paradigm that is based on the Publish-Subscribe Internet Routing Paradigm (PSIRP) architecture which Fotiou et al. [45] and Trossen et al. [46] describe in further detail. In ICN the location is decoupled from the object, making it possible to request the object and route it in a matter different from the currently internet. One method used in the CCN architecture uses a Uniform Resource Locator (URL) referring to an object. The URL is closely bound to the location of the system on which the object is stored and made available from. Many implementations of ICN still use IP as an underlying model, however implementations have been developed
with an alternative forwarding model leveraging bloom Filters (Bloom Filters (BF)) [42, 47] which makes a source routing approach possible. The PSIRP model allows the PURSUIT implementation to leverage in-network caching, multi-party communication through replication, and an interaction model that decouples sender and receiver.
An example implementation of ICN may see an architecture where subscriptions of users are handled by a Rendezvous (replacing the previously mentioned requirement of a URL seen in CCN) which functions as the system linking Subscriber and Publisher when a match is possible - this implementation is seen in the PURSUIT project. Once matched, the Rendezvous forwards the information of the object and location of both Subscriber and Publisher to the Topology Manager which generates a BF which contains the instructions the Publisher can use to forward the object to the Subscriber. The BF is sent from the Topology Manager to the Publisher which can forward the object accordingly. In this example it can be seen that, as objects are forwarded along the network, a caching node may choose to store the requested object and make it available; ready for any future requests of that object to spare network resources in the future. The process through which an object is forwarded from an original publisher would not differ if the object was forwarded by a caching node in its stead from the perspective of a Subscriber or the Rendezvous.
2.3
Cache Conscious Routing Strategies
For the purpose of testing the behaviour of the different popularity distributions four routing strategies were selected based on the performance gained and their individual diversity and functional differences. Routing strategies dictate the flow of traffic in a network with focus on cache storage and reducing total traffic on the network. The strategies available are numerous and a few of them are introduced and discussed below:
2.3.1 Cache Less for More (CL4M)
Cache less for more [48] considers centrality to decide where along the request path items should be cached. Caching at nodes only with the highest betweenness centrality
means the cached items are not replicated unnecessarily to all nodes on the request path and have an increased chance of residing on a node which requests are likely to pass over.
2.3.2 Leave Copy Down (LCD)
Leave Copy Down [49] routing strategy works on the basis that items are replicated towards the edge of the network from the original source of the requested items. Items are replicated towards the requester one level down with each request. This process gradually pushes frequently requested items towards the outer edges of the network.
2.3.3 Probabilistic Caching (ProbCache)
Probabilistic caching [50] places items on the path between source and requester based on a number of characteristics of the path. ProbCache is an algorithm that considers caching capabilities and content capacity, path lengths, and multiplexes content flows accordingly.
2.3.4 Leave Copy Everywhere (LCE)
When an object is requested in a Leave Copy Everywhere (LCE) implemented network it is stored on each cache enabled node over which it is sent.
2.3.5 Hash-routing
The hash routing strategy [51] requires each cache enabled node on the network to implement a hash function. The hash of the content transmitted is mapped to a specific node with the same hash. The node to which the content is mapped to is the only node on the network able to cache that content. This means in some implementation of Hash-Routing objects are not forwarded along the shortest path to the subscriber, but instead forwarded to the cache enabled node. In some instances it is forwarded to the cache enabled node as well as to the subscriber. This method of caching avoids replication of items in the network.
2.3.5.1 Hash Hybrid Symmetrical-Multicast Routing
The Hash routing strategies [51] are based on the idea of hashing items and mapping them to caches in the network. This method of caching may mean caching items off their original path of requests but avoids item replication on the network. A copy will always be sent to the designated cache if the item does not yet exist on the relevant cache enabled node. The decision whether the item should be sent from the cache or the original source to the requester depends on the total path length between the two sources of the item and the original requester.
2.4
Cache Eviction Algorithms
Cache eviction policies dictate the content of the storage devices on which they are implemented. The storage device would, in most scenarios, be located on an interme-diate link somewhere on a network. Cache enabled network devices select content that is requested and sent along the path on which they are located for storing. End de-vices may request data items located on the cache enabled network dede-vices instead of content servers as content servers may be considerably further removed on the network than cache enabled devices with the same desired content. Depending on what cache eviction algorithm is implemented, a number of different actions can be taken by the cache in order to attempt to maintain the items in the cache that will receive the largest amount of requests in the future, thus reducing the traffic downstream from the caching device to the best potential. Four opportunistic cache eviction policies were considered for measuring the performance differences between Zipf and Zipf-Mandelbrot.
2.4.1 LRU
The items in Least Recently Used (LRU) that experience eviction are those which were requested least recently. Every requested item is added to the cache or, if already present in the cache, noted to be the most recently requested item. The operational
cost of LRU isO(1).
2.4.2 LFU
The items in Least Frequently Used (LFU) that experience eviction are the ones with the smallest request count. Items are added by removing the items in the cache with the smallest number of observed requests. Item request counts are reduced every n number of requests to make old items available for eviction. LFU has a slightly higher operational cost of O(c) where c represents the cache size when replacing items in the cache. A simple search isO(1).
2.4.3 RANDOM
The random cache eviction policy evicts random items to make space for new items. This policy does not consider the frequency of requests of items held in the cache and does no prioritization of any items. Random has an operational cost ofO(1).
2.4.4 FIFO
First in First out (FIFO) works by arranging items in an ordered list and evicting items from the bottom and adding them on the top. FIFO and LRU share a very similar method of selecting items for eviction. FIFO does not move items to the top of the cache if they are located in the cache when requested, unlike LRU. FIFO has an operational cost ofO(1).
2.4.5 Most Recently Used (MRU)
The Most Recently Used (MRU) eviction algorithm works under the assumption that once an item has been requested, it is unlikely to be requested again, removing it when another one is added.
2.5
Icarus (ICN Simulator)
An ICN simulation environment has been created by Saino et al. [51]. The Icarus simulation environment is a publicly-available, Python-based tool for simulating caching behaviour on an ICN network. The popularity distribution of the items populating the system can be changed to reflect the desired system behaviour. Icarus enables the possibility of implementing a number of routing strategies which dictate the flow of data with the intention to populate caches in the network in the most efficient manner thus reducing the total amount of traffic on the network. Icarus also allows for any topology to be implemented. The results acquired are measurements of; average cache hit ratio, average path stretch and latency experienced on the network.
2.6
Conclusions and Scope
To conclude, the topic of video request is vast. Especially when technologies able to achieve greater network performance when applied to VoD are brought into focus. To limit the scope of this Thesis to an achievable goal, the main interests and conclusions to be taken from this brief introduction of technologies above will be as follows:
1. Variable size segmentation cannot be applied in combination with caches without a method of appropriately weighing the historic request frequency of items, thus excluding the possibility of applying the simple, and often used, cache eviction algorithms such as LRU and FIFO. For this reason the “Fixed” segmentation policy will be applied throughout this Thesis to create opportunities to cache using a more vast array of simple cache eviction algorithm. Any cache-specific research containing variable length segmentation, such as pyramid segmentation and skyscraper segmentation will be considered out of scope for this Thesis and the research contained.
2. Video popularity distributions are a point of discussion in the research community in regards to what popularity distribution, namely Zipf or Zipf-Mandelbrot, is to be considered a superior distribution for modelling video popularity data. This
Thesis will regard video popularity distributions to be a primary focus of study with special attention to the discussion surrounding video request data and the methods used to analyse which model is best to consider for the most approximate replication of real VoD data. Additional potential distributions, such as the log-normal distribution, will be considered outside of the scope of this Thesis. 3. Additionally to Video Popularity, other characteristics of video will be discussed
but not analysed in the same detail as the video popularity models. This is due to the lack of available data for such analysis. However, data from the limited existing sources will be combined in an effort to provide a pseudo-realistic request simulation environment for the purpose of simulating request data to be as encom-passing of all known variable characteristics as possible. This work will require leaps of judgement due to the restrictive nature surrounding the details of the characteristics involved.
4. As a method to reduce video delivery strain on a network, caching has been brought forward as a possible solution. Caching, though possible, is restricted in present day IP infrastructures, thus creating the need for alternative infrastruc-tures to enable and support a cache-enabled network. Any-cast protocols such as CCN and ICN provide such an environment. For this reason these technologies will be brought into focus in this Thesis with a primary focus of cache implemen-tation and development of cache eviction algorithms. A simulation environment of an ICN cache enabled network is available (Icarus [43]) and will be utilised throughout this Thesis to develop and test novel cache eviction algorithms.
3
Video Popularity Distribution Analysis
Global IP video traffic is predicted to constitute 82% of all consumer internet traffic by 2020, up from 70% in 2015 [6]. Innovation to reduce the costs of video streaming are therefore necessary and are being developed. Some examples are distributed server farms and video compression techniques, for which most solutions require simulations to stipulate just how effective one may presume specific solutions to be. Simulation data such as total video request distributions may for some VoD hosting platforms be accessible, however this is not so for most. Identifying key characteristics will open up the ability to simulate and reconstruct video request behaviour to more people, creating further opportunity for innovation. The goal of this Chapter is to identify the video request distribution of a VoD system for the purpose of reconstruction. To achieve this, two models are analysed to conclude that a specific model, with the required parameters, would be the best suited model to closely recreate the empirical dataset.
3.1
Introduction
Accurate modelling of video consumption patterns is a key factor in providing efficient utilisation of network resource. However, the lack of publicly available consumption data has meant that video consumption models have not been put under scrutiny and, instead have assumed to follow the same model, namely Zipf, as many other Internet services have; such as the World Wide Web, news feeds and email [26, 52]. Existing re-search has provided extensive testing that shows Zipf-like distribution to be sufficiently accurate for modelling such services [26, 52, 53]. However, the same cannot be said for video consumption models. In fact, various observations have shown that Zipf-like dis-tributions may not be the best model for describing the popularity distribution of video consumption patterns, hence, Zipf-Mandelbrot may be a better fit.
The danger of simply assuming a Zipf-like distribution for video consumption, with-out supporting evidence, is that the resultant model may not be sufficiently represen-tative of the user demands. Assuming a badly fitting model may lead to sub-optimal design choices in areas such as service planning/provisioning, utilization of network re-sources, accommodation of Service Level Agreement (SLA)s. A video caching system is one example where accurate video consumption models have significant impact on the network performance [14, 54, 55]. Such systems need to accommodate different types of video services, such as: VoD, Live streaming and UGC which in some cases follow vastly varying distribution models.
VoD has been argued to follow a Zipf-like consumption pattern [9, 10, 12]. However, the observed distribution of data shows a curvature on the log-log scale, which suggests a possible alternative model, namely Zipf-Mandelbrot [56]. Similar observation can be made for UGC consumption patterns [17]. This deviation may increase in the future of the Internet, with the rapid growth of user demands, the widening variety of the offered video services and the expected innovation in Internet architectures, such as
ICN [42, 50, 57].
This Chapter addresses the shortage in evaluation of video-focused consumption models. While there heve been hints that Zipf-Mandelbrot is a good model, this work shows – through empirical data – that consumption patterns do indeed comply to this distribution. This is achieved by analysing an example large-scale empirical dataset, provided by BT , as well as using synthetically generated consumption data, following Zipf and Zipf-Mandelbrot distributions. These models include standard testing methods such as; Pearson chi-square, Pearson’s correlation-coefficient, as well KL divergence. Our study demonstrates that Zipf-Mandelbrot better fits realistic consumption data than the previously widely used model: The Zipf-like distribution. Furthermore, this study shows that the expected behaviour of cache-enabled video delivery systems is closer to that of the empirical dataset when using the Zipf-Mandelbrot model than the Zipf-like model.
3.2
Video Popularity Metrics
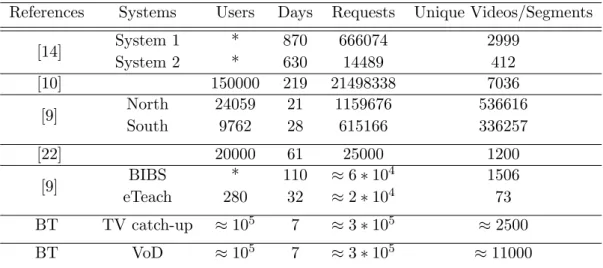
VoD systems vary in a number of ways. A summary that highlights the diversity of VoD systems previously investigated can be found in Table 3.1. Table 3.1 is comprised of a number of VoD system characteristics described in a number of publications. The years of observation, user counts, requests per day, requests per user, locations of obser-vation and the number of unique videos are the gross level of features when expressing the diversity of VoD systems currently live. It may be assumed that the diversity of VoD systems impacts the Video Popularity Distribution, however, evidence shows that although the individual parameters may vary from one system to another, there is a commonality in the type of distribution. A good example is that presented by Cha et al. [17] in the case of Netflix [32]. The Netflix search algorithm had a sampling bias that impacted the popularity distribution, however, inspection [17] of the popularity distri-bution would suggest a Zipf-Mandelbrot distridistri-bution is present. When inspection of all popularity distributions of systems listen in Table 3.1 it appears that the popularity
References Systems Users Days Requests Unique Videos/Segments System 1 * 870 666074 2999 [14] System 2 * 630 14489 412 [10] 150000 219 21498338 7036 North 24059 21 1159676 536616 [9] South 9762 28 615166 336257 [22] 20000 61 25000 1200 BIBS * 110 ≈6∗104 1506 [9] eTeach 280 32 ≈2∗104 73 BT TV catch-up ≈105 7 ≈3∗105 ≈2500 BT VoD ≈105 7 ≈3∗105 ≈11000
Table 3.1: Published statistics from VoD and UGC systems + BT provided statistics
distributions, though not the same in each example, show clear trends despite the di-versity of each system and its observation. Here, a clear distinction was made between a number of consumption systems: linear, which broadcast video services; TV-catchup, a form of VoD where content is typically time-limited and introduced in conjunction with
linear TV; and, VoD-time-unlimited (VoDu), which includes systems such as Netflix,
where a catalogue is maintained over a relatively long time.
The BT data-sets are compared and contrasted in Table 3.1 against a range of other VoD systems which all have been observed between 2000 and 2012 with a variety of properties.
3.2.1 Existing Popularity Distribution Models
Currently, there is no agreement on one popularity distribution model that would fit all video delivery systems; however, the general consensus appears to be that content, regardless of type, system and time of observation, still follows a Zipf-like distribu-tion [9, 10].
A number of studies [12, 16, 17] have expressed caution assuming that the popularity distribution of video content is Zipf-like, due to the heavy tail and the flat head seen on a log-log scale. Cha et al. [17] suggest that perhaps the truncation of the heavy tail is caused by the system implementation, which does not make niche content easily