ASSESSING DATA QUALITY OF REMOTELY-SENSED
DEMs IN A HUNGARIAN SAMPLE AREA
GERGELY SZABÓ
1– NIKOLETTA MECSER
2– ANITA KARIKA
3 1,2,3University of Debrecen, Department of Physical Geography and GeoinformaticsHungary, 4032, Deberecen, Egyetem tér 1. E-mail: [email protected]
Received 9 May 2013, accepted in revised form 24 September 2013
Abstract
Nowadays the free-access digital elevation models are getting more and more popular. The SRTM and AS-TER GDEM databases are the most widespread. However, there are numerous situations and weaknesses we have to take into account during their usage, such as direction-dependent accuracy and difference between digital and real surfaces. Our goal was to examine these kinds of deficiencies of surface models.
Keywords: SRTM, GDEM, surface models
1. Introduction, aims
Recently, digital elevation models (DEM) are commonly used in scientific research. But generating them correctly is so difficult. Widespread way is to vectorize contour lines of detailed maps (e.g. Demeter – Szabó 2008; Lóczy et al. 2011; Püspöki et al. 2005), but it is slow and expensive. On the other hand, there are several databases with free accessibility of Earth (or Mars, e.g. Sik 2011) and these are very popular among both professionals and the public, due to their simple handling and large spatial – even global – coverage. Good examples are the American Global Land Cover Facility (GLCF 2009), providing free download of older space images, databases containing the topographic conditions of the Earth’s surface like the GTOPO-30 (GTOPO30 2009) or the SRTM. Google Earth has a special condition, as it is the mixture of several databases.
Such databases, however, may hold the possibilities of errors. It is important to know the metadata of the database (when was it set and for what purpose, etc.), its accuracy and the possible requirements related to it. It is a frequent error that too high accuracy is
attributed to a database or certain conditions are neglected (e.g. the height of surface objects in the SRTM or in ASTER GDEM).
Since the SRTM and the ASTER GDEM are increasingly popular, they appear in numerous research projects as databases (e.g. Dobos et al. 2008, Peckham and Jordan, 2007, Timár et al. 2003). Therefore we have to take into account their accuracy, possible errors and other characteristics.
In the course of our analyses the differences among the GDEM, the SRTM and a model constructed on the basis of a topographic map were studied and the grade of distortion of the relief due to surface objects and the technique of data recording are also investigated.
2. Materials and methods
The selected study area was located north of Lake Balaton, in the western part of Hungary (Fig. 1).
The study area was selected based on the significant relief differences and the more-or-less equal representation of the various slope orientations. Somló Hill and its surroundings represented large relief differences, thus, the
majority of the selected study area is covered by the hill as shown in Fig. 1.
The GDEM1 database
The database of GDEM was published in 2009 as the result of a joint development of the USA and JAXA (ASTER 2010). The DEM composed of the images of the ASTER (Advanced Spaceborne Thermal Emission and Reflection Radiometer) imaging instrument, located on the TERRA satellite is available for most of the Earth’s surface. The 1˚ by 1˚ sized surface tiles, composed of 1 arcsecond pixels are available for free. An estimated accuracy value is also available that can be downloaded as a separate raster file. Deficiencies are examined mainly in the area of the USA and Japan, however, error estimation was carried out for other areas as well (ASTER 2010).
The SRTM database
In 2000 on the board of space shuttle Endeavour, radar-based data had been collected by two equipments (X-RADAR and SIR-C/X-SAR). The result is the SRTM (Shuttle Radar Topography Mission) (Zyl 2001) database, consisting topographic information about the surface of the Earth. To rectify
the surface database, thousands of ground control points and GPS measurements have been used. The original resolution was about 30 m/pixel, nevertheless it was necessary to filter out the bias and inaccuracies by the provider (that was highly important in relation with the water bodies), thus the final resolution had been changed to 90 m/ pixel, except for the USA. The whole database covers about 80% of the Earth’s surface (Zyl 2001).
EOTR maps
The Hungarian topographic maps with the scale of 1:10000 covering the entire country were created initially with military leadership in the 1960s. The EOV (Unified Hungarian Projection – HD-72) became the official civil projection in 1975 and civil mapping continued the construction of the 1:10000 map sections. Update of these maps is still going on today and the time of the last reambulation of the particular sections is 0-30 years.
The process of analysis
We compared both the SRTM and the GDEM models to the real surface. In our case the starting points were the contour
lines of the 1:10000 topographic maps, the most accurate database available for the sample area. The vertical accuracy of this was generally between 1 m and 5 m (Winker 1997). It was around 1 m in the case of the sample area where the base contours are 2.5 m (Detrekői et al. 2000). Contour lines were vectorized with ArcGIS 9.2 and a TIN model was generated (because in case of the TIN model the interpolation inaccuracy is minimal). Following this, the model was rasterized. The common projection system was the Hungarian HD-72 (EOV), therefore SRTM and GDEM were transformed.
We examined whether the two databases overlap each other exactly or not. This was performed based on the topographic characteristics with the location of marked relief elements (e.g. peaks). After this, we determined slope orientations with IDRISI for both models and heights calculated based on the GDEM and SRTM were subtracted from the contour lines-derived DEM. This latter one was considered as real surface. In this way, the difference layers of the real and remotely sensed surfaces were obtained for each pixel.
Since higher vegetation (trees) influenced the GDEM and SRTM models, the areas least covered by woods were identified on the basis of the aerial images taken in 2000. A point layer with random selection composed of 872 points was generated for these areas (7% of the total pixel number) to ensure the independence of the dataset. We extracted the pixel values in these points resulting in the database, which was analysed with statistical methods. We applied Wilcoxon paired test to compare the different models and the derived variables. We used SPSS for the statistical analysis.
3. Results
Studying the height differences of the contour lines-based topography and the two surface models, it can be stated that the average value was not zero, i.e. surface
models showed fundamental differences compared to the topographic maps. The average value of this difference was 1.5 m and 5.5 m in the case of the SRTM and the GDEM respectively, and in both cases the models showed heights lower than those on the topographic maps. In case woodlands were not filtered out, the average difference was reduced, however, not to zero (1.3 m and 5.1 m) as their extent was low in the sample area (8%), and the outweigh part of them were at the upper, low-inclinated part of the hill. This reduction, however, showed the effects of higher vegetation in the surface models.
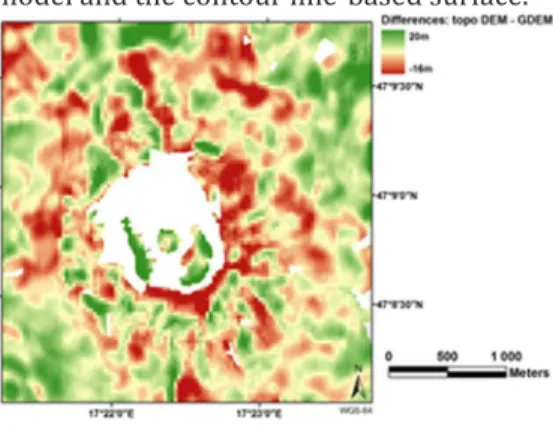
Later, the correction of the databases was performed with the calculated values, i.e. the two surface models were “uplifted” to the heights of the topographic surface. Fig. 2 presents the difference between the GDEM model and the contour line-based surface.
Fig. 2. Error values of the GDEM at the Somló Hill without forests
Since the GDEM values were subtracted from the topographic map-based model, positive values represented higher map based (i.e. accepted as the correct one) surface regions, while negative pixels represented higher GDEM surface compared to the real values. Greatest corrected differences were +20 m and -16.7 m, standard deviation was 3.5 m. Fig. 3 shows the differences between the SRTM model and the topo-based surface.
Fig. 3. Error values of the SRTM at Somló Hill
Largest differences are +16 m and -22 m in the case of the SRTM model and standard deviation is 2.3 m, which is a bit smaller than the errors of the GDEM. This meant that the SRTM surface fluctuated less while the GDEM surface varied more, compared to the real surface.
Our statistical examination showed significiant distinction between the two surface-differences.
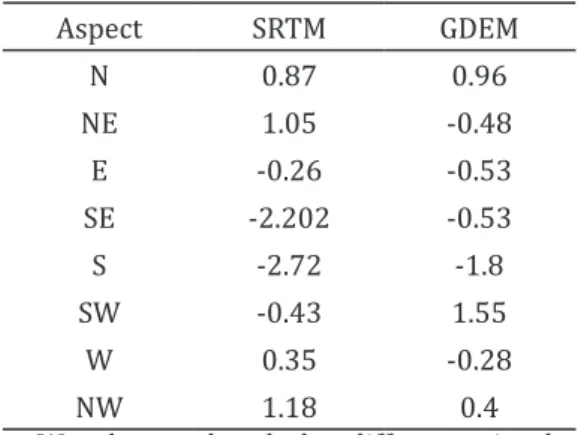
Table 1. Average differences from the topographic map surface according to slope aspects (in
me-tres) Aspect SRTM GDEM N 0.87 0.96 NE 1.05 -0.48 E -0.26 -0.53 SE -2.202 -0.53 S -2.72 -1.8 SW -0.43 1.55 W 0.35 -0.28 NW 1.18 0.4
We also analysed the difference in the magnitude of error according to slope aspect. Table 1 shows that points looking into different directions on the remotely-sensed surface models, with corrected heights showed different level of error. Based on the results, a fluctuation related to certain directions can be recognised mainly in the case of the SRTM. Table 1 shows that southern slopes have the greatest difference both in case of the GDEM and SRTM models.
GDEM showed the greatest difference in the case of southern orientation where the surface of the model was 1.8 m higher in average than that of the contour map. Interesting to note that the second most significant difference was observed at the neighbouring southwestern orientation where the surface was 1.5 m lower than that of the maps considered to be the real surface. In the case of the SRTM maximum difference was observed also at southern orientation (SE: -2 m, S: -2.7 m), however, with a continuous fluctuation in the magnitude of the differences. This fluctuation resulted in positive average difference at northern orientations, i.e. at these slopes the surface model was lower than the contour map, regarded to be closer to reality.
No significant correlation was found (with Spearman correlation probe) between slope steepness and the volume of error (differences). Only 6% of the variance of the errors is explained by slope gradient in the case of the GDEM. In the case of the SRTM, correlation was stronger, however, still only 31%, i.e. the correlation between the height difference of the two models and slope steepness was small.
4. Discussion and conclusions
The GDEM and the SRTM are free, easy-accesible, global surface models. Fields of their application have a wide range because their spatial resolution and only a few years old basic database make them suitable for numerous purposes. Some of their specific characteristics, however, have to be considered when using them.
Such special condition is the effect of vegetation covering the surface that was clearly presented in our research, however, it was proved to be a useful tool for detecting forested vegetation like in the research of Simard et al. (2006).
Another characteristic feature of both models was an average difference with which the surfaces have to be corrected. The magnitude of this was different in the two
models and it would be also different in a different model area. According to a research in another Hungarian sample area (Szabó 2011) the SRTM and the GDEM showed the average difference of 2.5 m and 6 m, respectively. For the vertical accuracy of the GDEM the Japanese data owner organisation (METI 2010) gives 7-14 m, as the accuracy interval of the data measured in our analyses, i.e. it meets the expected accuracy. The official standard deviation of 8.68 m is significantly higher than the measured values. The owners (NGA, NASA) planned the accuracy of 16 m for the SRTM model. Our results were significantly better than this value, i.e. this model also meets the requirements.
A further characteristic is that the GDEM shows a significantly higher value of variance in the case of the differences, while surface variations of the SRTM are less altering. This can be explained partly by smaller spatial resolution, however, in our opinion this is influenced greatly by surface pattern as well (e.g. shadow effects).
Error with magnitudes changing in relation to orientation was characteristic for both models; although, greatest average differences were similar in the case of the two surfaces.
Apart from the above, our research indicated that slope steepness in the current sample area did not affect the accuracy of surface models within the slope categories studied in our analysis.
The two surface models therefore meet the accuracy parameters defined by their inventors; however, it is the task of the users to note these limits when the models are applied as basic data for research.
Acknowledgements
This paper was supported by the TÁMOP-4.2.2/B-10/1-2010-0024 between 01.15.2012
and 30.05.2013 . The project is co-financed by the
European Union and European Social Fund. From 01.06.2013 this research was supported by the European Union and the State of Hungary,
co-financed by the European Social Fund in the
framework of TÁMOP 4.2.4. A/2-11-1-2012-0001
‘National Excellence Program’.
5. References
ASTER homepage (USA). http://asterweb.jpl.nasa. gov/gdem.asp Downloaded: 2010.
Demeter, G. – Szabó, Sz. (2008): Morfometriai és
litológiai tényezők kapcsolatának kvantitatív vizsgálata a Bükkben és északi előterén: A statisztikus felszínelemzés alkalmazásának
lehetőségei a geomorfológiában.
(Quantification of relationship between
geomorphic and lithological parameters in the Bükk mountains: the possibilities of statistical surface analysis int he geomorphology). DE, Kossuth Egyetemi Kiadó, Debrecen, 183, ISBN: 978-963-473-131-3.
Detrekői, Á. – Barsi, Á. – Mélykúti, G. – Szabó, Gy. (2000): 1:10 000 méretarányú EOTR topográfiai térképek domborzati tartalmának ellenőrzése (Controlling the relief of
EOTR topographic maps with the scale of 1:10000). Final report. Department of Photogrammetry and Geoinformatics, Faculty of Civil Engineering, Budapest University of Technology and Economics - Budapest.
Dobos, E. – Bialkó, G. – Michéli, E. (2008):
Határon átnyúló talajtani adatbázisok készítése digitális talajtérképezési eszközök segítségével. (Creating cross-border soil-based
database using digital soil-mapping methods). Talajvédelem (special issue): 577-584. GLCF homepage. http://glcf.umiacs.umd.edu/data/
landsat/ Downloaded: 2009.
GTOPO-30 homepage. http://www.npagroup.com/ catalogue/shop/gtopo30/gtopo30_ readme. htm. Downloaded: 2009.
Lóczy, D. – Pirkhoffer, E. – Gyenizse, P. – Czigány, Sz. (2011): Térinformatikai módszerek az árterek morfometriai tanulmányozásában, a Kapos példáján (GIS methods in analysis
flooded areas ont he sample of Kapos
river). In: Lóki, J. (Ed.)(2011): Az elmélet és gyakorlat találkozása a térinformatikában II.
- Térinformatikai konferencia és szakkiállítás.
Debreceni Egyetemi Kiadó, Debrecen, 279-286, ISBN: 978-963-318-116-4.
METI homepage. http://www.jspacesystems.or.jp/ ersdac/GDEM/E/2.html Downloaded: 2010 Peckham, R. J. – Jordan, G. (Eds.) (2007): Digital
Terrain Modelling – Development and Applications in a Policy Support Environment, Springer-Verlag, Berlin-Heidelberg.
Püspöki, Z. – Szabó, Sz. – Demeter, G. – Szalai, K. – McIntosh, R. W. – Vincze, L. – Németh, G. – Kovács, I. (2005): The statistical relationship
and the frequency distributions of slope gradients: A case study in northern Hungary. GEOMORPHOLOGY 71 (3-4): 424-436.
Sik, A. (2012): Keringőegység-adatok térinformatikai integrálása a Mars jeges lejtőformáinak
vizsgálatához. (Integration of orbiter-data of Martian ici forms into GIS system). In: Lóki József (Ed.) Az elmélet és gyakorlat találkozása a térinformatikában III. - Térinformatikai
konferencia és szakkiállítás. Debreceni
Egyetemi Kiadó, Debrecen, 365-372, ISBN: 978-963-318-218-5.
Simard, M. – Zhang, K. – Rivera-Monroy, W. H. – Ross, M. S. – Ruiz, P. L. – Castaneda-Moya, E. – Twilley, R. R. – Rodriguez, E. (2006): Mapping Height and Biomass of Mangrove Forests in Everglades National Park with SRTM Elevation Data. Photogrammetric Engineering and Remote Sensing. 72 (3): 299-311.
Szabó, G. (2011): Az Aster GDEM adatbázis pontosságának vizsgálata egy hazai mintaterületen (Studying the accuracy of the Aster GDEM database in a Hungarian model area). In: Lóki J (Ed.) Az elmélet és a gyakorlat találkozása a térinformatikában (Meeting of theory and practice in geoinformatics): II. Geoinformatic Conference and Workshop, Debrecen, University of Debrecen, 421-429, ISBN:978-963-318-116-4.
Timár, G. – Telbisz, T. – Székely, B. (2003):
Űrtechnológia a digitális domborzati
modellezésben: az SRTM adatbázis. (Space technology in digital relief mapping: the SRTM
database). Geodézia és Kartográfia 55 (12):
11-15.
Winkler, P. (1997): A távérzékelés térképészeti alkalmazásai a XXI. század küszöbén (Application of remote sensing in mapping on the eve of the 21st century). In: Geodézia és
Kartográfia 4: 13-20.
Zyl, van J.J. (2001): The Shuttle Radar Topography Mission (SRTM): a breakthrough in remote sensing of topography. Acta Astronautica. 48 (5-12): 559-565.