JavaVis: An Integrated
Computer Vision Library for
Teaching Computer Vision
MIGUEL CAZORLA, DIEGO VIEJO
Instituto de Investigacio´n en Informa´tica, Universidad de Alicante, P.O. Box 99, E-03080, Alicante, Spain
Received 15 July 2013; accepted 1 December 2013ABSTRACT: In this article, we present a new framework oriented to teach Computer Vision related subjects called JavaVis. It is a computer vision library divided in three main areas: 2D package is featured for classical computer vision processing; 3D package, which includes a complete 3D geometric toolset, is used for 3D vision computing; Desktop package comprises a tool for graphic designing and testing of new algorithms. JavaVis is designed to be easy to use, both for launching and testing existing algorithms and for developing new ones.ß2013 Wiley Periodicals, Inc. Comput Appl Eng Educ; View this article online at wileyonlinelibrary.com/journal/cae; DOI 10.1002/cae.21594
Keywords: computer vision; image processing teaching; open source; Java GUI; 3D data
INTRODUCTION
Computer vision is an important subject in computer science engineering degrees. For laboratory lectures, we need a complete and easy to use tool. In this work, we present JavaVis [1], a Java library, which is oriented to teaching, but can also be used in research (in fact, at least one PhD Thesis [2] has been developed using JavaVis for carrying out test and experiments). The teaching oriented aspect of JavaVis means that we have designed and built the libraryfirst thinking about readability and understanding and second taking care about efficiency.
In JavaVis, we have developed three different modules, based on three different needs we have discovered in our vision related subjects. Thefirst one, JavaVis2D, is a basic library to process images and it follows a specialfile and image format enabling easy sequence management and processing; it incorporates geometrical data (edges, segments, points, etc.) and has several well‐known computer vision algorithms implemented. At its current state, JavaVis includes more than 90 computer vision algorithms. Furthermore, students can, easily, develop their own algorithms. The second module, JavaVis3D, is based on the same working schema than thefirst one, but applied to 3D data sets. It can handle points, segments, planes, etc. in the 3D space and has already
implemented some essential methods related to 3D vision. Finally, we have developed a visual desktop in order to visualize how the different algorithms in JavaVis2D work and the result of combining them.
The integration of the three frameworks provides the user a common framework: the algorithm and parameter definition is the same for traditional computer vision (2D) and for 3D processing. Besides, the user could use methods from 2D in 3D algorithms. Nowadays, the extensive use of RGB‐D devices such as the Kinect has had necessary this integration.
The rest of the article is organized as follows: An overview of the main systems currently employed for processing images are described in Related Work Section. After that, the section Overview of the Framework provides a brief description of the common features of JavaVis. Then, in the next three sections we describe the main features of the different parts of JavaVis: 2D, Desktop, and 3D. In the Teaching Experience With JavaVis Section, we describe in which subjects we are using JavaVis. Finally, some conclusions and future work are drawn.
Related Work
Several libraries and systems have been developed for computer vision research and education. First of all, we start describing libraries written in any programming language, and then we continue reviewing specific Java‐based libraries. Khoros library [3] is available for Unix platforms, Windows and MacOs. It incorporates a visual programming environment where programs are created by placing toolboxes: rectangular icons that represent operators, which are simply stand‐alone programs written in C,
Grant sponsor: Universidad de Alicante (Spain); Grant number: GRE10‐35; Grant sponsor: University of Alicante; Grant number: GITE‐09017‐UA
Correspondence to: M. Cazorla ([email protected]) © 2013 Wiley Periodicals, Inc.
Cþþ, Java, or a script language. Each operator performs on an input image or dataset, producing an output image. Connections that represent dataflow between the toolboxes are established by dragging the mouse. To complete the visual programming capabilities, there are advanced programming language constructs such as loops, procedures, and control structures. Currently, this library is neither freeware nor open source, which is not a desirable feature for computer vision teaching. Open Computer Vision Library (OpenCV) [4] is available for Windows, Linux, and Mac. It is distributed under Intel’s license for both commercial and non‐ commercial (researching and teaching) purposes. The library includes over 300 image analysis and processing methods from morphology, geometry, image treatment, etc., up to the recently added methods for computing stereoscopic correspondence, face recognition or 3D tracking. Although OpenCV is one of the most complete and efficient computer vision libraries, it does not incorporate a Graphic User Interface (GUI) to visualize and evaluate results. Furthermore, it is not teaching oriented so its learning curve is high. VIGRA [5] is a novel computer vision library that focuses on customizable algorithms and data structures. The library was built using generic programming as indicated by the Standard Template Library (STL). By writing a few adapters (image iterators) it is possible to use VIGRA’s algorithms in computer vision applications. Nevertheless, the library does not have enough implemented algorithms, nor does it have a GUI. Finally, the CVIPtools [6,7] is very similar to one of the parts of the library presented here, the 2D part of JavaVis. However, it is developed in Cþþ(actually, authors have introduced .NET) and the multi‐platform feature that provides Java is not fully accomplished. In contrast, JavaVis provides a Desktop environ-ment that is not present in CVIPtools and the 3D part is not also included in it. Furthermore, our proposal has a fully integrated user experience.
Among the libraries that include features or are designed to work on 3D vision, one of the most used libraries is Point Cloud Library (PCL) [8]. This library is implemented in Cþþ, although it can be used with other programming languages. It also has implemented state‐of‐the‐art 3D methods, but its GUI is not good enough for teaching purposes.
On the other hand, there are few libraries written in Java. Java Imaging and Graphics Library (JIGL) [9] was developed at Brigham Young University to make programming both course‐ level and research‐level image‐handling algorithms as easy as possible. JIGL extends standard Java image‐handling capabilities. It is based on the Java Advanced Imaging (JAI) [10] developed by Sun Microsystems. JAI is a base library which focuses primarily on web‐based applications. Nevertheless, JAI is not useful for computer vision applications. This is why JIGL was developed. It is built around a set of image classes that support individual pixel access, image‐wide operations and image–image operations. However, the number of included computer vision algorithms is low. Image Processing in Java (IPJ) [11] is another JAI‐based library. The IPJ goal is to expand JAI’s functionalities with computer vision algorithms. The methods included in the library are spatial filters, convolutions, compression, morphological
filtering, boundary processing, and chromatic light. Nevertheless, it does not include some of the more elaborated and recent methods, for example, sequence processing, object tracking, 3D stereo vision, etc. Furthermore, IPJ does not have templates to facilitate the inclusion of new algorithms to the library, nor does it have a GUI. Java Vision Toolkit (JVT) [12] is also based on the JAI library, adding computer vision algorithms for 2D and 3D images.
JVT provides implementations for image‐handlingfiltering, edge detection, segmentation, Hough transform, morphology, and color analysis. It also includes a GUI application, which makes JVT easy to use for end‐users and developers alike. JVT is designed for students using the image‐computation template provided to implement new algorithms. Nevertheless, the main weakness of JVT is the lack of image sequence handlers. Another computer vision library is ImageJ [13]. It is based on three fundamental features. First, the use of macros, which allow users to automate tasks and create custom tools; second, it is possible to extend the capabilities of ImageJ by developing plug‐ins; andfinally, it can process an entire stack of related images using a single command. The library core includes several image handlers. All the related computer vision functions are incorporated as plug‐ins. Also, ImageJ contains a GUI which allows end‐users to launch the library algorithms and evaluate the results. This library is widely accepted in scientific areas, although the lack of templates for the development of new algorithms makes it less appropriate for educational purposes.
Several works have explored the use of computational tools for teaching computer vision. A good review about it is [14]. In it, the use of a visual tool in order to work with images is encouraged. In Ref. [15], authors explore the use of an interactive program for teaching image processing. However, this tool has only a few implemented methods. Another example of limited system is [16]. It includes a few number of computer vision methods, it is a closed system and only focused on robotics.
On the other hand, the use of Java as programming language has been used in several works, proving its validity and multiplat-form support of the language. Javenga [17] is a visualization environment based on Java which permits to teach concepts related with network and graph algorithms. Another example is [18], where a Java platform is developed for teaching robotics.
OVERVIEW OF THE FRAMEWORK
The aim of JavaVis is to provide the student an easy to use and learn tool in order to acquire and to understand concepts related with Computer Vision. Our tool is developed following this main principle: the development and implementation of new algorithms must be an easy task. This entails freeing the developer for certain programming tasks such as: graphical interface, Input/Output, parameter passing, etc. To accomplish that, JavaVis is in charge of loading and saving files, managing graphical interface, and providing a system for declaring, checking and passing parameters to an algorithm. Implementing a computer vision algorithm within JavaVis is quite simple: the user defines a Java class, defines its parameters, and the algorithm itself.
Although there are other libraries that have a more complete set of implemented algorithms (like OpenCV and PointCloud), or provide better graphical interfaces, JavaVis can provide a common framework to develop algorithms not only for image processing, but also for 3D data processing. The code is freely available and also provides an easy way to develop new algorithms. Further-more, JavaVis is designed as a teaching tool, not as a researching tool.
JavaVis consists of three different but joined parts. When the system starts, it shows the 2D part. This part is the one related with traditional computer vision and, in fact, it was thefirst developed. It allows to apply different available algorithms, and students can develop their owns. Among the different practical exercises
proposed to the students, sometimes them have to implement an assignment using some of the already library implemented algorithms, adjusting the parameters for obtaining the correct output. We realized that this part of the work (adjusting parameters) was tedious for the students, as they have to execute several tries of the same method with different algorithms or parameter sets. Besides, sometimes the output of an algorithm is the input of another one and so the process becomes more complicated. To solve that, we have developed a visual programming tool called Desktop where the students can easily execute a sequence of algorithms andfit the correct parameters for their task. Finally, we have developed a new part of the library oriented to work on 3D images. With the launch of the Kinect device, the use of 3D data has become more popular in computer vision. We incorporated this part which is able to manage 3D data, not only points but also planes, normals, etc. Several state of the art methods have been included and it could be used in conjunction with the 2D part. In the following sections, we describe these three parts deeply. The Graphical User Interface (GUI) of the three parts is shown in Fig. 1.
JAVAVIS2D
This section will introduce the main features of JavaVis2D, which is related with images. We began to develop JavaVis following the same philosophy of work than Vista [19]. Vista was a computer
vision library written in standard C, which tried to simulate the object‐oriented programming. The features of Vista were very attractive for developing algorithms in vision and, in fact, many researchers used it, but its creator left the project. Our goal was to create a similar library with a totally OO language. Most of the features of JavaVis are based on Vista.
In JavaVis, we have defined an image format that allows working with image sequences. Some computer vision algorithms have to manage image sequences. For example, optical flow algorithms use several images to estimate movement and stereo computation needs two or three images to work. Furthermore, images are usually composed by different bands, for example, a RGB color image can be stored in three different bands. In this way, JavaVis handles its own image format that enables it to manage image sequences and bands.
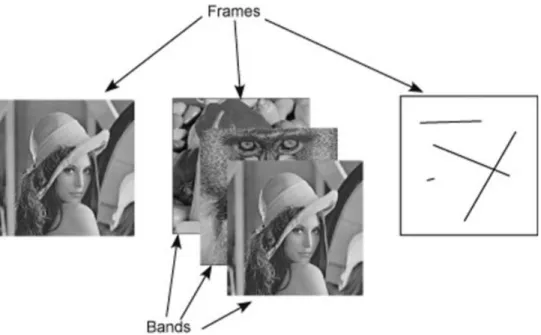
Each image in JavaVis is composed of one or several frames, forming a sequence. A frame represents an image that can be of two types: bitmap or geometric. A bitmap frame is an image represented as a matrix in which each element is a pixel (picture cell). JavaVis hasfive types of bitmap frames: Bit (0,1), Byte (0.255), Short (0.65525), Float (float range of Java), and Color (three bands of Byte type each). In addition, each bitmap frame can be formed by one or several bands. Each band must have the same dimensions. Internally, each type stores a one‐dimensional array of data, in order to be more efficient. For example, the Bit type is stored using a boolean Java type, the Byte type uses the byte Java
Figure 1 The three main parts integrated in JavaVis. [Colorfigure can be viewed in the online issue, which is available at wileyonlinelibrary.com.]
type and so on. When accessing the pixel, the data are converted, from its original value: for example, the byte type in Java is signed but the Byte type of JavaVis is unsigned. Conversion is done internally. A sequence can be organized in two ways: several frames in a sequence, or several bands per frame, which can also form a part of a sequence. However, in order to insert several bands in the same frame, every band must have the same size and be of the same type whereas different frames can have different size, type and number of bands. In Figure 2, we show an example of an image in JavaVis.
On the other hand, a geometric type frame manages information in a different way. For example, the Segment frame type just stores the coordinates of the initial and end points of a segment. A Segment frame may have several segment objects stored not into a pixel matrix but into a segment object list. So the representation of geometric frames is more compact and computations on this kind of images are faster. This kind of frames is useful in several computer vision algorithms. The available geometric types are: Point (xandycoordinates), Segment (two points), Edges (it represents a set of points forming an edge; they keep an adjacent relation, that is, thefirst point is adjacent to the second, the second to the third, and so on), and Poly (it contains a set of points forming a polygon; the points form a circular sequence).
An important point in JavaVis is the organization of its functions, as it is important for other users to be able to easily implement their algorithms in a standardized way. A function in JavaVis is an implementation of an algorithm together with its parameters, defined into a Java class. A function inherits from an abstract class JIPFunction. In order to implement an algorithm, only the function code must be developed and input and output parameters specified. That is one of the goals of the library: implements once, use everywhere. An algorithm is implemented and then the library is in charge of checking input and output parameters, showing images in the GUI, and so on. Below, we describe how an algorithm can be implemented.
As we said before, JavaVis2D has already implemented many computer vision algorithms. Although most of them were included by the JavaVis development team, some of them were implemented by undergraduate students who used JavaVis for their projects and needed to implement new functions. The maintainers of JavaVis have revised their work before its inclusion into thefinal JavaVis distribution. For example, we canfind functions for manipulation and color transforming, like AddNoise, Rotate, Mirror, Color-ToGray, RGBToColor, etc. We have also functions for convolution (ConvolveImage, Gabor), image adjustment (Equalize, Smooth, Brightness), segmentation (Binarize, Kmeans, MeanShift), geom-etry manipulation (InterSegment, RandomPoint), edges extraction (Canny, Susan, Grad), feature extraction (Junctions, HoughLine, MSER), mathematical morphology (Erode, Clousure), and others (Skeleton, Pca, Manhattan). During the years we were using JavaVis, several assignments were proposed to the students. Those assignments were incorporated into JavaVis, like the one for visual attention, license plate recognition, image database searching, etc. Best assignment implementations from students each year are incorporated to JavaVis, thus increasing the number of imple-mented algorithms and giving an additional incentive to the students.
In order to implement a new computer vision algorithm within JavaVis, we just need to create a Java Class and store it in the package javavis.jip2d.functions. As an example, we describe here the code to build an already implemented function, Binarize. This function has two input parameters, u1 and u2, indicating two thresholds. The result image is a Bit type image (0.1) where a given pixel is 1 if its original value is between the two input parameter values. As we said, a function class must belong to the javavis. jip2d.functions package, so thefirst lines in the new class will be: package javavis.jip2d.functions;
import block. . . . .
Then, the constructor of the class is declared. The constructor defines the name of the functions and its description (this values
Figure 2 A sequence in JavaVis having three frames. The second one is formed by several bands and the third one is geometric.
will be used as tool‐tips in the GUI). It also defines the function group to which the function belongs. Then, there is the definition of two parameters. Each parameter is defined with its name (it will be used to retrieve it), if it is required (false is not required) and if it is input or output parameter (true is input). The default value is useful for not required parameters. Finally, the parameters are added to the list of parameters of the function.
public Binarize() { super();
name¼"Binarize";
description¼ "Converts a BYTE image into binary image.";
groupFunc¼FunctionGroup.Segmentation;
ParamInt p1¼new ParamInt("u1", false, true); p1.setDefault(128);
p1.setDescription("Lower bound of the range to consider as 1");
ParamInt p2¼new ParamInt("u2", false, true); p2.setDefault(255);
p2.setDescription("Upper bound of the range to consider as 1");
addParam(p1); addParam(p2); }
Within the constructor, all the information is defined. Now, we need to develop the algorithm itself. It is done in the processImg method. The code below processes the image. It takes the two input parameters. At this moment, the user knows that values have been set, no matter from where this function will be called: GUI, command line or another function. The first action consists in checking whether the input image type is correct(Byte), giving an exception if that is not true. As the image could have several bands, the method is applied to any of them in the image. It gets all the pixels (getAllPixels), and processes it, pixel by pixel. Finally, the resulting image (res) is populated and returned.
JIPBmpBit res;
int lowT¼getParamValueInt("u1"); int upperT¼getParamValueInt("u2");
if (img.getType()¼¼ImageType.BYTE) {
int width¼img.getWidth();
int height¼img.getHeight();
int totalPix¼widthheight;
int numBands¼((JIPBmpByte)img).getNumBands();
res¼new JIPBmpBit(numBands, width, height);
long totalPerc¼totalPixnumBands;
for (int nb¼0; nb<numBands; nbþþ) {
double[] bmp¼((JIPBmpByte)img).getAllPixels
(nb);
boolean[] bin¼new boolean[totalPix];
for (int k¼0; k<totalPix; kþþ)
bin[k]¼(bmp[k]>¼lowT && bmp[k]<¼upperT); res.setAllPixelsBool(nb, bin);
}
} else
throw new JIPException("Function Binarize only defined for BYTE images.");
return res;
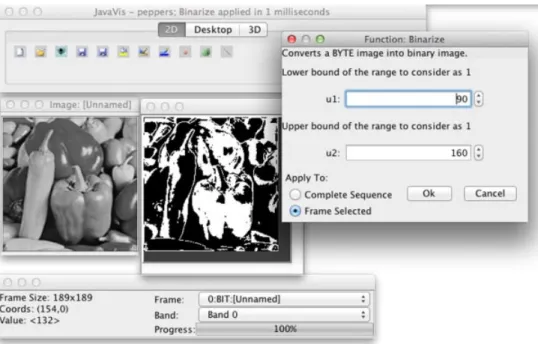
Figure 3 shows an execution of the Binarize function. When the function is executed, the parameters defined in the constructor are shown and the user can modify them. The user is able to apply the function to the frame selected or to the complete sequence of images.
We have prepared JavaVis to be able to process an image in two ways. Thefirst one is used when no relations among pixels are necessary, for example, in the previous function, when we process a pixel, only the information of that pixel is enough for processing it. In this case, we can get the complete array of pixel data and processing it with just one loop.
for (int i¼0; i<totalPix; iþþ) { bin[i]¼(bmp[i]>¼p1 && bmp[i]<¼p2);
The second way is the classical way: to visit all the rows and all the columns. The previous code can be substituted by: for (int r¼0; r<h; rþþ) { for (int c¼0; c<c; cþþ) { double p¼((JIPImgBitmap)img).getPixel(r,c); boolean b¼(p>¼p1 && p<¼p2); res.setPixelBool(c, r, b); } }
This has been used to teach an additional concept: using two different codes to perform the same task could imply having an execution time drastically different. Nowadays, computers have a huge processing throughput. Due to this, students do not care about efficiency. In some assignments, the processing time increases a lot if an additional loop is introduced. Students are greatly surprised when they optimize their code, for example, by eliminating unnecessary loops.
There are three ways to execute a function. Thefirst one is from command line: the Launch class can execute a function of the library, after the function name and its parameters are specified. This class checks the values entered (name, type, and range of the parameters) and returns an error if something is wrong. Otherwise, the function is executed. The execution takes an inputfile and generates an outputfile. The outputfile has the same sequence as the input file, where every frame has been processed with the function. The second way to execute a function is from the graphical user interface (see Fig. 4). A function can be executed by introducing the input parameters in a window and the parameters are checked too. Furthermore, the function can be applied to all the sequence or just to the current frame. The final way to use a function is from another function. Each function can use any existing function defined in the library. Note that despite the possibility of executing a function in three different ways, it is only defined once, and there is no need of additional configuration of the JavaVis environment but just adding the class for the function in a directory.
Another important issue regarding functions is the definition of parameters. A standard is defined for both input and output parameters for JIPFunctions. This is done by means of a class JIPParameter. Thus, the GUI can set and get parameters for any implemented JIPFunction.
JavaVisDesktop
Another feature we have recently incorporated to JavaVis is the JavaVisDesktop (see Fig. 5). The goal of this project is to build a utility which serves to better understand the partial results when processing an image. We can use different algorithms in order to get a complex one. For example, thefigure shows a sequence of functions applied to one image. The Desktop utility allows us to check partial results, showing the images obtained applying an algorithm.
This utility allows building a sequence of functions, as an automata. Each state in the sequence is a function (algorithm) from JavaVis2D library. A state shows the result (an image) of applying such algorithm. Thus, the student can easily adjust different parameters of an algorithm, observing what is the consequence of modifying that parameter in the complete sequence. Once the parameters are adjusted, there is an option to generate a new function in JavaVis2D directly. This new function will contain the sequence of functions in the desktop, with the selected parameters. JavaVisDesktop is an interesting tool to learn the behavior of the available algorithm. For example, the student is able to check what happens when applying the Canny algorithm using different values for its sigma parameter in order to understand its behavior and to select the optimum value for a given problem. In fact, this feature is greatly appreciated by the students, because it speeds up their implementations.
Figure 5 shows the GUI for the Desktop. The GUI is simple and easy to use. There is a canvas where functions can be placed. Every subwindow (a state) inside this canvas is a JavaVis function and the arrows indicate the operational sequence. It always must have afirst function called LoadImage (it is included when a new
project is created). Thisfirst function is used to load an image. The input of each subwindow is the output of the preceding one, except thefirst one, so we always need the LoadImage function at the beginning. A subwindow consists in the following: at the left hand, two buttons, Run (it executes the function to the input image) and Params (it allows to change the parameters to the function) and a colored circle in either red or green color. If it is green, it indicates that this function was already executed. If any parameter is changed, the circle changes back to red. At the right side, the result of applying the function is showed. If the user clicked on that part, a Figure 3 Applying Binarize to an image. The parameters are asked before applying the function. Right, result of the
execution. [Colorfigure can be viewed in the online issue, which is available at wileyonlinelibrary.com.]
Figure 4 Graphic user interface of JavaVis2D used to visualize images and to apply functions. The bottom window is for information: the coordinates of the cursor and the value of that pixel. It also allows changing the frame and the band inside the current frame. [Colorfigure can be viewed in the online issue, which is available at wileyonlinelibrary.com.]
floating window (like the ones in thefigure) appears containing the image.
Any function of the JavaVis2D part can be used, even the geometrical ones. In Figure 5a, sequence of three functions is shown: LoadImage, SmothGaussian, and Canny. In the same
figure, there is a window for changing parameters to the Canny function. This window is the same as the one used in JavaVis2D. The last two windows inside the canvas show the result of applying Canny with different parameters. That is the main feature of JavaVisDesktop: the student can try different parameters and compare the results in order to reach the best performance for his/ her implementation.
JavaVis3D
We have noted that several subjects explain algorithms which manage 3D data. Most of the basic 3D geometric entities have been implemented in the core of JavaVis3D. Points, vectors, normals, segments, and planes classes are included in a geometric package that allows JavaVis3D to operate with them, applying trans-formations, performing input/output operations, etc. Nevertheless, the user does not work with 3D geometric entities directly. The equivalent class for an image in JavaVis3D is the 3D geometric set. A 3D geometric set will include one or more objects from one of the basic 3D geometric class. Nevertheless it is possible to work with several heterogeneous sets at the same time as we can do with image sequences. For example, we can load a 3D point set captured from a scene using a stereo camera, computing these points to obtain the normal vector for the scene surfaces at every point and
finally storing this set of normal vectors in afile to be used in a future.
Some of the state‐of‐the‐art 3D algorithms have been also implemented in JavaVis3D such as ICP, that computes the transformation that best align two sets of 3D points, NormalSVD, that obtains the normal vector of the surfaces of a 3D scene
represented as a set of 3D points, PlanarPatch, that estimates planar patches for the planar surfaces of a set of 3D points and FastEgomotion3D that computes the six degrees of freedom transformation that best aligns two sets of 3D planar patches. There are also support functions for data smoothing or spatial transformations.
Thefile format used by JavaVis3D is different from the one used by JavaVis2D. 3D data are represented by its geometric properties such a list of coordinates and, if available, color information for a set of 3D points, a list of belonging points, a normal vector for planes, etc. File format starts with a header containing metadata information and after that the list of geometric elements, one for each line. The equivalent class in 3D for a sequence of images is the Trajectory3D class. A trajectory in Javavis3D consists in a bunch of 3D geometric sets. Furthermore, extra information can be provided with the trajectory in order to place the sets included in the trajectory into a common reference frame. This is useful, for example, if we need to represent together 3D scenes captured from a stereo camera at different poses in the same environment and the position of the camera at each pose is known. Adding new functions to JavaVis3D follows the same steps than in the 2D case. This homogeneous programming stile reduces learning efforts especially for those students that already know programming for the JavaVis2D part.
In addition, JavaVis3D is able to read data sets obtained from different 3D devices, like stereo cameras, 3D lasers, time‐of‐flight cameras such as SR4000 [19] or RGB‐D cameras such as Kinect [20]. Recently, we have prepared JavaVis to be able to capture data on thefly from the Kinect camera.
Current 3D implemented algorithms are:
Transform: Several data transformation. From3DTo2D, From3DToImage, FromImageTo3D, Transform.
Normals: Calculate the normals of a set of 3D points. NormalSVD, NormalSR4k.
Egomotion: Calculate the egomotion of a device (mobile robot) from time to time. Egomotion2D, Egomotion3D, ICP, FastICP, FastICPFeatures.
Model3D: Obtain 3D models, like planar patches, from a 3D point set. PlanePatch, Modelize, ProcessTrajectory.
Mapping: Obtain a 3D map from a trajectory. PointFilter, PointTrajectory.
Image: Get different images from a SR4000 camera. SR4kConfidence, SR4kIntensity.
Others: Several functions. SR4kProcess, DivideHorz, Di-videVert, DivideDepth, ErrorReductionStereo.
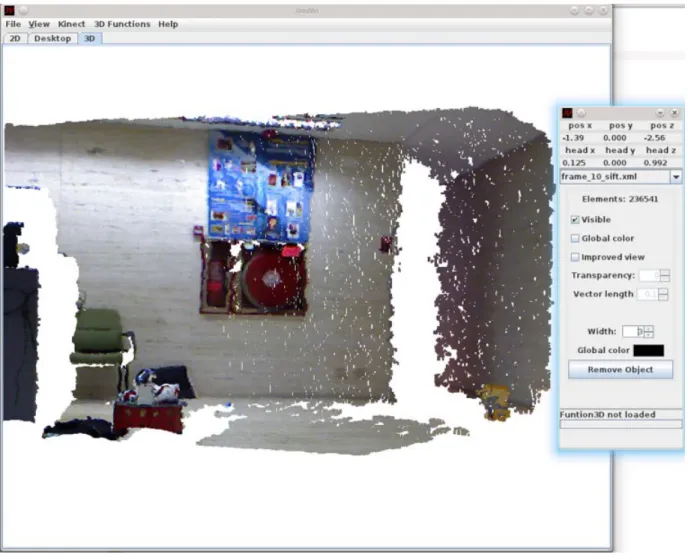
JavaVis3D also includes a specific GUI for showing the 3D data (see Fig. 6). This GUI is built using the 3D Java API Java3D. Java3D is a 3D library based on OpenGL which ensures that an efficient 3D graphics management and display is available for almost every operating system. 3D Data sets can be loaded/ unloaded into the GUI. It also provides tools for changing the way the 3D sets look. The point of view for the observer, it is said, the virtual camera, can be freely transformed by the user in order to have a better sight of the scene. The representation for geometric data can be also altered in size and color which can be useful for
visualization purposes. JavaVis3D GUI also provides an easy‐to‐ use method for launching different 3D functions over the 3D data. Teaching Experience With JavaVis
JavaVis has been used for years (since 2000) as the main tool for several Computer Vision related subjects (Artificial Intelligence (200 students/year), Computer Vision (20 students/year), Autono-mous Robots (50 students/year), some master’s subjects and severalfinal degree projects) at the University of Alicante (Spain). JavaVis has let us work at two different levels. First of all, using some of the most useful and used computer vision algorithms, as many of them are already implemented in JavaVis. At this level, students can observe what happens when the algorithm explained in theory classes is applied. Furthermore, the student can take a look at the implementation, thus obtaining a deeper understanding of the method explained in class. Then, a second level is available. Students can develop their own algorithms. At this level, we look for simplicity. It is necessary to know almost nothing about the library in order to program with JavaVis. They just must know the classes and methods for manipulating an image, but nothing about graphical classes or internalfile structure.
Figure 6 JavaVis3D framework. The right window shows the current pose of the camera. Using the keys we can navigate around the 3D scene. [Colorfigure can be viewed in the online issue, which is available at wileyonlinelibrary.com.]
Several different assignments have been proposed during the last 10 years. One example can be seen in Figure 7. In this assignment, students had to build a new function able to identify the number of coins in the image. Firstly, students used the Desktop to select the best parameters for the already available methods (Canny, Binarize, color format conversion) used for segmentation. Then, they generated a new JavaVis function and then developed a new method (Hough transform for circumferences). The result can be observed in Figure 7.
The practical sessions were conducted as follow. First, a short introduction to JavaVis (3 h) was presented. In this introduction, we remarked the main features of JavaVis and a guided example of using JavaVis was done. Then, we presented the practical assignment and proposed to use the Desktop to create a function based on already defined functions and set the parameters for those functions. After that, students had to implement the rest of the assignment, developing their own code. With this schema we afforded two goals: students had to check the behavior of several functions and they developed their own code, allowing to know the complexity of computer vision problems.
CONCLUSIONS
In this article, we have presented a framework for teaching computer vision: JavaVis. JavaVis is a multiplatform framework written in Java. It is divided into three parts. First, JavaVis2D is used to process 2D images. It has several very interesting features, such as image format, image sequence processing and geometrical image type. Then, Javavis3D supports 3D data, such as 3D points, planes, trajectories, etc. Finally, JavaVisDesktop allows students to understand what happens when parameter values are changed and it also allows developing easily a new algorithm based on already developed ones. Although other computer vision frameworks have better performance and more implemented algorithms, JavaVis has some interesting features which provide to the students a better way to learn computer vision related subjects. One of them is that it is easy to use and learn, thus it is easy to implement new methods. Another
one is that students can easily take a look at the source code, so it provides a learning help. JavaVis has been used for years in several computer vision related subjects at University of Alicante (Spain). As future work, we plan to merge JavaVis with OpenCV and PCL, providing a teaching GUI to those libraries. We are also planning to continue incorporating new computer vision algo-rithms and whatever features we identify in our teaching.
ACKNOWLEDGMENTS
This work was supported by project GRE10‐35 from Universidad de Alicante (Spain) and grant GITE‐09017‐UA of University of Alicante.
REFERENCES
[1] JavaVis web site (2013), http://javavis.sourceforge.net
[2] D. Viejo, Modelización Robusta de Entornos Estructurados, una Aplicación al Mapeado 3D en Robótica Móvil, PhD Thesis, University of Alicante, Alicante, Spain.
[3] Khoral (2013), http://www.khoral.com
[4] Open source computer vision library (2013), http://opencv. willowgarage.com/wiki
[5] The Vigra library website (2013), http://kogs‐www.informatik.uni‐ hamburg.de/koethe/vigra
[6] M. Zuke and S. E. Umbaugh, CVIPtools: A software package for computer imaging education, Comput Appl Eng Educ 5 (1997), 213– 220.
[7] S. E. Umbaugh, Digital image processing and analysis: Human and computer vision applications with CVIPtools, 2nd ed., CRC Press, Taylor & Francis Group, Boca Raton, FL, 2011, 956 p, ISBN: 9781439802052, http://cviptools.ece.siue.edu/
[8] Point Cloud library (2013), http://pointclouds.org/
[9] Java imaging and graphics library (2013), http://rivit.cs.byu.edu/jigl [10] The java advanced imaging website (2013), http://java.sun.com/
products/java‐media/jai
[11] D. Lyon, Image processing in Java, Prentice Hall, Upper Saddle River, NJ, 1999.
[12] The java vision toolkit website (2013), http://marathon.csee.usf.edu/
mpowell/jvt
[13] The ImageJ website (2013), http://rsb.info.nih.gov/ij
[14] G. Bebis, D. Egbert, and M. Shah, Review of computer vision education, IEEE Trans Educ 46 (2003), 2–21.
[15] C. H.‐W. Yapp and A. K. B. See, Teaching image processing: A two‐ step process, Comput Appl Eng Educ 16 (2008), 211–222. [16] J. F. Martin and L. Chiang, Low cost vision system for an educational
platform in artificial intelligence and robotics, Comput Appl Eng Educ 10 (2002), 238–248.
[17] T. Baloukas, JAVENGA: JAva‐based Visualization Environment for Network and Graph Algorithms, Comput Appl Eng Educ 20 (2012), 255–268.
[18] C. A. Jara, F. A. Candelas, J. Pomares, and F. Torres, Java software platform for the development of advanced robotic virtual laboratories, Comput Appl Eng Educ 21 (2011), 14–30.
[19] The Vista website (2013), http://www.cs.ubc.ca/nest/lci/vista/vista. html
[20] S. May, D. Droeschel, D. Holz, S. Fuchs, E. Malis, A. Nüchter, and J. Hertzberg, Three‐dimensional mapping with time‐of‐flight cameras, J Field Robot (Special Issue on Three‐Dimensional Mapping, Part 2) 26 (2009), 934–965.
Figure 7 An example of assignment: counting coins. [Colorfigure can be viewed in the online issue, which is available at wileyonlinelibrary.com.]
BIOGRAPHIES
Miguel Cazorla received a BS degree in Computer Science from the University of Alicante (Spain) in 1995 and a PhD in Computer Science from the same University in 2000. He is currently Associate Professor with the Depart-ment of Computer Science and Artificial Intelli-gence of the University of Alicante. He has published several papers on robotics and com-puter vision. His research interest areas are computer vision and mobile robotics (mainly using vision to implement robotics tasks).
Diego Viejo obtained his Bachelor Degree in Computer Science in 2002 and his PhD. in 2008 both from the University of Alicante. Since 2004, he is a lecturer and a researcher for the Department of Computer Science and Artificial Intelligence (DCCIA) at the University of Alicante. His research interests are focused on 3D vision applied on mobile robotics.
![Figure 1 The three main parts integrated in JavaVis. [Color figure can be viewed in the online issue, which is available at wileyonlinelibrary.com.]](https://thumb-us.123doks.com/thumbv2/123dok_us/10112256.2911794/3.918.102.788.545.1042/figure-integrated-javavis-color-figure-viewed-available-wileyonlinelibrary.webp)
![Figure 5 JavaVisDesktop. [Color figure can be viewed in the online issue, which is available at wileyonlinelibrary.com.]](https://thumb-us.123doks.com/thumbv2/123dok_us/10112256.2911794/7.918.176.717.676.1054/figure-javavisdesktop-color-figure-viewed-online-available-wileyonlinelibrary.webp)
![Figure 7 An example of assignment: counting coins. [Color figure can be viewed in the online issue, which is available at wileyonlinelibrary.com.]](https://thumb-us.123doks.com/thumbv2/123dok_us/10112256.2911794/9.918.108.428.106.346/figure-example-assignment-counting-color-figure-available-wileyonlinelibrary.webp)
