©
DOI: 10.1534/genetics.104.037325
Efficiency of the Use of Pedigree and Molecular Marker Information
in Conservation Programs
Jesu´s Ferna´ndez,*
,1Beatriz Villanueva,
†Ricardo Pong-Wong
‡and Miguel A
´ ngel Toro*
*Departamento de Mejora Gene´tica Animal, Instituto Nacional de Investigacio´n y Tecnologı´a Agraria y Alimentaria, 28040 Madrid, Spain, †Sustainable Livestock Systems Group, Scottish Agricultural College, Edinburgh, EH9 3JG, United Kingdom and
‡Genetics and Genomics, Roslin Institute (Edinburgh), Roslin, Midlothian EH25 9PS, United Kingdom
Manuscript received October 8, 2004 Accepted for publication March 25, 2005
ABSTRACT
The value of molecular markers and pedigree records, separately or in combination, to assist in the management of conserved populations has been tested. The general strategy for managing the population was to optimize contributions of parents to the next generation for minimizing the global weighted coancestry. Strategies differed in the type of information used to compute global coancestries, the number and type of evaluated individuals, and the system of mating. Genealogical information proved to be very useful (at least for 10 generations of management) to arrange individuals’ contributions via the minimiza-tion of global coancestry. In fact, the level of expected heterozygosity after 10 generaminimiza-tions yielded by this strategy was 88–100% of the maximum possible improvement obtained if the genotype for all loci was known. Marker information was of very limited value if used alone. The amount and degree of polymor-phism of markers to be used to compute molecular coancestry had to be high to mimic the performance of the strategy relying on pedigree, especially in the short term (for example,⬎10 markers per chromosome with 10 alleles each were needed if only the parents’ genotype was available). When both sources of information are combined to calculate the coancestry conditional on markers, clear increases in effective population size (Ne) were found, but observed diversity levels (either gene or allelic diversity) in the early generations were quite similar to the ones obtained with pedigree alone. The advantage of including molecular information is greater when information is available on a greater number of individuals (offspring and parentsvs.parents only). However, for realistic situations (i.e., large genomes) the benefits of using information on offspring are small. The same conclusions were reached when comparing the use of the different types of information (genealogical or/and molecular) to perform minimum coancestry matings.
T
HE maintenance of high levels of genetic variability sure of variability is allelic diversity (AD), or allelic rich-ness (i.e., the number of different alleles at a particular and low levels of inbreeding is a major objective inlocus, or the average over loci, present in the popula-conservation programs. Genetic variation is a
prerequi-tion). High levels of AD are essential for the long-term site for populations to be able to face future
environ-evolutionary potential of populations because the limit mental changes and to ensure long-term response to
of selection response is determined by the initial num-selection, either natural or artificial, for traits of
eco-ber of alleles (assuming that mutation is negligible), nomic or cultural interest (Frankhamet al.2003). Also,
regardless of the allelic frequencies (James1971;Hill
inbreeding levels should be kept as low as possible to
andRasbash1986). avoid deleterious effects on fitness-related traits, which
Loss of alleles in small populations, as in those under could compromise the viability of the populations.
conservation programs, is mainly driven by genetic drift. The classical criterion used to quantify genetic
vari-Moreover, the increase of inbreeding under random ability has been the expected heterozygosity (Nei1973),
mating is also a function of population size. Inbreeding usually called gene diversity (GD). GD represents the
refers to the probability of identity by descent (IBD) in expected proportion of heterozygotes if the population
a locus. In simulation studies, like the present one, this were in Hardy-Weinberg equilibrium and is directly
re-probability can be calculated by counting if we assign lated to the amount of additive genetic variance for
different alleles to all individuals in the base population. quantitative traits (FalconerandMackay1996). From
The magnitude of the effect of genetic drift under an evolutionary perspective, another important
mea-different management strategies is really dependent on the effective population size (Ne;Falconerand
Mac-kay1996), instead of on the census size. Usually,Neis 1Corresponding author:Departamento de Mejora Gene´tica Animal,
calculated through the increase of inbreeding in the
Instituto Nacional de Investigacio´n y Tecnologı´a Agraria y
Ali-population asNe ⫽1/2⌬F, where⌬Fis the rate of
in-mentaria, Crta. A Corun˜a Km. 7,5, 28040 Madrid, Spain.
E-mail: [email protected] breeding. When management is based on genealogical
information,⌬Fsoon reaches an asymptotic value (Fal- ignored the consequences of each strategy on the levels
conerandMackay1996;Wang1997). Therefore, the of GD and inbreeding at shorter time horizons, which effective population size (Ne) has been often used as a are determinants of the adaptation ability of the popula-measure of the long-term performance of the popula- tion and of the inbreeding depression in fitness-related tion regarding both diversity and inbreeding. However, traits.
when decisions are made only on the basis of marker Nonrandom mating systems have proven to be effi-information, Neloses usefulness as it does not reach a cient for increasing Ne (Caballero et al. 1996) and constant value, but increases as generations go by (Toro therefore for maintaining genetic variability and
con-et al. 1999). This effect is not observed when both trolling inbreeding levels. In particular, minimum sources of information (pedigree and molecular mark- coancestry matings, which minimize the average
pair-ers) are used. wise coancestry between couples (Toro et al. 1988),
There is a consensus on the optimal way to manage have proven to be, in some cases, effective in reducing GD when the pedigree of the population is available F-levels when only pedigree information is used in arti-(BallouandLacy1995;CaballeroandToro2000; ficial selection (SonessonandMeuwissen2000, 2002)
Ferna´ndezet al.2003). In this scenario, the best strategy and conservation programs (Ferna´ndez and Cabal-is to optimize contributions of parents (i.e., number of lero2001;SonessonandMeuwissen2001). However, offspring that each individual leaves to the next genera- nonrandom mating systems have not been evaluated tion) by minimizing the global coancestry weighted by when molecular information is used to compute coan-those contributions. Furthermore, under random mat- cestries.
ing, this strategy also implies the maximization of effec- The objective of this study was to evaluate the effi-tive population size (Ne) (CaballeroandToro2000, ciency of the use of molecular markers and pedigree 2002). In a parallel way, when only molecular marker information (separately or in combination) on the (rather than genealogical) information is available, the maintenance of genetic diversity and the control of in-optimal strategy for maintaining GD is to minimize the breeding in conserved populations. Both sources of in-global molecular coancestry, as defined below (Toro formation were considered for optimizing contributions et al. 1999). When both genealogical and molecular of parents and for optimizing matings between selected information is available, it can be combined to calculate parents.
the coancestry conditional on markers (Toroet al.1999;
Wang2001). In this way, markers can help to ascertain the global “realized” coancestry from the “expected”
METHODS coancestry provided by the pedigree.
Inex situconservation programs, space resources are Population and genetic models
limited. One possible procedure is to generate only the
Populations of constant census sizeN⫽ 18 (Nm⫽9 individuals that are going to be kept. Consequently,
males and Nf ⫽ 9 females) or N ⫽ 27 (Nm ⫽ 9 and decisions on contributions have to be made on the basis
Nf⫽ 18) were modeled through stochastic computer of parents’ information. Another possibility is to
gener-simulations. ate a large number of offspring that will exceed the
The genome of individuals consisted of 1 or 20 chro-maximum number that can be kept, and some of them
mosomes. Chromosome length was 1 M. Each chromo-have to be discarded. Notwithstanding, molecular
infor-some carried 100 evenly spaced loci that were used to mation on the surplus offspring could be used together
evaluate genetic diversity parameters. A random num-with parental information to help in breeding decisions.
ber of crossovers (Poisson distributed with mean one) This is more likely to be done with highly prolific
spe-were assumed in randomly chosen places without inter-cies. Under the last scenario, Toro et al. (1999) and
ference when obtaining gametes.
Wang(2001) shown that the use of coancestry
condi-All individuals in the base population were assumed to tional on markers to decide the selected offspring to
be unrelated and not inbred. Therefore, all base popula-be kept as breeders could yield effective population sizes
tion individuals carried two different alleles at each locus ⬎40% larger than those obtained using only pedigree
and GD and AD were at their maximum values (1⫺1/ coancestry (Wang2001). Both studies consider that all
2N and 2N, respectively). In most scenarios manage-parents contributing to the next generation had the
ment strategies started in the base population. However, same number of offspring. However, differential
contri-in some simulations, five unmanaged generations (with butions of parents have proven to be very efficient for
random contributions and matings) were performed managing the rate of inbreeding (Ferna´ndezandToro
prior to the application of any management strategy. 1999;Villanuevaet al.2004). Also, the studies ofToro
These simulations aimed to evaluate the effect of
differ-et al.(1999) andWang(2001) focused on the
compari-ent amounts of diversity prescompari-ent in the population when son between different management strategies for Ne
the conservation program starts on the relative perfor-and, therefore, they referred to a time horizon where
more realistic scenarios as, in practice, relationships differ between individuals.
In addition to the 100 multiallelic loci, 1–100 evenly distributed markers were simulated per chromosome. Each marker position coincided with the position of one of the multiallelic loci. The number of alleles per marker ranged from 2 (modeling the typing of low polymorphic markers such as SNPs) to 10 (e.g., micro-satellites). In generation zero (where the population starts to be managed), marker alleles were assigned at random with the same probability.
Management strategies
As a reference for comparison, unmanaged popula-tions (random contribupopula-tions and random mating; R) were simulated for each value ofN.
For the rest of the cases, the general strategy for managing the population was to maximize the expected heterozygosity (GD). This was achieved by minimizing
the global weighted coancestry, calculated as Figure 1.—Scheme of the two simulated scenarios de-pending on the number and type of the individuals evaluated (genotyped).
1 4
兺
Tm
i⫽1
兺
Tm
j⫽1
xixjfi j
T2 m
⫹ 1
2
兺
Tm
i⫽1
兺
Tf
j⫽1
xixjfi j
TmTf
⫹ 1
4
兺
Tf
i⫽1
兺
Tf
j⫽1
xixjfi j
T2 f
,
wherexi is the contribution from individuali,fij is the
The total number of evaluated individuals was 72 (36 coancestry between individuals i and j (computed in
of each sex) and therefore Tm ⫽ Tf ⫽ 36. This case different ways as described below) andTm and Tfare,
corresponds to the situation where more individuals respectively, the numbers of males and females
evalu-than needed are born. To make the results comparable, ated. Several restrictions were imposed in the
optimiza-it should be noted that the number of individuals kept tion: (i) only integer nonnegative solutions were
al-in the population (N,i.e., the number of selected/con-lowed; (ii) the sum of all contributions equaled twice
tributing individuals) was forced to be the same as in the total number of individuals evaluated (Tm ⫹ Tf);
the first scenario. To achieve this, an additional restric-and (iii) half of the contributions arose from males restric-and
tion was imposed in the optimization, allowing a maxi-half from females. Optimal solutions for contributions
mum number of 9 males and 9 or 18 females to contrib-were obtained via asimulated annealingalgorithm (
Kirk-ute to the next generation (the rest of the evaluated
patricket al.1983).
individuals had zero contributions). The number of off-Management strategies were applied for 10 discrete
spring per parent was not fixed, but was also optimized generations (in addition to the 5 unmanaged
genera-at the same time. Figure 1 shows a scheme of both tions in some cases). These strategies differed in the
scenarios for the case ofNm⫽Nf⫽9). number and type of evaluated individuals, in the type
The efficiency of the second scenario was expected of information used to compute global coancestries,
to be higher than that of the first scenario, as a larger and in the system of mating.
number of evaluated individuals were available, and
Evaluated individuals: Two different scenarios were
higher than that in the work byToroet al.(1999) and considered.
Wang(2001) as selected individuals with lower mean
Parents genotyped: In the first scenario, the decisions
coancestry produced more offspring to be evaluated about the optimal individual contributions to the next
than did those highly related with the rest of the popula-generation were based on information on potential
par-tion (it would be not very likely to select many offspring ents. Thus, the number of evaluated individuals (i.e.,
from that individual). the number of individuals included in the optimization)
Information used for computing coancestry: Differ-was equal to the number of individuals kept in the
ent strategies were evaluated and named according to population as breeders (Nm⫽ Tm ⫽9 males andNf⫽
the type of coancestry used in the optimization.
Tf⫽9 or 18 females).
Pedigree (fP): Coancestries were calculated from the
Offspring genotyped: In the second scenario, available
genealogy only, including unmanaged generations in parents produced several offspring that were genotyped.
the scenarios where they were simulated. This repre-Then, the individuals to keep as breeders for the next
sented the expected IBD for the whole genome. generation were decided on the basis of offspring
marker information only. Molecular coancestry between constant, asymptotic value, as was stated in the Introduc-tion.
two individuals is defined in a similar way to Malecot’s definition but referring to identity by state (IBS), which is the probability that two alleles, taken at random from
RESULTS the same locus in two individuals, are equal. Values were
Random mating:Table 1 shows the expected hetero-averaged across marker loci.
zygosity (GD, averaged over all nonmarker loci across
Conditional on markers (fPM):Coancestries were
calcu-the genome) at generation 10 and calcu-the effective popula-lated by combining molecular and genealogical
infor-tion size (Ne) yielded by each management strategy for mation using the method proposed by Pong-Wonget
Nm⫽Nf⫽9 and different combinations of number of
al.(2001). The IBD was estimated every 5 cM (i.e., at
chromosomes (c), number of markers typed per chro-20 positions in each chromosome), and it was averaged
mosome (m), and number of alleles per marker (a). across positions. Preliminary simulations computing
Results presented correspond to the case where the coancestry at 100 positions per chromosome produced
starting population was constituted by unrelated and the same results in the levels of genetic diversity (data
noninbred individuals. Scenarios with differential rela-not shown). Using coancestry computed only at 20
posi-tionships between individuals at the beginning of the tions, however, reduced the computation time
consider-conservation program and those with larger census sizes ably.
(Nm ⫽ 9 and Nf ⫽ 18) produced very similar trends
Genomic (fG):Coancestries were calculated from
infor-to those presented in Table 1 and are, therefore, not mation on all positions in the genome. This situation
shown. corresponds to scenarios where the genotype for all loci
The upper limit of efficiency (measured as the level of the genome is known and, therefore, it establishes
of GD maintained), provided by minimizing fG, was the upper theoretical limit of efficiency for any strategy.
lower for large than for small genomes. Similarly, when As all individuals carried two different alleles in each locus
coancestry was computed using both pedigree and mo-in the base population,fGrepresented the real IBD.
lecular markers (i.e., fPM), lower levels of GD were
ob-Mating systems: The performance of the different
served for genomes of 20 chromosomes. However, strategies was evaluated by (i) optimizing the
contribu-rather paradoxically, the opposite trend was observed in tions of parents to the next generation and mating the
some situations for strategies relying only on molecular parents at random and (ii) combining the optimization
information (i.e.,fM; for example,a ⫽10,m⫽1). of contributions with minimum coancestry matings. In
The efficiency in the short and medium term of using the latter situation, the type of information (i.e., the
only pedigree information when optimizing contribu-type of coancestry) used in both optimizations
(“selec-tions is clear from the values of GD maintained in the tion” and mating) was the same. A particular case was
population after 10 generations (Table 1). In fact, the simulated where selection decisions were based only on
values of GD obtained with this strategy were 88–100% pedigree information but mating decisions were based
of the maximum attainable increase (i.e., obtained by on both pedigree and molecular information. The a
minimizing fG). For large genomes (i.e., c ⫽ 20), the
prioriadvantage of this strategy (relative to the strategy
pedigree-based strategy achieved nearly the highest pos-using pedigree and marker information jointly in both
sible diversity (i.e., the same as fG), and consequently selection and mating decisions) is the lower number of
adding molecular information provided little or no ex-individuals to be genotyped for the markers. Asimulated
tra benefit. Note that, when dealing with genealogies
annealingalgorithm (Kirkpatricket al.1983) was also
alone, no improvement is expected from using offspring used to optimize matings.
information as pedigree relationships are equal for all individuals within the same family.
When only molecular information (fM) from parents
Parameters evaluated
was assumed to be available, the number of markers The expected heterozygosity (GD), AD, and inbreed- needed to reach the same levels of GD as with genealogi-ing level (F, the proportion of homozygous loci observed cal information only (i.e.,fP) was very high. Differences in the population) were calculated each generation for betweenfMandfPwere more evident with biallelic mark-the breeding individuals using all loci, and mark-they were aver- ers, but even with a ⫽ 10, 5–10 markers per Morgan aged over 100 (for genomes of 1 chromosome) or 50 (for were required forfMto give levels of GD similar to those genomes of 20 chromosomes) replicates. The effective obtained withfP(Table 1). The levels of GD obtained population size (Ne) was calculated asNe⫽1/2⌬F, where when usingfM improved when the offspring was geno-⌬Fwas the average rate of inbreeding,⌬F⫽(Ft⫹1⫺Ft)/ typed (i.e., when 72 individuals were evaluated), but still (1 ⫺ Ft), from generations t ⫽ 5 tot ⫽ 10. The latter a considerable number of markers per morgan (ⱖ5) was not calculated when the decision criteria were the were required for some schemes to outperform the pedi-molecular coancestry (fM) or the genomic coancestry gree-based method.
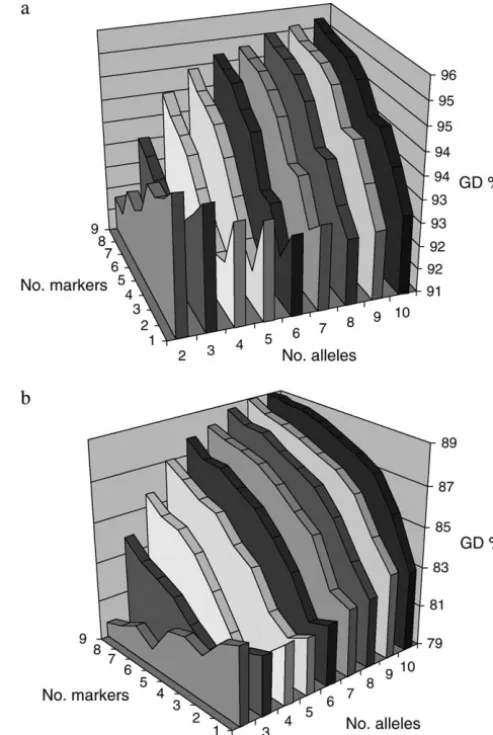
Figure2.—Genome-wide expected heterozygosity (GD %) maintained by minimizing molecular coancestry for different numbers of markers and alleles per marker. Only parents were genotyped. The genome length was 1 M,Nm⫽Nf⫽9, and matings were at random. (a) After one generation of manage-ment. (b) after five generations of managemanage-ment.
genotyped, the levels of GD obtained through the exclu-sive use of markers were even lower than the levels achieved in unmanaged populations. Moreover, we found another counterintuitive behavior of markers when the number of these was scarce and/or their de-gree of polymorphism was low. In such situations, in-creases in the number of markers (or alleles per marker) led to lower levels of maintained genetic diversity (e.g.,
c⫽1 anda ⫽2 with only parents genotyped). Figure 2 shows the levels of GD kept in a population withNm⫽
Nf⫽ 9, after one or five generations of management, when different numbers of markers and alleles per marker are used to calculate molecular coancestry. It is clear that, for some combinations ofmanda, increasing the number of markers or their degree of polymorphism was counterproductive, as the larger the number of markers (or the number of alleles per marker) used, the lower the expected heterozygosity maintained (even
TABLE 1 Genome-wide expected heterozygosity (GD, in percentage) at generation 1 0 a nd effective population size ( Ne ) Parents genotyped Offspring genotyped fM fPM fM fPM ca R fP fG m ⫽ 1 m ⫽ 5 m ⫽ 10 m ⫽ 1 m ⫽ 5 m ⫽ 10 fG m ⫽ 1 m ⫽ 5 m ⫽ 10 m ⫽ 1 m ⫽ 5 m ⫽ 10 GD 1 2 73.93 84.09 87.22 71.72 69.53 68.51 84.01 84.91 85.09 9 5.11 74.90 7 4.04 76.45 84.82 88.67 90.46 10 73.99 82.75 84.45 84.44 86.58 86.84 7 8.12 87.84 90.35 87.75 91.82 92.71 20 2 84.09 68.08 77.97 80.39 84.00 83.98 84.00 8 6.46 74.99 8 1.89 83.15 83.52 84.26 84.82 10 80.28 83.24 83.76 84.02 83.99 84.12 8 3.35 85.27 85.72 84.17 85.55 85.94 Ne 1 2 18.61 35.67 33.14 39.10 49.97 38.02 48.69 69.31 10 41.66 45.14 56.49 45.01 103.31 1 81.83 20 2 35.27 34.94 35.66 33.57 33.37 39.91 10 34.03 34.87 34.15 36.03 44.28 47.19 Population w ith Nm ⫽ Nf ⫽ 9 under random mating is shown. Management strategies: R , random; fP , p edigree coancestry; fG , g enomic coancestry; fM , molecular coancestry; and fPM , coancestry conditional o n m arkers. c , number o f chromosomes; a , number o f alleles per m arker; m , number o f markers per chromosome. S tandard errors range from 0.04 to 0.52 for G D a nd from 0.47 to 4.78 for Ne .
performance was more evident for small genomes (Ta-ble 1) and in the short term (Figure 2), but the effect could last as long as 10 generations in extreme cases (Table 1).
When information on offspring’s markers is available, the performance of the strategy usingfMimproved and GD levels after 10 generations were higher than those for unmanaged populations even with only one biallelic marker per chromosome.
As mentioned above, the levels of GD obtained by minimizingfPwere close to the maximum expectations (i.e., by minimizingfG), leaving, thus, a narrow margin of improvement for molecular information. The inclu-sion of marker information into the management strat-egy, via the coancestry conditional on markers (i.e.,fPM), hardly gave extra gains, if any, relative to using pedigree alone when the only available information is that from parents (Table 1). However, for small genomes and using offspring information, important increases inNe were observed when molecular information was com-bined with pedigree information (relative to theNe ob-tained by using fP). For large genomes (c ⫽ 20) the values obtained for Ne with fPM were not significantly different from those obtained with fP when decisions were made on parents’ genotype or on offspring’s geno-type with little marker information (i.e.,a⫽2 andm⫽
1 or 5).
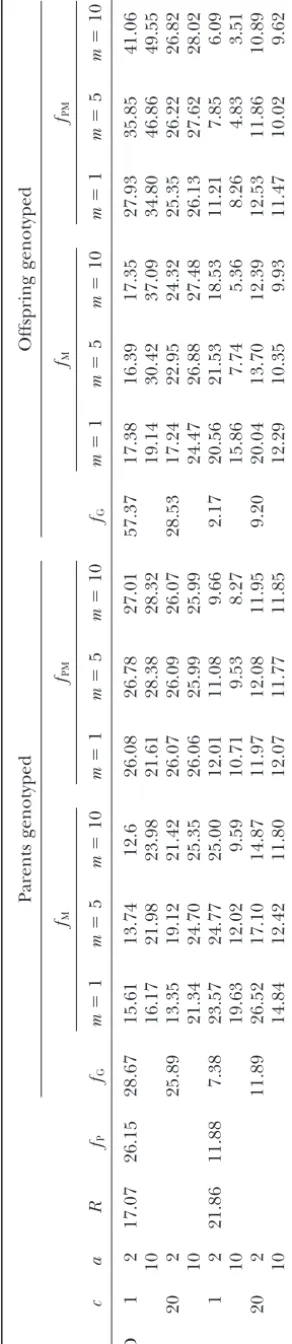
AD and inbreeding (F) showed a parallel behavior to that of GD (Table 2). Most of the increase in AD and most of the decrease in F relative to unmanaged populations were due to the use of genealogical infor-mation, and little improvement was observed when in-cluding molecular information, especially for large ge-nomes. If the genome was small (c⫽ 1) and offspring information was used, greater advantages were obtained via the minimization offPM.
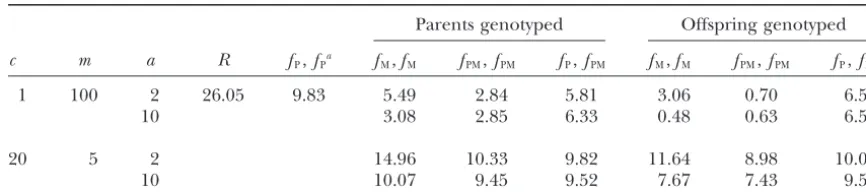
Optimized mating:Table 3 shows the inbreeding coef-ficient at generation 10 when contributions and matings were both optimized. Two situations are presented: one (more theoretical, to illustrate upper limits of perfor-mance) with 100 markers in just 1 chromosome and another one (more practical) with 20 chromosomes and 5 markers on each. The inbreeding obtained in unmanaged populations (R) is also shown for compari-son. The levels of GD obtained when the mating scheme was also managed are not shown because, as expected, they were the same as those found with random mating. It can be proven that, once contributions have been decided, the global coancestry in the next generation is independent of the mating design.
The good performance of the pedigree-based strategy and the limited ability of marker-based strategies to im-prove the former were again clear in the more realistic situation (large genomes and few markers genotyped). In general, the lowest inbreeding was achieved when both pedigree and molecular information were used to
TABLE 2 Genome-wide allelic diversity (AD, in percentage) and inbreeding coefficients ( F , in p ercentage) at generation 1 0 Parents genotyped Offspring g enotyped fM fPM fM fPM ca R fP fG m ⫽ 1 m ⫽ 5 m ⫽ 10 m ⫽ 1 m ⫽ 5 m ⫽ 10 fG m ⫽ 1 m ⫽ 5 m ⫽ 10 m ⫽ 1 m ⫽ 5 m ⫽ 10 AD 1 2 17.07 26.15 28.67 1 5.61 1 3.74 12.6 26.08 26.78 27.01 57.37 1 7.38 16.39 17.35 27.93 35.85 41.06 10 16.17 2 1.98 23.98 21.61 28.38 28.32 19.14 30.42 37.09 34.80 46.86 49.55 20 2 2 5.89 1 3.35 1 9.12 21.42 26.07 26.09 26.07 28.53 1 7.24 22.95 24.32 25.35 26.22 26.82 10 21.34 2 4.70 25.35 26.06 25.99 25.99 24.47 26.88 27.48 26.13 27.62 28.02 F 1 2 21.86 11.88 7.38 2 3.57 2 4.77 25.00 12.01 11.08 9.66 2.17 2 0.56 21.53 18.53 11.21 7.85 6.09 10 19.63 1 2.02 9.59 10.71 9.53 8.27 1 5.86 7.74 5.36 8.26 4.83 3.51 20 2 1 1.89 2 6.52 1 7.10 14.87 11.97 12.08 11.95 9.20 2 0.04 13.70 12.39 12.53 11.86 10.89 10 14.84 1 2.42 11.80 12.07 11.77 11.85 12.29 10.35 9.93 11.47 10.02 9.62 Population w ith Nm ⫽ Nf ⫽ 9 under random mating is shown. Management criteri: R , random; fP , p edigree coancestry; fG , g enomic coancestry; fM , molecular coancestry; and fPM , coancestry conditional o n m arkers. c , number o f chromosomes; a , number o f alleles per m arker; M , number of markers per chromosome. Standard errors range from 0.04 to 0.42 for allelic diversity and from 0 .05 to 0 .25 for inbreeding.
TABLE 3
Inbreeding coefficient (F, in percentage) at generation 10 under minimum coancestry mating
Parents genotyped Offspring genotyped
c m a R fP,fPa fM,fM fPM,fPM fP,fPM fM,fM fPM,fPM fP,fPM
1 100 2 26.05 9.83 5.49 2.84 5.81 3.06 0.70 6.55
10 3.08 2.85 6.33 0.48 0.63 6.54
20 5 2 14.96 10.33 9.82 11.64 8.98 10.06
10 10.07 9.45 9.52 7.67 7.43 9.55
Population withNm⫽Nf⫽9 under random mating is shown. Management criteria:R, random;fP, pedigree coancestry;fM, molecular coancestry; andfPM, coancestry conditional on markers.c, number of chromosomes; m, number of markers per chromosome;a, number of alleles per marker. Standard errors range from 0.06 to 0.30.
aThe first element in column headings is the criterion used to determine contributions and the second
element is the one used to arranged matings.
genotype was available. The main finding when compar- assigned at random and, thus, there was no direct rela-tionship between the real (i.e., genomic) coancestry and ing randomvs. nonrandom mating (Table 2vs. Table
3) is that the effect of avoiding mating between relatives the molecular coancestry. However, just by chance, some individuals could be less/more marker related is small in practical scenarios. In fact, the reduction in
levels ofF at generation 10 is onlyⵑ2–3%. with the rest of the population (i.e., lower/higher aver-agefM) and they would be erroneously favored/penal-ized. This was more likely with an intermediate number DISCUSSION
of alleles than with low (high) polymorphic markers. Therefore, going from very low to intermediate poly-This article has investigated the efficiency of
molecu-morphic markers led to more wrong decisions and, thus, lar markers and pedigree records, separately or in
com-to lower levels of genetic diversity maintained. As the bination, to assist in the management of conserved
pop-number of generations increased, real relationships be-ulations. The results have shown that genealogical
tween molecular coancestry and coancestry at positions information proves to be a very powerful tool for
main-near the markers were established and, therefore, deci-taining genetic diversity and low levels of inbreeding
sions based on markers became more effective. The via the minimization of global pedigree coancestry, at
greater the number of alleles, the sooner these relation-least for the period of time considered (10 generations).
ships were generated. In nonequilibrium situations, the In fact, levels of expected heterozygosity yields by such
performance of molecular-based methods would de-a strde-ategy were 88–100% of the mde-aximum possible levels
pend on the particular degree of disequilibrium and the obtained if all loci in the genome were genotyped (i.e.,
way it is generated. A similar argument can be invoked to the levels obtained by minimizingfG). The minimization
explain the observation of decreased genetic diversity offPwas equally efficient for maintaining allelic diversity
maintained, in some situations, when increasing the and this agrees with previous results of Ferna´ndez et
number of markers for a given number of alleles per
al. (2004) showing that strategies directed to
main-marker. In this case, the number of different haplotypes taining GD are also efficient in maintaining AD.
is the key parameter, playing the role of the number of On the other hand, the exclusive use of marker
infor-alleles in the previous explanation. mation was of limited value for the maintenance of
The other paradoxical result related to the minimiza-genetic diversity. The amount and degree of
polymor-tion offM (i.e., better performance for large genomes phism of markers to be used to compute molecular
in some situations) is also a consequence of markers coancestry had to be very high to mimic the
perfor-being in linkage equilibrium with other loci in the base mance of the strategy relying on pedigree coancestry
population. Although diversity in the markers follows in the short-term and still moderate in the long-term
the logical trend, behavior in the rest of the genome horizon, especially for large genomes. Moreover, we
depends on how fast disequilibrium is generated, which found an unexpected behavior of markers. When the
is a function of the number of markers and their degree “quality” of molecular information was low (i.e., the
of polymorphism. number of markers and/or the number of alleles per
Finally, another fact should be pointed out relative marker was low), increasing the amount of information
to the use of molecular information alone. When mini-could lead to decreased levels of genetic diversity in the
mization offM (orfG) is the chosen strategy,Ne is not population. The reason for this performance could be
reach an asymptotic value but increases with time. For tion with pedigree information, little improvements in example, withNs⫽Nd⫽9, 72 genotyped offspring,c⫽ Flevels were obtained by managing the matings, which 1, m ⫽ 5, and a ⫽ 10, estimates are equal to 58.36, was not surprising since levels of inbreeding at genera-78.31, and 92.67 if we averaged⌬F to calculateNefor tion 10 were very similar when optimizing contributions generations 5–10, 10–15, or 15–20, respectively. This using fP or fPM and matings were at random. From a happens as alleles become fixed in some positions and practical point of view, a comparison of interest is that the number of markers to be jointly optimized de- between strategies that usefPMto optimize both contribu-creases. Therefore, we cannot make predictions on the tions and matings or to optimize only matings. With the future performance of the population base on a particu- former, slightly lower levels of inbreeding were generally lar value ofNe. obtained, but the costs involved in the program were When only parents are genotyped, the inclusion of higher since a larger number of individuals needed to molecular information together with genealogical data be genotyped.
(fPM) in the management of contributions showed lim- As a general conclusion, managers of a conservation ited value for improving the levels of diversity (either program should be advised to critically evaluate the GD or AD) and the levels of inbreeding in the first 10 convenience of including molecular information into generations (Tables 1 and 2). With small genomes (c⫽ the management design, because the cost of molecular 1) we obtained greaterNewhen minimizingfPMwas the techniques is still high and markers will not be very chosen strategy, implying some benefits could be found abundant except for domestic species. The results from in the long-term horizon (Table 1). However, this advan- this study suggest that, for lowly prolific species and thus tage disappears for larger, and more realistic, genomes basing decisions only on breeders’ data, it would be
(c⫽20). more efficient to use genealogical information in the
If the genotype for a number of offspring was avail- management, if such information is available. Obvi-able, there was a greater improvement inNeby minimiz- ously, if we lack pedigree, it is better to use molecular ingfPMrelative to the values reached with fP, especially information to manage the population than leave it for small genomes (Table 1). These values, for combina- unmanaged, except for very unrealistic scenarios. When tions with a similar number of chromosomes and num- more offspring than needed can be generated and geno-ber of markers per chromosome, were in the range of typed, the advantage of using molecular information those found by Toro et al. (1999) and Wang(2001). can be larger, especially when combined with genealogi-Therefore, results presented in this article are in agree- cal data on a species with small genomes. However, in ment with those from previous studies, regarding long- realistic situations (i.e., species with large genomes and term performance of strategies, although no test of sig- a limited number of available markers), probably it nificance can be made due to the lack of standard errors would be more efficient to allocate the available re-forNeof theToroet al.(1999) andWang(2001) data. sources to the enlargement of the population or to a When comparisons between management methods better control of pedigree and restrict the use of mark-are made on the basis of levels of AD maintained in the ers to more specific tasks such as solving pedigree uncer-population, conclusions are similar to those observed tainties. Notwithstanding, these considerations should for GD (i.e., very good performance of pedigree-based be studied for each particular case.
strategies and little improvement from the inclusion of
This work was supported by grants BMC2003-03022 (Ministerio de
marker information,fPM, except for small genomes when
Ciencia y Tecnologı´a and Fondos Feder) and RZ03-010 (Instituto
offspring genotype is available). These results are in Nacional de Investigacio´n y Tecnologı´a Agraria y Alimentaria). Jesu´s agreement with the work by Ferna´ndez et al. (2004), Ferna´ndez was supported by aPrograma Ramo´n y Cajalcontract. Beatriz Villanueva acknowledges financial support from the Secretarı´a de
which showed that strategies directed to the
mainte-Estado de Educacio´n y Universidades (Ministerio de Educacio´n,
Cult-nance of GD (minimization of weighted global
coances-ura y Deporte, Spain) and from the Scottish Executive Environment
try) are also effective in the maintenance of AD.
and Rural Affairs Department (United Kingdom). Ricardo
Pong-Marker information was also of relatively low value Wong acknowledges financial support from The Biotechnogy and for optimizing matings among selected individuals to Biological Research Council.
decrease inbreeding levels, at least for realistic scenar-ios. Previous studies (Ferna´ndezandCaballero2001) have shown that, when using exclusively pedigree
infor-LITERATURE CITED mation for conservation purposes, the effect of the
mat-Ballou, J. D., andR. C. Lacy, 1995 Identifying genetically important
ing design on the inbreeding levels is minimal, once
individuals for management of genetic variation in pedigreed
contributions have been optimized. In selection schemes populations, pp 76–111 inPopulation Management for Survival and (SonessonandMeuwissen2000, 2002) improvements Recovery, edited by J. D. Ballou, M. Gilpinand T. J. Foose.
Columbia University Press, New York.
can be larger, but it depends on the structure of the
Caballero, A., andM. A. Toro, 2000 Interrelations between
effec-population, the selection pressure, and the restriction
tive population size and other pedigree tools for the management
on inbreeding imposed. In the present study, when of conserved populations. Genet. Res.75:331–343.
Caballero, A., andM. A. Toro, 2002 Analysis of genetic diversity for
combina-the management of conserved subdivided populations. Conserv. 2001 A simple and rapid method for calculating identity-by-descent matrices using multiple markers. Genet. Sel. Evol.33:
Genet.3:289–299.
Caballero, A., E. SantiagoandM. A. Toro, 1996 Systems of mat- 453–471.
Sonesson, A. K., andT. H. E. Meuwissen, 2000 Mating schemes ing to reduce inbreeding in selected populations. Anim. Sci.62:
431–442. for optimum contribution selection with constrained rates of inbreeding. Genet. Sel. Evol.32:231–248.
Falconer, D. S., andT. F. C. Mackay, 1996 An Introduction to
Quanti-tative Genetics, Ed. 4. Longman, Harlow, UK. Sonesson, A. K., andT. H. E. Meuwissen, 2001 Minimization of rate of inbreeding for small populations with overlapping generations.
Ferna´ndez, J., andA. Caballero, 2001 A comparison of
manage-ment strategies for conservation with regard to population fitness. Genet. Res.77:285–292.
Sonesson, A. K., andT. H. E. Meuwissen, 2002 Non-random mating Conserv. Genet.2:121–131.
Ferna´ndez, J., and M. A. Toro, 1999 The use of mathematical for selection with restricted rates of inbreeding and overlapping generations. Genet. Sel. Evol.34:23–39.
programming to control inbreeding in selection schemes. J.
Anim. Breed. Genet.116:447–466. Toro, M. A., B. NietoandC. Salgado, 1988 A note on minimization of inbreeding in small-scale selection programmes. Livest. Prod.
Ferna´ndez, J., M. A. ToroandA. Caballero, 2003 Fixed
contribu-tions designsvs. minization of global coancestry to control in- Sci.20:317–323.
Toro, M. A., L. Silio´ , M. C. Rodrı´guez, J. Rodriga´n˜ ezandJ.
Ferna´n-breeding in small populations. Genetics165:885–894.
Ferna´ndez, J., M. A. ToroandA. Caballero, 2004 Managing indi- dez, 1999 Optimal use of genetic markers in conservation pro-grammes. Genet. Sel. Evol.31:255–261.
viduals’ contributions to maximize the allelic diversity maintained
in small, conserved populations. Conserv. Biol.18:1358–1367. Villanueva, B., R. Pong-Wong, J. A. WoolliamsandS. Avendan˜ o, 2004 Managing genetic resources in commercial breeding
pop-Frankham, R., J. D. BallouandD. A. Briscoe, 2003 Introduction
to Conservation Genetics. Cambridge University Press, Cambridge, ulations, pp. 113–131 inFarm Animal Genetics Resources, edited by
UK. G.Simm, B.Villanueva, K. D.Sinclairand S.Townsend. BSAS
Hill, W. G., andJ. Rasbash, 1986 Models of long term artificial Occasional Pub. 30, Nottingham University Press, Nottingham, selection in finite populations. Genet. Res.48:41–50. UK.
James, J. W., 1971 The founder effect and response to artificial Wang, J., 1997 More efficient breeding systems for controlling in-selection. Genet. Res.12:249–266. breeding and effective size in animal populations. Heredity79: Kirkpatrick,S., C. D. GelattandM. P. Vecchi, 1983 Optimization 591–599.
by simulated annealing. Science220:671–680. Wang, J., 2001 Optimal marker-assisted selection to increase the
Nei, M., 1973 Analysis of gene diversity in subdivided populations. effective size of small populations. Genetics157:867–874. Proc. Natl. Acad. Sci. USA70:3321–3323.