Research Report
AP-R495-15
Options to Extend Coverage
of Alcohol Interlock Programs
Prepared by
Monash University: Associate Professor Michael Fitzharris,
Sara Liu, Sujanie Peiris, Dr Anna Devlin, Dr Kristie Young and Professor Mike Lenné
Arizona State University: Associate Professor Diana Bowman
University of Michigan: Dr Jake Gatof
Publisher Austroads Ltd.
Level 9, 287 Elizabeth Street Sydney NSW 2000 Australia Phone: +61 2 8265 3300 [email protected] www.austroads.com.au Project Manager Paula Norman About Austroads Austroads’ purpose is to:
• promote improved Australian and New Zealand transport outcomes
• provide expert technical input to national policy development on road and road transport issues • promote improved practice and capability by road
agencies
• promote consistency in road and road agency operations.
Austroads membership comprises the six state and two territory road transport and traffic authorities, the Commonwealth Department of Infrastructure and Regional Development, the Australian Local Government Association, and NZ Transport Agency. Austroads is governed by a Board consisting of the chief executive officer (or an alternative senior executive officer) of each of its eleven member organisations:
• Roads and Maritime Services New South Wales • Roads Corporation Victoria
• Department of Transport and Main Roads Queensland
• Main Roads Western Australia • Department of Planning, Transport and
Infrastructure South Australia • Department of State Growth Tasmania • Department of Transport Northern Territory • Territory and Municipal Services Directorate,
Australian Capital Territory
• Commonwealth Department of Infrastructure and Regional Development
• Australian Local Government Association • New Zealand Transport Agency. The success of Austroads is derived from the
collaboration of member organisations and others in the road industry. It aims to be the Australasian leader in providing high quality information, advice and fostering research in the road transport sector.
Abstract
Despite high levels of community education and sustained enforcement, alcohol-related crashes and drink-driving offences continue to pose a threat to road safety.
Alcohol interlock programs are one element of enforcement. High-range, repeat or other serious drink-driving offenders can be required to fit alcohol interlocks to their vehicles. The interlock is an electronic breath-testing device that prevents the car from starting if alcohol is detected. This report examines the evidence base and develops options to extend the coverage of alcohol interlock programs to: a wider segment of drink-driving offenders; other high-risk groups; corporate fleets; and if appropriate, the broader driving population on a voluntary basis. The report assesses where additional road safety benefit could be gained over and above existing strategies to mitigate the frequency and consequences of drink-driving.
This report presents an overview of current Australasian drink-driving legislation and alcohol interlock program requirements. It identifies gaps in current alcohol interlock programs in Australasia and overseas, identifies opportunities to expand alcohol interlock programs and assesses whether evidence shows a need to expand their coverage given rates of alcohol-related crashes and blood alcohol concentration (BAC) offences.
The report examines published evaluations of alcohol interlock programs so as to understand their effectiveness and to assist in making
recommendations as to how current programs could be modified, expanded, or tailored to specific driver/rider groups. A review of current and future alcohol interlock technology builds an understanding of system specification, cost and device calibration issues that impact driver and community acceptance. This review, as well as an examination into community attitudes to the expansion of alcohol interlock devices, helps to identify options to expand current alcohol interlock programs.
Keywords
alcohol, BAC, interlock, crash, effectiveness, offence, offender, commercial, novice, driver
ISBN 978-1-925294-75-0 Austroads Project No. SS 1754 Austroads Publication No. AP-R495-15 Publication date September 2015 Pages 163
© Austroads 2015
This work is copyright. Apart from any use as permitted under the Copyright Act 1968, no part may be reproduced by any process without the prior written permission of Austroads.
This report has been prepared for Austroads as part of its work to promote improved Australian and New Zealand transport outcomes by providing expert technical input on road and road transport issues.
Individual road agencies will determine their response to this report following consideration of their legislative or administrative arrangements, available funding, as well as local circumstances and priorities.
Austroads believes this publication to be correct at the time of printing and does not accept responsibility for any consequences arising from the use of information herein. Readers should rely on their own skill and judgement to apply information to particular issues.
Summary
Introduction
Despite high levels of community education and sustained enforcement, alcohol-related crashes and drink-driving offences continue to pose a threat to road safety.
Alcohol interlock programs are one element of enforcement. High-range, repeat or other serious drink-driving offenders can be required to fit alcohol interlocks to their vehicles. The interlock is an
electronic breath-testing device that prevents the car from starting if alcohol is detected.
This report examines the evidence base and develops options to extend the coverage of alcohol interlock programs to:
• a wider segment of drink-driving offenders • other high-risk groups
• corporate fleets
• if appropriate, the broader driving population on a voluntary basis.
The report assesses where additional road safety benefit could be gained over and above existing strategies to mitigate the frequency and consequences of drink-driving.
This report presents an overview of current Australasian drink-driving legislation and alcohol interlock program requirements. It identifies gaps in current alcohol interlock programs in Australasia and overseas, identifies opportunities to expand alcohol interlock programs and assesses whether evidence shows a need to expand their coverage given rates of alcohol-related crashes and blood alcohol concentration (BAC) offences.
The report examines published evaluations of alcohol interlock programs so as to understand their effectiveness and to assist in making recommendations as to how current programs could be modified, expanded, or tailored to specific driver/rider groups. A review of current and future alcohol interlock technology builds an understanding of system specification, cost and device calibration issues that impact driver and community acceptance. This review, as well as an examination into community attitudes to the expansion of alcohol interlock devices, helps to identify options to expand current alcohol interlock programs.
Principal Findings
Crash-risk associated with drink-drive behaviour
There is a well-documented exponential relationship between BAC and crash risk. Within Australia and New Zealand, alcohol-related crashes remain a significant proportion of fatal and serious injury crashes.
The magnitude of alcohol-related crashes and drink-drive behaviour
The action and consequences of drink-driving is seen in the high number of drivers involved in crashes who exceeded the proscribed BAC of their licence class. For instance, between 2008 – 2012 approximately 15,000 drink-drive offenders were detected in Victoria each year, while in the period 2003 – 2012 nearly 250,000 drink-drive offences were detected in NSW, and nearly 105,000 offences were detected in Queensland from 2009 to 2012. The data highlights the pervasive nature of drink-driving behaviour across all licence types, including disqualified and 0.00 BAC alcohol condition licensed drivers. Where demographic information was known (Vic, NSW, QLD, NZ), males accounted at least three-quarters of offences, with young drivers generally accounting for approximately 40% of offences.
The data also highlights the high number of drivers drink-driving while disqualified, unlicensed, or holding a conditional licence due to prior drink-driving offences. A small proportion of drivers have multiple offences. Moreover, the number of other 0.00 BAC required drivers detected (i.e., trucks, buses, taxis) is high.
Similarly, crash statistics reflect a consistent pattern of alcohol-related involvement in fatality and injury crashes. Data from each Australian state and territory and New Zealand highlights a high number of fatality and serious injury crashes involving alcohol. For instance, in Victoria, approximately 25% of fatality crashes and 20% of injured drivers had an illegal BAC. In New Zealand, 20% of fatality crashes and 14% of serious injury crashes were alcohol-related.
Considering that alcohol-related crashes and offences are preventable, this analysis supports the case for increasing enforcement and associated penalties and makes the case for requiring alcohol interlock fitment for particular licence holders and vehicle types.
Current alcohol interlock programs in Australasia and overseas programs
While all Australasian jurisdictions – except for Western Australia - have implemented offender-based alcohol interlock programs, none currently require the mandatory fitment of alcohol interlocks to any other driver/vehicle group as a preventative program. There is little evidence that jurisdictions promote the voluntary use of alcohol interlocks in Australia and New Zealand.
Current offender alcohol interlock programs are remarkably consistent, despite some differences in their entry criteria and their judicial or administrative basis. Specifically, high-range BAC first-time offenders – defined as BAC ≥ 0.15 in Australia (except in the NT) and BAC ≥ 0.16 in New Zealand - and repeat drink-drive offenders are required to fit alcohol interlocks as a condition of relicensing. Victoria requires mandatory alcohol interlock devices for all probationary (also known as ‘provisional’ in some jurisdictions) and learner driver offenders, all first-time offenders with a BAC exceeding 0.07, all first offenders with a BAC whose licence is cancelled (including professional drivers), and all repeat offenders (regardless of BAC). To facilitate this, Victoria introduced an administrative element to complement the existing judicial component. The new law also provides discretion for Police to impound vehicles of first-time drink-drive offenders detected with a BAC exceeding 0.10.
To facilitate this change, Victoria introduced an administrative element to complement the existing judicial component. The schemes in SA, Tasmania, ACT, Victoria, and NZ require a violation-free period prior to removing the alcohol interlock, with extensions in NSW dependent upon a fitness-to-drive assessment where violations are seen in the last six-months of the interlock period. In addition, differences exist with respect to the requirement to undergo an assessment for alcohol use problems. The review of alcohol interlock programs in overseas jurisdictions highlights a number of features novel to the Australasian context, including:
• the application of child endangerment laws
• automatic licence revocation laws • ‘all offender laws’
• programs that require abstinence from alcohol (including associated test methods using biomarkers)
• programs that integrate clinical assessment and rehabilitation with the aim of addressing underlying maladaptive alcohol consumption behaviours including alcohol dependency • differential licence sanctions for drivers that volunteer to install an alcohol interlock device. Alcohol interlock programs in the US in particular blend mandatory and permissive (voluntary) programs, while an increasing number of EU countries are introducing alcohol interlock programs for offenders.
Few countries require alcohol interlocks to be fitted in non-offender vehicles; this is limited to a few EU countries where the focus tends to be on commercial vehicles and the carriage of school children, older adults and persons requiring care. Sweden, for example, requires all government vehicles and contractors to have alcohol interlocks installed on vehicles.
Effectiveness of alcohol interlock programs
A review of alcohol interlock program evaluations demonstrates that alcohol interlocks are effective in preventing drink-drive episodes when installed and that the positive effect of alcohol interlocks dissipates once the interlock is removed. To date, no Australasian alcohol interlock program has been evaluated, which limits the ability to provide definitive recommendations in this report. Most of the evidence around the effectiveness of alcohol interlock programs comes from voluntary-based systems; hence there is an urgent need to evaluate local, mandatory participation programs.
The findings of research presented also points to the importance of addressing the underlying alcohol consumption pattern, whether this can be characterised as alcohol abuse – including binge drinking, or alcohol dependency. This is particularly pertinent for high-range BAC and repeat drink-drive offenders, where an established pattern of behaviour and/or underlying alcohol pathology is more likely. On this latter point, the case for alcohol interlocks for these two groups is well established and is reflected in the current legislative requirements of Australasian alcohol interlock programs. Previous research also highlights a higher rate of alcohol use disorders among repeat drink driving offenders than is found in the broader community. While treatment and rehabilitation has been shown to be effective in addressing maladaptive drinking behaviour, the extent to which rehabilitation should be incorporated into alcohol interlock programs that focus on separating drinking from driving remains contested.
While it is accepted from a road safety perspective that it is not the primary function of an alcohol interlock program to treat underlying drinking pathology, but rather to prevent drivers from engaging in drink-drive behaviour, it must also be accepted that until the drinking pathology is treated, the
behavioural manifestation of the drink-drive problem is likely to continue for the proportion of drivers termed recidivist offenders. While the traditional alcohol interlock fitment approach works well for the majority of offenders who do not reoffend, repeat drink-drivers - who comprise 15% to 30% of offenders, remain a challenge.
Alcohol interlock programs, depending on the policy setting, can offer a worthwhile platform to encourage, direct and assist with rehabilitation across all target populations. Similarly, for the non-offender group, an alcohol interlock has the potential to meet the goals of secondary prevention as a form of early intervention for at-risk drinkers, in addition to preventing episodes of driving while intoxicated.
Current and emerging alcohol interlock technology
A review of existing alcohol interlock technologies and how they are used found issues relating to end use, accuracy, calibration and advances in reporting. Current breath interlock systems have broad capabilities and can be configured to meet alcohol interlock program requirements. An important technical element bearing on cost, and hence device acceptability, is that interlocks require re-calibration when the detection of a proscribed alcohol concentration is required; however, such continual calibration might not be necessary for the simple detection of the presence of alcohol.
Moreover, a review of system technical specifications indicates that devices require re-calibration once every six or 12 months. This has implications for implementing alcohol interlocks in the commercial transport environment and within high crash risk groups, such as young drivers who are required to maintain a 0.00 BAC while driving. It is important to consider the technology within the device itself in terms of cost, lifespan, accuracy and portability.
Alcohol interlocks store data that can be used to assess program compliance and
treatment/rehabilitation effectiveness, an important feature in jurisdictions that require a violation-free period prior to relicensing. Anti-circumvention features protect the integrity of the device and the alcohol interlock program itself. Multiple users can use a single alcohol interlock, through the use of a PIN, or through the use of a different device handset (as they can be detached easily).
Add-on technologies include face recognition, biometric (fingerprint) recognition, real-time reporting of violations and GPS tracking. These add-ons can improve the legitimacy of the alcohol interlock in the eyes of the public by eliminating the substitution of users (and the inter-personal relationship
problems that can arise when an offender asks someone to take the test) and ensure swift sanctions for violations.
Considerable research and development internationally is looking at systems to assess the presence and level of alcohol using skin sensors, alcohol ‘sniffer’ systems, transdermal perspiration
measurements and eye movements, with a view to integrating these systems within the vehicle and minimising driver effort. The development of unobtrusive alcohol ignition interlocks would help to achieve broad community end-user acceptability and ultimately, widespread voluntary use. Advances in alcohol interlock technologies offer opportunities for authorities to monitor drink-drive behaviour across several contexts, both in the convicted offender and non-offender groups,
particularly in the workplace setting. While cost is a potential issue, the long recalibration period (up to 12 months) and capacity for storing test readings can reduce costs for the non-offender group in particular, by eliminating regular, and in some jurisdictions, monthly servicing fees. However, regular servicing must continue for offender groups so that driver behaviour can be monitored.
Attitudes toward the fitment of alcohol interlock devices
Given the importance of community views in the development and implementation of government policy, a survey of 5,544 Australians was undertaken. No data were collected in New Zealand due to financial constraints.
Only 34% of respondents stated they would find an alcohol interlock to be personally useful and 18% stated they would find an ‘advisory’ system to be personally useful. However, 42% stated they would not find an interlock useful and 6% said they did not know.
In contrast, these same respondents signalled strong support for the compulsory fitment of alcohol interlocks for repeat drink-drive offenders, with 91% of respondents agreeing and 89% doing so strongly. A high proportion of respondents agreed that commercial drivers should be required to install alcohol interlocks, while 79% agreed that all probationary drivers should, by default, be required to fit an alcohol interlock, which marginally ranked ahead of first-time drink-drivers (78%).
Half of the respondents agreed with the compulsory fitment of alcohol interlocks for fully licensed car drivers (53%) and 49% for ‘all drivers, all vehicles’. However, the proportion stating that they neither agree nor disagree was highest for these two groups, this being 18% for ‘drivers of passenger cars’ and 16% for ‘all drivers, all vehicles’. This result perhaps reflects the fact that no information
concerning cost of the device was provided, and / or the respondents own views on whether they saw alcohol interlocks to be of personal use.
Of current probationary licence holders, between 61% to 72% agreed that probationary drivers should be required to have alcohol interlocks fitted (33% to 40% agreed strongly). Only one in ten
probationary drivers strongly disagreed with mandatory fitment. Clearly, there is a mix of views, with some respondents offering strong support, others offering qualified support and others no support at all. Any change in policy in this area would require extensive community consultation and education.
Conclusions and Alcohol Interlock Program Expansion
Opportunities
This report set out to identify options for the expansion of existing alcohol interlock programs to cover a broader group of offender and non-offender vehicle controllers. It provides information concerning the involvement of alcohol in crashes and drink-driving behaviour, and identifies gaps in current coverage where expansion would seem logical and defensible.
Caveat: This report makes inferences based on available evidence and data. It does not provide a
data-driven evaluation of current alcohol interlock programs in Australasia. Rather, in examining the magnitude of drink-driving behaviour and the coverage of existing alcohol interlock programs locally and overseas, as well as documenting available evidence of program effectiveness and community support, it identifies opportunities to refine and expand existing alcohol interlock programs. There remains a pressing need to evaluate current Australasian offender-based alcohol interlock programs. Following from above, a detailed discussion is presented on:
• expanding and refining current offender-based alcohol interlock programs • expanding alcohol interlocks to novice drivers
• expanding alcohol interlocks to fleet and commercial vehicles.
This report highlights that drink-driving represents a significant and persistent road safety problem despite high levels of enforcement. Alcohol-related crashes, drink-driving and recidivism pose a serious threat to the goal of saving lives and reducing injuries on the road. Alcohol interlock programs in Australasia focus on preventing convicted drink-drivers from reoffending. These programs
represent an important additional countermeasure over and above sustained, high level drink-drive enforcement and community education.
Overseas research shows alcohol interlock devices can prevent drink-drive episodes when installed, but the effect dissipates when the device is removed. However, much of this evidence relates to voluntary programs. No comparable research in Australasia has evaluated the effects of mandatory alcohol interlock programs.
Offence statistics in Australia and New Zealand show that while the majority of individuals do not reoffend following the removal of an alcohol interlock from their vehicle, 15% to 30% continue to drink and drive. In addition, a sizeable number of individuals are detected drink-driving when disqualified or unlicensed.
The requirement to fit alcohol interlocks into the vehicles of all offenders is worthy of strong
consideration. Moreover, given the research evidence on alcohol use disorders and aberrant drinking behaviour, the sub-group of offenders with high BAC levels and repeat offenders should be required to seek clinical assessment and, where appropriate, supportive and effective treatment for
maladaptive alcohol consumption patterns. Failure to do so would mean that is it highly likely that a proportion of this group will continue to offend. It is also clear that advances in alcohol interlock technology and the interface systems of suppliers increase the ability to effectively monitor offenders. It is not feasible (due to the volume of offenders) or necessary (in the case of low range first-time BAC offences) to require all drink-drive offenders to attend court for an alcohol interlock condition to be added to a licence; this could be also achieved by a licensing authority. However, high-risk drink-drive offenders, these being offenders detected with a high BAC level or who are repeat offenders, require some form of alcohol education and/or rehabilitation coupled with monitoring, in addition to an alcohol interlock. Hence, a model where first-time, low- and mid-range offences receive an administrative order to fit an alcohol interlock, but high-range and repeat offenders attend court, is likely to be most effective in terms of road safety and efficiency. Regardless of the model, the alcohol interlock must remain a key prevention and management strategy for known offenders.
A strong case can be made for fitting alcohol interlocks to commercial vehicles and vehicles driven by probationary drivers. At present, these drivers are required drive with a 0.00 BAC, and, arguably, fleet drivers should be the same. Chapter 3 highlights the fact that current electrochemical fuel sensor alcohol interlocks can reliably detect the presence of alcohol. Moreover, the large data log storage and the low cost of device recalibration every six to 12 months make this step feasible and practical from a cost perspective.
Public support for the compulsory fitment of alcohol interlocks for offenders, commercial drivers and novice drivers is high, and acceptability can be expected to increase as alcohol interlock technology becomes less obtrusive and most drivers accept the fitting of alcohol interlocks to their vehicle. Incrementally fitting alcohol interlocks throughout the vehicle population is likely to be the most acceptable option. Interlocks may, in the future, be a standard vehicle feature.
An incremental approach that commences with commercial then fleet vehicles then probationary drivers may overcome the perception of alcohol interlocks as purely a punitive measure. This report addresses several challenges of existing alcohol interlock programs, including:
• mechanisms to detect whether vehicles are required to have alcohol interlocks fitted and which drivers should be driving vehicles with an alcohol interlock
• a classification mechanism for determining which registered vehicles should be fitted with alcohol interlocks (for non-offenders)
• whether a harmonised approach to alcohol interlocks is required, and how this would be designed and implemented
• specific issues relevant to rural and remote locations.
We argue that a harmonised national mandatory approach should be pursued for both existing offender-based programs and non-offender programs as far as possible. This would aid compliance, ensure uniformity of sanctions, improve community acceptability of alcohol interlocks, promote new technological solutions to common problems faced by jurisdictions, promote innovation in the technical specifications of interlocks and reduce the costs of participation and fitment.
This report finds that the widespread fitment of alcohol interlocks to vehicles driven by all offenders, and ultimately all vehicles, would significantly reduce the number of alcohol-related deaths and injuries on Australasian roads. Expansion opportunities and other matters relevant to the performance of alcohol interlock programs are noted below.
Expansion opportunities relating to drink-drive offenders
1. Consider a feasibility and impact analysis on extending coverage of alcohol interlocks to all offender groups.
2. Explore service delivery options and the likely benefits of mandatory clinical assessments for first-time high-range BAC offenders and repeat drink-drive offenders.
3. To mitigate the potential for repeat drink-driving, require all offenders to have a specified violation-free period prior to removing the alcohol interlock.
4. Explore options to reduce an offending driver’s disqualification period in exchange for a longer period of driving with the alcohol interlock. This could include greater monitoring and participation in clinical alcohol assessment programs.
Expansion opportunities relating to non-offender driving groups
1. Examine ways to stimulate public acceptability and demand of alcohol interlocks, including the promotion of voluntary fitment of alcohol interlocks to fleets and commercial vehicles using national OHS laws, risk management and quality assurance as key levers. Promote the advantages for fleets and commercial operators such as reduced crash risk, improved productivity, improved asset management, potential insurance savings, and better alignment with statutory obligations to provide a safe workplace.
2. Consider options to expand alcohol interlock use among novice drivers, based on the elevated crash risk for young drivers at any given BAC, and the documented pattern of drink-drive
behaviour among a subset of learner and probationary drivers. Analyse the impact on employment and potential exemptions and promote potential advantages for the novice driver such lower insurance premiums and/or registration, improved safety and improved mobility.
3. Explore public education programs and financial incentives to stimulate the voluntary fitment of alcohol interlocks into vehicles.
Matters relevant to the fitment of alcohol interlock devices and performance of alcohol interlock programs generally
1. To promote inter-jurisdictional operability of alcohol interlocks, examine the feasibility of a single register for all licensing authorities, the police and the judiciary that contains alcohol interlock fitment requirements for each driver enrolled in an interlock program in Australia and New Zealand, as well as all alcohol interlock data from offenders.
2. Move to a national, harmonised approach for the approval and use of alcohol interlocks, including specification of re-calibration periods, to reduce the regulatory burden on program administration, suppliers and end-users; promote technical innovation; and facilitate jurisdictional portability. 3. Assess the potential use of automatic number plate recognition (ANPR) technology, coupled with
access to a national licensing register, to detect vehicles required to have an alcohol interlock installed and to also help identify unlicensed, disqualified and never-licensed drivers.
Contents
1. Overview ... 1
1.1 Background ... 1
1.1.1 Alcohol and Drink-driving ... 1
1.1.2 Alcohol Interlock Programs ... 1
1.2 Purpose ... 2
1.3 Structure of Report ... 4
1.4 Project Scope and Use of the Report ... 4
2. The Magnitude of Drink-Driving: An Analysis of Crash Data, Offence Data and Interlock Orders ... 5
2.1 Introduction ... 5
2.2 Available data ... 6
2.3 Alcohol-related crashes ... 7
2.3.1 Alcohol-related fatality and injury crashes in Victoria ... 7
2.3.2 Alcohol-related fatality and injury crashes in New South Wales (NSW) ... 8
2.3.3 Alcohol-related fatality and injury crashes in Queensland ... 9
2.3.4 Alcohol-related fatality and injury crashes in South Australia ... 11
2.3.5 Alcohol-related fatality and injury crashes in Western Australia (WA) ... 13
2.3.6 Alcohol-related fatality and injury crashes in the Australian Capital Territory (ACT) . 19 2.3.7 Alcohol-related fatality and injury crashes in the Northern Territory (NT) ... 19
2.3.8 Alcohol-related fatality and injury crashes in Tasmania ... 19
2.3.9 Alcohol-related fatality and injury crashes in New Zealand ... 20
2.4 Offence Data and Alcohol Interlock Conditions ... 21
2.4.1 Alcohol-related driving offences in Victoria ... 21
2.4.2 Alcohol-related driving offences in New South Wales (NSW) ... 26
2.4.3 Alcohol-related driving offences in Queensland ... 28
2.4.4 Alcohol-related driving offences in South Australia ... 29
2.4.5 Alcohol-related driving offences in Western Australia (WA) ... 30
2.4.6 Alcohol-related driving offences in the Australian Capital Territory (ACT) ... 32
2.4.7 Alcohol-related driving offences in the Northern Territory (NT) ... 33
2.4.8 Alcohol-related driving offences in Tasmania ... 33
2.4.9 Alcohol-related driving offences in New Zealand (NZ) ... 33
2.5 Concluding comment ... 37
3. Description of Australasian and Selected International Alcohol Interlock Programs ... 39
3.1 Introduction ... 40
3.2 Development of the program comparison matrix and definitions ... 40
3.3 Overview and description of current alcohol interlock programs in Australasia ... 43
3.3.1 Characteristics of the New South Wales (NSW) alcohol interlock program ... 50
3.3.2 Characteristics of the Victorian alcohol interlock program ... 51
3.3.3 Characteristics of the Queensland alcohol interlock program ... 53
3.3.4 Characteristics of the Northern Territory (NT) alcohol interlock program ... 54
3.3.5 Characteristics of the South Australian (SA) alcohol interlock program ... 55
3.3.7 Characteristics of the ACT alcohol interlock program ... 57
3.3.8 Characteristics of the New Zealand alcohol interlock program ... 58
3.4 Overview and description of current alcohol interlock programs in the United States ... 60
3.4.1 Summary of US programs ... 61
3.4.2 Characteristics of the Alabama alcohol interlock program ... 61
3.4.3 Characteristics of the California alcohol interlock program ... 65
3.4.4 Characteristics of the Washington (State) alcohol interlock program ... 67
3.4.5 Notable Features of Other Alcohol Interlock Program in the US ... 68
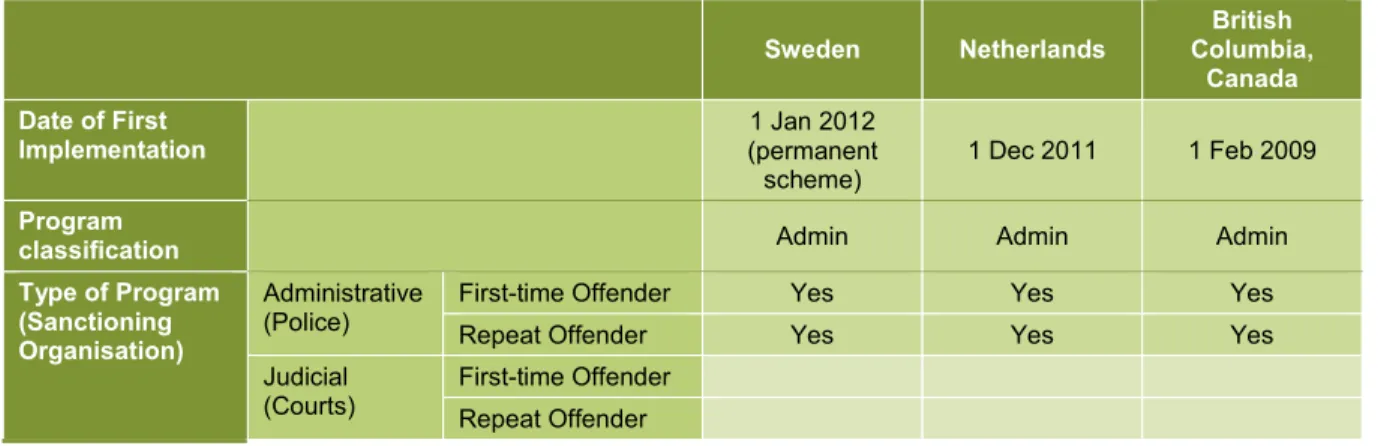
3.5 Overview and description of current alcohol interlock programs in Sweden, the Netherlands and British Columbia (Canada) ... 69
3.5.1 Characteristics of the Swedish alcohol interlock program ... 72
3.5.2 Program to encourage alcohol interlocks into commercial and government vehicles in Sweden ... 77
3.5.3 Characteristics of the Netherlands alcohol interlock program ... 77
3.5.4 Characteristics of the British Columbia (Canada) alcohol interlock program ... 79
3.6 Discussion of Alcohol Interlock Program features ... 86
3.7 Concluding Comment ... 87
4. Alcohol Interlock Programs: Efficacy, Mental Health and Treatment Considerations ... 88
4.1 Introduction ... 89
4.2 Method ... 89
4.3 Efficacy of Alcohol Interlock Programs ... 90
4.3.1 Goal of Alcohol Interlock Programs ... 90
4.3.2 Target Populations ... 90
4.3.3 Challenges Associated With Implementation of Alcohol Interlock Programs ... 91
4.3.4 Effectiveness of alcohol interlock programs in different population groups... 92
4.4 Alcohol ‘pathology’ – considerations for alcohol interlock programs ... 96
4.5 Concluding comment ... 98
5. Alcohol Interlock Technology ... 99
5.1 Introduction ... 100
5.2 Alcohol Interlock Technologies ... 100
5.2.1 Breath Alcohol Ignition Interlock Devices ... 100
5.3 Types of Technologies Used in Breath Alcohol Ignition Interlock Devices ... 104
5.3.1 Semiconductor Based Breathalysers/Semiconductor-Technologies ... 104
5.3.2 Intoxilysers or Spectrophotometers ... 104
5.3.3 Electrochemical-based Breathalysers (Fuel-cell Technology)... 105
5.4 Emerging ‘add-on’ Technologies to Alcohol Interlock Units ... 105
5.5 Future Developments and Other Technologies Used to Measure BAC ... 106
5.6 A comment on alcohol biomarkers ... 109
5.7 Effectiveness and Limitations of Breath Alcohol Ignition Interlock Technologies ... 110
6. Policy Considerations: Attitudes toward the Fitment of Alcohol Interlock Devices ... 112
6.1 Introduction ... 113
6.2 National Survey of Attitudes toward the fitment of Alcohol Interlocks ... 113
6.2.1 Background to Survey... 113
6.2.2 Sampling Frame and Survey Design ... 114
6.2.3 Survey Respondents... 114
6.2.4 Information Provided Concerning Alcohol Interlocks ... 114
6.2.5 Perceived Usefulness of an Alcohol Interlock to the Respondent ... 115
6.2.6 Level of Support for the Compulsory use of Alcohol Interlock Technology among Different Driver- Vehicle Combinations ... 119
6.3 Implications ... 121
6.4 Concluding comment ... 123
7. Discussion and Options for Expanding the Coverage of Alcohol Interlock Programs ... 124
7.1 Expansion and refinement of current offender-based alcohol interlock programs ... 126
7.2 Expansion of alcohol interlocks to novice drivers ... 127
7.2.1 Probationary drivers ... 127
7.2.2 Learner drivers ... 128
7.3 Expansion of alcohol interlocks to fleet and commercial vehicles ... 129
7.3.1 The case for expansion of alcohol interlocks into fleets and commercial vehicles ... 129
7.3.2 The use of alcohol interlocks in commercial vehicles in Europe: An example to follow? ... 129
7.3.3 The current regulatory environment ... 130
7.4 Other considerations in the expansion alcohol interlock programs and device fitment .... 131
7.4.1 Mechanism of detecting whether vehicles should be fitted with an alcohol interlock ... 131
7.4.2 No requirement for alcohol interlocks to be installed in emergency services vehicles ... 132
7.4.3 A possible approach to classifying vehicles... 132
7.4.4 The benefits of a harmonised approach ... 132
7.4.5 Considerations for rural and remote communities ... 133
7.5 Conclusion and Recommendations ... 133
References ... 136
Appendix A Drink Drive Offences, Penalties and Alcohol Interlock Design in the United Kingdom (UK) ... 142
Appendix B State and Territory Analysis of Attitudes Toward the Fitment of Alcohol Interlock Devices ... 145
Tables
Table 2.1: Number and percentage of drivers/riders killed by BAC, Victoria 2007-2010 ... 7 Table 2.2: Number and percentage of drivers admitted to hospital by BAC, Victoria 2011 ... 7 Table 2.3: Number and percentage of motor vehicle controllers involved in a crash by BAC,
NSW, 2003-2012 ... 8 Table 2.4: Number and percentage of controllers with an illegal BAC involved in fatality and
injury crashes by age, NSW, 2003-2012 ... 8 Table 2.5: Number and percentage of drivers/riders involved in all crashes, by BAC in QLD,
2003-2012 ... 9 Table 2.6: Number and percentage of drivers/riders by BAC post-crash, by vehicle and
licence type, QLD, 2003-2012 ... 10 Table 2.7: Number and percentage of drivers/riders by BAC post-crash, by vehicle and
licence type, SA, 2003-2012 ... 12 Table 2.8: Number of car learner licensed vehicle controllers involved in crashes by BAC
category, 2004 – 2012 (WA) ... 13 Table 2.9: Number of car probationary licensed vehicle controllers involved in crashes
by BAC category, 2004 – 2012 (WA) ... 14 Table 2.10: Number of fully licensed vehicle controllers involved in crashes by BAC
category, 2004 – 2012 (WA)* ... 15 Table 2.11: Number of unlicensed car vehicle controllers involved in crashes by BAC
category, 2004 – 2012 (WA) ... 15 Table 2.12: Number of truck controllers involved in crashes by BAC category,
2004 – 2012 (WA)... 16 Table 2.13: Number of bus controllers involved in crashes by BAC category,
2004 – 2012 (WA)... 16 Table 2.14: Number of learner motorcyclists involved in crashes by BAC category,
2004 – 2012 (WA)... 17 Table 2.15: Number of probationary licensed motorcyclists involved in crashes by BAC
category, 2004 – 2012 (WA) ... 17 Table 2.16: Number of fully licensed motorcyclists involved in crashes by BAC category,
2004 – 2012 (WA) ... 18 Table 2.17: Number of motorcyclists without a valid licence involved in crashes by BAC
category, 2004 – 2012 (WA) ... 18 Table 2.18: Number of serious casualties involving alcohol as a crash factor, with number
and percentage shown for all persons and those younger than 30, 2006–2012,
Tasmania ... 19 Table 2.19: Number and percentage of drivers with blood alcohol suspected or proven in
crashes, NZ, 2010-2012 ... 20 Table 2.20: Number and percentage of drivers/riders administered an evidential breath test
by BAC category, Victoria 2008-2012 ... 21 Table 2.21: Number and percentage of evidential breath tests by BAC category and age,
Victoria, 2008–2012 ... 22 Table 2.22: Number and percentage of evidential breath tests performed, by licence type
and BAC level, Victoria, 2008–2012 ... 23 Table 2.23: Number and percentage of evidential breath tests performed by vehicle type
and BAC, Victoria, 2008 – 2012 ... 24 Table 2.24: Number and percentage of motor vehicle controllers with illegal BAC levels
involved in a crash, by BAC range and age, NSW, 2003-2012 ... 27 Table 2.25: Number and percentage of licences issued with an interlock condition in NSW,
2003-2012 ... 27 Table 2.26: Number and percentage of offenders by BAC category and age, QLD, 2008-2012 ... 28 Table 2.27: Number and percentage of alcohol interlock condition licences issued, by age
and sex, QLD, 2011-2013 ... 29 Table 2.28: Number and percentage of BAC offences across vehicle and licence type as at
Table 2.29: Number of positive breath tests recorded by licence type and vehicle type,
WA, 2004–2012 ... 31
Table 2.30: Number and percentage of drink-drive offenders by age and sex, NZ, 2008 – 2012 .... 34
Table 2.31: Number of drink-driving offences and percentage change for drivers/riders under 20 according to BAC, NZ, 2010 – 2013 ... 34
Table 2.32: Number and percent of drink-driving offenders by age and BAC, NZ, 2012 ... 35
Table 2.33: Drink-driving convictions and sentencing types issued, NZ, 2012 / 2013 ... 36
Table 3.1: Blood alcohol concentration limits and key features of alcohol ignition interlock programs ... 44
Table 3.2: Characteristics of Alcohol Interlock Programs across Australasian Jurisdictions ... 46
Table 3.3: Assessment of Alcohol Interlock Programs across Three States in the United States ... 63
Table 3.4: Comparison of Alcohol Interlock Programs in Sweden, the Netherlands and British Columbia (Canada) ... 69
Table 3.5: Penalties for drink-driving offences in British Columbia ... 81
Table 3.6: Driver Premium Charges in British Columbia ... 83
Table 4.1: Overview of alcohol interlock program effectiveness ... 93
Table 5.1: Program cost elements ... 103
Table 6.1: Survey respondents by State and Territory, by gender – weighted analysis ... 113
Table 6.2: Support for the compulsory fitment of alcohol interlocks ... 122
Figures Figure 2.1: Census of recidivist drink-driving offenders in Victoria, as at 31 October 2011 ... 25
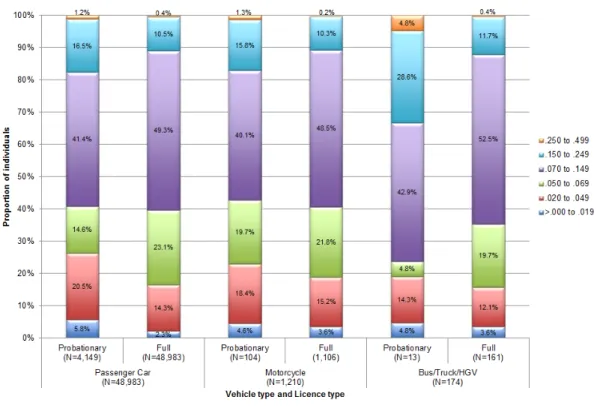
Figure 2.2: RBT BAC level (%) across licence type and vehicle type, WA, 2009 to 2012 ... 32
Figure 2.3: Number of RBTs conducted and proportion of controllers with a positive BAC result, ACT, 2012-2013 ... 32
Figure 2.4: Number of RBT conducted and proportion of offenders, NZ, 2007/8-2012/13 ... 33
Figure 2.5: Percentage distribution of sentence types for drink-drive offenders, by number of prior convictions, NZ, 2013 ... 37
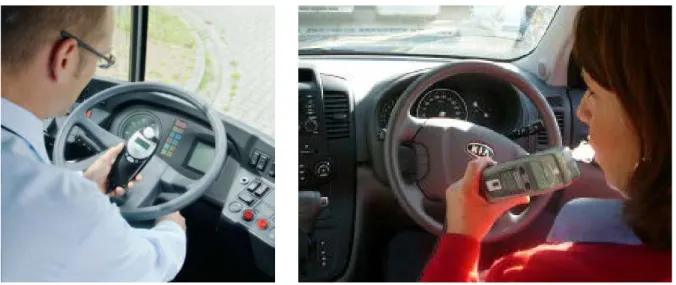
Figure 5.1: Alcohol interlock units ... 100
Figure 5.2: Alcohol Interlock units used in occupational and non-occupational settings ... 101
Figure 5.3: Alcohol interlock model approved for use in New York State (LifeSafer)... 106
Figure 5.4: Image of a Tissue Spectrometer ... 107
Figure 5.5: Example of an integrated transdermal alcohol ignition interlock embedded within the steering wheel ... 109
Figure 6.1: Percent of respondents stating alcohol interlocks would be of personal use ... 115
Figure 6.2: Percent of respondents stating they would find an alcohol interlock personally useful, by age ... 116
Figure 6.3: Percent of respondents stating they would find an alcohol interlock personally useful, by age and gender ... 117
Figure 6.4: Percent of respondents stating they would find an alcohol interlock personally useful by type of company vehicle driven ... 119
Figure 6.5: Level of agreement that the government should alcohol interlock technology compulsory for driver-vehicle categories, all respondents (Australia) ... 120
Figure 6.6: Level of agreement among respondents 18 – 21 and 22 – 25 years of age for compulsory fitment of alcohol interlocks by all probationary drivers, by whether they currently hold a probationary drivers licence ... 121
1. Overview
1.1 Background
1.1.1 Alcohol and Drink-driving
The association between alcohol consumption, crash risk and road crashes is well established (Allsop, 1966; Blomberg, Peck, Moskowitz, Burns, & Fiorentino, 2005; Borkenstein, Crowther, Shumate, Ziel, & Zylman, 1974; Peden et al., 2004). Globally, in 2012 15% of all road deaths and 13% of measured morbidity1 was directly attributed to alcohol, while in Australia the World Health Organisation (WHO) estimated that in 2010 the age-standardised death rate (ASDR2) per 100,000 of the population was 10 for males and 4 for females, and that 12% of male and 5% of female road deaths were directly attributable to alcohol3 (World Health Organisation, 2014). Using a different metric, this being whether a driver involved in a fatality crash has an illegal blood alcohol concentration (BAC), local statistics demonstrate that alcohol intoxication is associated with up to one-third of deaths in Australia and New Zealand (Australian Transport Council, 2011; Mills, Hodge, Johansson, & Conigrave, 2008).
In recognition of the association between BAC and crash risk and the number of alcohol-related road deaths, jurisdictions have implemented a range of countermeasures to prevent drink-driving. These
countermeasures include community education programs delivered through mass and social media, as well as overt and covert police enforcement. These programs support legislation that carries significant penalties for those detected with an illegal BAC.
Despite significant investment in anti-drink-drive education and enforcement, some road users continue to drink-drive. The range of penalties include the loss of demerit points, a fine, suspension or cancellation of licence, prison, and - depending on the number of previous offences and/or the BAC level - the requirement to fit an alcohol interlock for a specified period when the offender regains their licence.
Alcohol interlocks are seen to be an effective way of preventing future drink-driving offences among known offenders. This report aims to identify opportunities to expand alcohol interlock programs beyond the current offender-based groups as a preventative road safety countermeasure.
1.1.2 Alcohol Interlock Programs
Traditional countermeasures to address drink-driving offenders and recidivist drink-drivers have used punitive approaches such as incarceration, fines, vehicle impoundment and licence revocation (Voas, DuPont, Talpins, & Shea, 2011; Willis, Lybrand, & Bellamy, 2004). Although such sanctions have demonstrated some evidence of effectiveness in reducing recidivism (Elder et al., 2011), negative
consequences include invasiveness of the countermeasure (e.g. incarceration) and adverse effects on family members (e.g. vehicle impoundment). This has led researchers to explore alternative methods for managing drink-driving offenders. One alternative is the implementation of alcohol interlock programs that can help to prevent drink-driving, provided the interlocks are fitted and used appropriately (Lahausse, Fitzharris, & Fildes, 2007).
1 measured in days-adjusted life years lost
2 ASDR: age-standardised death rate - the number of deaths attributable to alcohol consumption; these deaths that would not have occurred without the presence of alcohol.
3 AAF: alcohol attributed fraction – the proportion of all diseases and deaths that are attributable to alcohol. AAFs are used to quantify the contribution of alcohol as a risk factor to disease or death. AAFs can be interpreted as the proportion of deaths or burden of disease which would disappear if there had not been any alcohol
An alcohol interlock requires a driver to provide a sample of breath before the vehicle can start. The driver’s BAC must be lower than a pre-set threshold of the interlock. If sufficient alcohol is detected in the breath sample, the interlock prevents the vehicle from being started for a period of time4. In addition to the initial vehicle ignition test, drivers are retested while the vehicle is running in order to capture any attempts at circumventing the device. Many alcohol interlocks are commercially available, each with different functional requirements. By preventing ignition of the vehicle, alcohol interlocks remove the decision around “whether to drive” for individuals who are under the influence of alcohol and have reduced self-control (Lahausse et al., 2007; Willis et al., 2004). Their primary goal is to separate drinking and driving behaviour.
Since their introduction, alcohol interlocks have gained broad acceptance by road safety stakeholders - including the police, researchers and community groups - as a preventative tool against recidivist drink-driving behaviour. Offender-based alcohol interlock programs operate in Asia, United States, Canada and Europe and are widely accepted by the community (Bax, Kärki, Evers, Bernhoft, & Mathijssen, 2001; Willis et al., 2004). The design of alcohol interlock programs is pivotal to effectiveness and public acceptance
(Marques & Voas, 2010; Voas et al., 2011). A range of factors must be considered and weighted. Generally, alcohol interlock programs are voluntary or court-mandated and can vary in eligibility criteria and program structure across jurisdictions.
At present, research into the effectiveness of alcohol interlock programs has been constrained by the differential uptake of alcohol interlocks and their use (Elder et al., 2011; Willis et al., 2004). Despite this, a handful of well-designed studies have demonstrated their value as a preventative drink-driving tool. In general, the implementation of alcohol interlock programs has predominantly targeted first-time ‘high-range drink-driving offenders’ and/or recidivist offenders. Evaluations of these programs demonstrate that they reduce and/or prevent drink-driving behaviour when installed (Elder et al., 2011; Willis et al., 2004). Studies also support this finding for first-time offenders (Willis et al., 2004). However, there is no conclusive evidence to suggest long-term behavioural changes related to drink-driving are maintained after an interlock is removed (Willis et al., 2004). This makes it challenging to determine when the offender is permitted to remove the alcohol interlock and what incremental steps, if any (e.g., alcohol-related counselling), the offender must undertake prior to removal.
1.2 Purpose
This report aims to meet the specific objective as stated by the Austroads Project Brief:
To research the evidence base and develop options to extend the coverage of alcohol interlock programs to a wider segment of drink-driving offenders, other high risk groups, corporate fleets, and if appropriate, the broader driving population on a voluntary basis.
In outlining this objective, the Austroads Project Brief notes the role that alcohol interlocks play in mitigating the behaviour of ‘a substantial proportion of drink-drivers [that] are not responsive to mainstream deterrence measures due to serious alcohol abuse, underlying health issues such as alcohol dependency and broader social problems’.
This objective is thus premised upon the success of offender-based alcohol interlock programs and the notion that ‘ with the widespread implementation of alcohol interlocks, then drink-driving and associated crashes could virtually be eliminated’ (Austroads Project Brief). Specific mention is made of expanding current alcohol interlock programs first to other drink-driving offenders and high-risk groups (e.g., novice drivers), and the eventual uptake by public transport vehicles and corporate fleets.
4 A distinction in this report is made for an ‘intervening’ alcohol interlock and an ‘advisory’ alcohol interlock. The intervening interlock is most common, and locks out the driver from starting the vehicle for a pre-set period of time. An advisory-only interlock requires the driver to take an initial test, but does not prevent the vehicle ignition in the event of a test fail; rather, it advises the driver of the BAC result only.
Specific tasks include:
1. Investigate the scope for increasing the coverage of interlock programs beyond drink-driving offenders 2. Conduct an analysis of the issues, barriers or enablers relating to the wider application of alcohol
interlocks in the driving population
3. Outline ways to encourage take up of alcohol interlocks in fleets. Other considerations include:
• future availability of suitable devices
• overcoming the perception of interlocks as a punitive measure
• transportability of alcohol interlocks between jurisdictions, including in relation to driver licencing conditions and access to technical support
• ease of installation
• ease of use and intrusiveness from an end-user perspective.
In addition, the Project Brief states that the report should cover enforcement of non-compliance with the alcohol interlock, including any statistics, concerning breaches; such breaches include driving a vehicle without an interlock or exceeding any number or allowable BAC blows in excess of a predetermined limit within a service period.
To achieve this aim, Austroads outlined the following objectives:
1. Review, compare and contrast the features of established alcohol interlock programs currently implemented in Australia and New Zealand, relative to international programs
2. Evaluate existing research literature on the effectiveness of alcohol interlock technologies and their respective programs, as well as factors influencing their success or otherwise
3. Engage relevant stakeholders and the public to assess perceptions and attitudes towards the uptake, and potential extension of existing alcohol interlock programs
4. Identify advantages for organisations with fleets for installing interlocks and ways in which organisations can be encouraged to consider installation for their fleets, including passenger transport vehicles and heavy vehicles
5. Identify advantages for non-fleet high-risk driver groups such as novices, and ways in which they can be encouraged to install interlock devices
6. Identify suitable options for implementation by Australasian licensing authorities.
Completing the proposed objectives will deliver an understanding of the barriers, underlying effectiveness and acceptability of alcohol interlock programs. Synthesis of findings from each objective will underpin proposed options to extend the coverage of alcohol interlock programs from theoretical, practical and policy perspectives.
1.3 Structure of Report
The report comprises seven Chapters, as described below:
• Chapter 1. Overview. This provides the background and rationale for the established research focus of
the report, highlighting project requirements as per the Austroads Project Brief.
• Chapter 2. The Magnitude of Drink-Driving: An Analysis of crash data, offence data and interlock
orders across Australasian jurisdictions. Implicit within the overall project objective is an
understanding of high-risk driver and rider groups. Defining the existing drink-driving problem using a combination of crash data, drink-driving offence data and the demographic profile of participants in alcohol interlock programs, provides a comprehensive understanding of key target groups for alcohol interlock program expansion. This analysis sets the basis for recommendations to expand current alcohol interlock programs.
• Chapter 3. A review of Australasian and International Alcohol Interlock Programs. As a specific
project requirement, the establishment of a matrix that highlights the similarities and differences across programs throughout the world provides the basis to identify opportunities to expand or refine programs.
• Chapter 4. Effectiveness of alcohol interlocks in reducing drink-driving. A specific objective of the
project is to evaluate researchon the effectiveness of alcohol interlocks and programs, as well as factors influencing their effectiveness. Consideration is given to consumption patterns characterised as binge drinking vs. alcohol dependency in terms of preventing drink-driving episodes and the prospects of recidivism.
• Chapter 5. Alcohol Interlock Technology. This Chapter assesses the capabilities of current alcohol
interlocks and examines future measurement technologies and any implications for broader monitoring of drivers in different contexts. It addresses ease of use, availability and features including recording and storing each breath test.
• Chapter 6. Attitudes toward the fitment of alcohol interlock devices. Community attitudes toward
drink-driving and alcohol interlocks were assessed via a national survey of 5,544 respondents. The survey items were specifically designed to gauge the level of agreement for the expansion of alcohol interlocks to various driver-rider/vehicle combinations.
• Chapter 7. Options to Extend Coverage of Alcohol Interlock Programs. This Chapter outlines
options to extend the coverage of alcohol interlock programs into different vehicle controller groups.
1.4 Project Scope and Use of the Report
This project researches the evidence base and develops options to extend the coverage of alcohol interlock programs to a wider segment of drink-driving offenders, other high-risk groups, corporate fleets, and if appropriate, the broader driving population on a voluntary basis. It does this by:
• describing current drink-driving legislation and alcohol interlock program requirements in Australasia • drawing on crash and BAC offence data to identify gaps in current coverage where expansion would
seem logical and defensible
• examining and identifying gaps in the coverage of current alcohol interlock programs
• considering evaluations of alcohol interlock programs to understand which factors influence effectiveness • reviewing current and future alcohol interlock technology to clarify system specification, cost and device
calibration issues
• documenting community attitudes toward the expansion of alcohol interlocks
• examining options to expand alcohol interlock programs to a broader group of offender and non-offender vehicle drivers.
This report will facilitate decisions regarding the expansion of alcohol interlock programs. The construction of a regulatory case to mandate these changes is beyond the scope of this report; however, its data could be used for any future cost-effectiveness evaluations.
2. The Magnitude of Drink-Driving: An Analysis of
Crash Data, Offence Data and Interlock Orders
2.1 Introduction
Assessing options to expand the coverage of alcohol interlocks requires an understanding of the extent of drink-driving in the community. This includes knowledge around which road users engage in drink-driving behaviour with regard to age, gender, licence type and vehicle type. This information can then be used to support any expansion of alcohol interlock fitment programs to high risk groups.
Summary: The enumeration of the current drink-driving problem helps to identify target groups for the
expansion of existing alcohol interlock programs.
Crash data from each of the Australian States and Territories and New Zealand indicates that a high number fatality and serious injury crashes involve alcohol, despite continued high levels of drink-drive enforcement.
In Victoria, for instance, approximately 25% of drivers in fatal crashes and 20% of injured drivers had an illegal BAC from 2007-2010. In New Zealand, 20% of drivers in fatal crashes and 14% of serious injury crashes were alcohol-related from 2010-2012.
Similarly, drink-driving offence data suggests there is a persistent, ongoing and significant drink-driving problem throughout Australia. For example, approximately 15,000 offenders are detected in Victoria per annum, while from 2003 – 2012 nearly 250,000 drink-drive offences were detected in NSW. Nearly 105,000 offences were detected in Queensland from 2009 to 2012. The data demonstrates the pervasive nature of drink-driving behaviour across all licence types, including disqualified and 0.00 BAC alcohol condition licensed drivers. The analysis provides a breakdown by vehicle type, age and sex for a number of jurisdictions. The high number of disqualified drivers engaging in drink-driving behaviour and the number of recidivist offenders is concerning. In jurisdictions where the demographics characteristics of offenders was known (Vic, NSW, QLD, NZ), at least three-quarters were male, and young drivers accounted for approximately 40% of offences. A small proportion of drivers have multiple offences. This analysis highlights the need for continued high levels of enforcement and community education. It supports the case for expanding existing alcohol interlock programs, as considerable road safety benefits could be achieved by their widespread use.
2.2 Available data
Crash and BAC offence data was obtained from five Australian States and Territories. As each dataset is independent, differences exist in the variables and the BAC reporting category, limiting the ability to discuss jurisdictional differences. It is, therefore, not the intention to compare jurisdictions. Data from publicly available reports was used in the absence of source data for the ACT, the NT and New Zealand.
Victorian Data: The Victorian analyses used multiple information sources in the absence of source data,
including:
• drink-driving offence (aggregate) data supplied by Victoria Police for the period 2008 – 2012 (Corporate Statistics)
• published statistics relating to alcohol-involved fatality and injury crashes • published statistics regarding the Victorian alcohol interlock program
• various published reports to examine the problem of repeat drink-drivers and drivers caught driving while disqualified.
New South Wales (NSW) Data: The NSW analyses comprised data from the Centre for Road Safety,
Transport for NSW:
• crash data for 2003 to 2012 (inclusive)
• alcohol interlock data obtained for 2003 to 2012 (inclusive).
Queensland Data: The Queensland analyses comprised three databases supplied by the Department of
Transport and Main Roads (TMR):
• crash data for 2003 to 2012 (inclusive) • offence data for 2003 to 2012 (inclusive)
• alcohol interlock condition data for 2011 to 2013 (inclusive).
South Australia Data: The South Australia analyses comprised three databases supplied by the Transport
Services Division, Department of Planning, Transport & Infrastructure: • crash data for 2003 to 2012 (inclusive);
• offence data for 2003 to 2012 (inclusive) with the exclusion of unlicensed offenders • alcohol interlock condition data for 2003 to 2012 (inclusive).
Western Australia Data: The Western Australia analyses comprised three databases:
• RBT BAC data for 2004 to 2012 inclusive, supplied by WA Police
• BAC data for controllers involved in fatality, serious injury, medical attention required, and property damage only crashes, for 2004 to 2012 inclusive, supplied by the WA Office of Road Safety.
Other jurisdictions: No source data was made available from the ACT, the NT and New Zealand. Published
sources were used exclusively to describe the number of alcohol involved crashes in these jurisdictions.
A note on terminology: Throughout this report the term ‘probationary’ is used, however a number of
jurisdictions refer to these newly licensed solo drivers as having a ‘provisional licence’. The term ‘probationary’ is used throughout the report for simplicity.
The term ‘novice’ driver is taken to mean newly licensed, which can include learner licence holders and / or probationary (provisional’) licence holders. The term ‘novice’ is used when referring to alcohol interlock programs, legislation and offences.
2.3 Alcohol-related crashes
2.3.1 Alcohol-related fatality and injury crashes in Victoria
The number of drivers/riders killed and tested for alcohol during 2007 – 2010 inclusive is presented in Table 2.1. In 2007, 29% of fatally injured and tested drivers/riders had a BAC ≥ 0.05 g/100ml, and of these, 53% exceeded a BAC of 0.149. There is an apparent trend toward a reduction over time of drivers/riders killed with a BAC exceeding 0.049, with 24% of those killed (and tested) in 2010 exceeding 0.05. It is noteworthy, however, that the number of drivers/riders with unknown BAC results also increased between 2007 and 2010 from four to 12 drivers/riders.
The age distribution of drivers/riders exceeding a BAC of 0.049 is also presented in Table 2.1. Most, if not all, drivers/riders under 21 years would have a 0.00 BAC requirement, as would a proportion of those aged 21 – 29. For drivers/riders killed between 2007 and 2010 who had a BAC ≥ 0.05, 80% were less than 40 years, with the 21 – 29 age group accounting for nearly half these deaths. Of those killed with a BAC ≥ 0.05 in 2010, 15% were aged less than 21.
Table 2.1: Number and percentage of drivers/riders killed by BAC, Victoria 2007-2010 Year (n, (%)) 2007† 2008‡ 2009‡ 2010‡ BAC category < 0.05 152 153 126 131 ≥ 0.05 62 (29%) 57 (27%) 43 (25%) 41 (24%) ≥ 0.15 32 (15%) 32 (15%) 27 (16%) 21 (12%) % ≥ 0.15 of ≥ 0.05 53% 56% 63% 51% BAC Unknown 4 2 5 12
Age distribution of drivers/riders with BAC ≥ 0.05
< 21 18% 18% 19% 15%
21-29 19% 35% 28% 39%
30-39 32% 20% 19% 27%
40+ 19% 27% 35% 20%
† TAC Road Safety Statistical Summary, February 2009; ‡ TAC Road Safety Statistical Summary, January 2014
Alcohol-related injury crashes
Boorman (2013) presented data on the BAC level for drivers hospitalised as a result of crashes in 2011 (Table 2.2). Of the 2,929 injured drivers/riders tested for alcohol and other drugs, 21% (628) tested positive to alcohol (alcohol alone: 490; alcohol + other drugs: 138). The BAC distribution among the 628 drivers/riders with alcohol detected is presented below. No demographic information was available for these drivers.
Table 2.2: Number and percentage of drivers admitted to hospital by BAC, Victoria 2011
BAC category Number Percent
(of 628)
Percent of injured drivers (of 2929) 0.02 – 0.049 11 1.75 0.37 0.05- 0.069 58 9.3 1.98 0.07- 0.099 126 20.0 4.30 0.10 – 0.149 186 29.6 6.35 ≥ 0.015 247 39.3 8.43 Total 628 100 21.4%
2.3.2 Alcohol-related fatality and injury crashes in New South Wales (NSW)
Table 2.3 presents data on crash-involved motor vehicle controllers by BAC category for 2003 - 2012 in NSW. Across the 10-year period, 65% to 72% of crash-involved controllers had a BAC of 0.00. The BAC was unknown for 25% to 32% of controllers involved in a crash. Approximately 3% of controllers involved in a crash resulting in an injury had a BAC ≥ 0.05.
Table 2.3: Number and percentage of motor vehicle controllers involved in a crash by BAC, NSW, 2003-2012 BAC category Crash year 2003 n (%) 2004 n (%) 2005 n (%) 2006 n (%) 2007 n (%) 2008 n (%) 2009 n (%) 2010 n (%) 2011 n (%) 2012 n (%) 0 23,152 (65) 23,385 (67) 22,721 (68) 23,441 (70) 23,991 (71) 22,175 (70) 22,100 (70) 23,204 (71) 24,284 (72) 22,166 (72) >.000 to.019 73 (< 1) 83 (< 1) 81 (< 1 ) 113 (< 1) 112 (< 1) 127 (< 1) 96 (< 1) 107 (< 1) 105 (< 1) 83 (< 1) .020 to .049 134 (< 1) 128 (< 1) 120 (< 1) 133 (< 1) 137 (< 1) 144 (< 1) 113 (< 1) 118 (< 1) 112 (< 1) 124 (< 1) .050 to .079 151 (< 1) 136 (< 1) 144 (< 1) 140 (< 1) 159 (< 1) 114 (< 1) 144 (< 1) 127 (< 1) 119 (< 1) 87 (< 1) .080 to .149 452 (1) 421 (1) 387 (1) 466 (1) 441 (1) 447 (< 1) 409 (1) 365 (1) 357 (1) 322 (1) .150 and higher 542 (2) 522 (2) 449 (1) 479 (1) 528 (2) 476 (2) 494 (2) 374 (1) 395 (1) 354 (1) Unknown 11,281 (32) 10,002 (29) 9,269 (28) 8,582 (26) 8,596 (25) 8,234 (26) 8,302 (26) 8,224 (25) 8,382 (25) 7,547 (25) Total 35,785 34,677 33,171 33,354 33,964 31,717 31,658 32,519 33,754 30,683
In 2003 – 2012, there were 10,387 controllers either injured or killed who had an illegal BAC (Table 2.4). Males comprised 87% of fatalities and 80% of persons injured. The largest proportion of controllers with an illegal BAC were those aged 30-39, accounting for 23% of controllers killed or injured that had an illegal BAC, followed by those aged 20 – 25 (21%). Controllers aged 17 – 20 accounted for 16% of drivers killed or injured over the 10-year period that were detected driving with an illegal BAC.
Table 2.4: Number and percentage of controllers with an illegal BAC involved in fatality and injury crashes by age, NSW, 2003-2012
Age Group Number Percent
5-16 89 0.9% 17-20 1,666 16.0% 21-25 2,165 20.8% 26-29 1,257 12.1% 30-39 2,362 22.7% 40-49 1,647 15.9% 50-59 744 7.2% 60-69 311 3.0% 70+ 142 1.4% Unknown 4 0.04% Total 10,387 100.0%