Climate Change Impacts on
Droughts
Desertification, Land
Degradation and
Drought (DLDD), and
bio-physical modelling
for crop yield estimation
in Latin America under a
changing climate
Deliverable No. 8
Carrão, H., Naumann, G., and Barbosa, P.
This publication is a Technical report by the Joint Research Centre (JRC), the European Commission’s science and knowledge service. It aims to provide evidence-based scientific support to the European policymaking process. The scientific output expressed does not imply a policy position of the European Commission. Neither the European Commission nor any person acting on behalf of the Commission is responsible for the use that might be made of this publication.
Contact information Name: Paulo Barbosa
Email: [email protected] JRC Science Hub
https://ec.europa.eu/jrc JRC104402
EUR 28332 EN
PDF ISBN 978-92-79-64586-0 ISSN 1831-9424 doi:10.2788/812978 Print ISBN 978-92-79-64585-3 ISSN 1018-5593 doi:10.2788/38233
Luxembourg: Publications Office of the European Union, 2016 © European Union, 2016
The reuse of the document is authorised, provided the source is acknowledged and the original meaning or message of the texts are not distorted. The European Commission shall not be held liable for any consequences stemming from the reuse.
How to cite this report: Carrão, H., Naumann, G., and Barbosa, P., Climate Change Impacts on Droughts, EUR 28332 EN; doi:10.2788/812978
Contents
1 Executive Summary 1
2 Introduction 2
3 Datasets and Statistical Methods 4
3.1 Drought hazard estimation: the Weighted Anomaly of Standardized Precipitation
(WASP) . . . 4
3.2 Climate model simulations: the ISI-MIP Dataset . . . 4
3.3 Statistical methods . . . 5
3.3.1 Ensemble consistency of simulations . . . 6
3.3.2 Robustness and significance of climate projections . . . 7
4 Results and Discussion 9 4.1 Identifying and characterizing the major Amazonian droughts in the last decade with the WASP-index . . . 9
4.2 Global analysis of contemporary drought hazard from observations and climate models . . . 10
4.3 Future Changes in Global Drought Hazard . . . 13
4.3.1 Projections in South-Central America for the period 2021-2050 . . . 14
4.3.2 Projections in South-Central America for the period 2071-2099 . . . 15
List of Figures
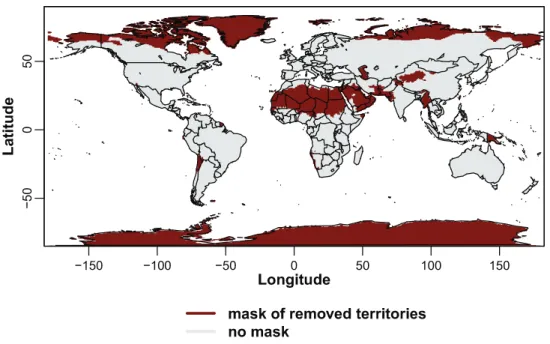
3.1 Hyperarid and cold regions excluded from global drought change analysis. . . 8 4.1 Geographic distribution of maximum annual drought severity (as measured by
accumulated monthly WASP-index values) in the Amazon basin for 2001, 2005 and 2010. . . 9 4.2 Global maps of drought hazard for the period 1971-2000: a) computed with
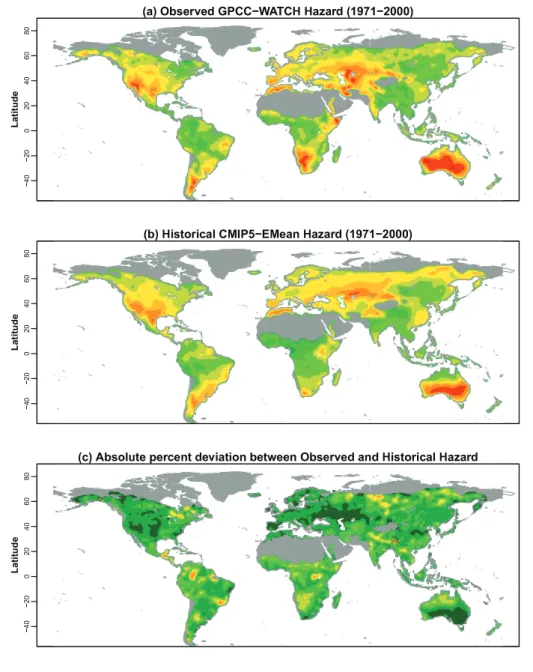
monthly precipitation totals from GPCCv4-WATCH forcing data; b) computed with CMIP5-EMean; c) absolute percentage change between maps (a) and (b). The Semi-Arid Region of Northeast Brazil (SARNB) is delimited in black. . . 11 4.3 Geographic agreement between the ensemble mean drought hazard
(CMIP5-EMean) and the drought hazard computed from the GPCCv4-WATCH forcing data. . . 13 4.4 Percentage change in CMIP5-EMean drought hazard (dH) from the reference
period (1971–2000) to the near future (2021–2050, left) and future (2071–99, right). 14 4.5 Model agreement in the direction of mean severity change (4 out of 5 indicates
at least 80% agree with positive change; 2 out of 5 indicates at least 80% with negative change). . . 15 4.6 p-value for CMIP5-EM percentage changes in severity as computed with the
Mann-Whitney-Wilcoxon test. . . 16 4.7 (a) Percentage change under RCP8.5 in CMIP5-EMean drought hazard (dH)
between the reference period (1971–2000) and future (2071–2099) for South-Central America. (b) Robustness and (c) significance of dH changes. . . 17
List of Tables
3.1 CMIP5 climate model simulations used in this study. . . 5 4.1 Pearson product-moment correlation coefficient (r) between the drought hazard
computed with monthly precipitation totals from GPCCv4-WATCH forcing data for the period 1971–2000 and the drought hazard computed with monthly precip-itation totals from CMIP5 models (ensemble median and mean, and individual models) for the same time period. . . 12
1 Executive Summary
This Technical Report was developed in the framework of Component 3 of the second phase of the Programme EUROCLIMA: “Sustainable Agriculture, Food Security and Climate Change in Latin America: Strengthening the capacities of key stakeholders to adapt agriculture to climate change and mitigate its effects”. EUROCLIMA is a regional cooperation program between the European Union and Latin America aiming at facilitating the integration of mitigation and adaptation strategies into climate change public policies and development plans in Latin America. In the framework of EUROCLIMA, EU development assistance funding has been provided through the Commission’s Directorate General for International Cooperation and Development (AA JRC No. 2013/332-909) to work on the topics of Desertification, Land Degradation and Drought (DLDD), as well as on bio-physical modelling for crop yield estimation in Latin America.
This study makes use of the most current General Circulation Models (GCMs) forced with CMIP5 climate projections to quantify the projected changes in intra-annual drought charac-teristics for South–Central America during the next century at a fine gridded scale. Since the analysis is based on GCMs and South–Central America region is part of the integrated framework that contributes to the global conditions used to stimulate the various climate projections, we decided also to conduct our analysis from a global to a continental perspective (in order to place South–Central America in the globe).
Projections of drought hazard are quantified using the Weighted Anomaly of Standardized Precipitation (WASP) index, which normalizes accumulated precipitation for a specific location and time of year, and allows to discard large anomalies that result from small precipitation amounts occurring near the beginning or end of dry seasons. Climate projections are based on the output from ISI-MIP (the Inter-Sectoral Impact Models Intercomparison Project), which provides high resolution global downscaled climate scenarios that have been extensively tested for numerous regions around the globe, including South–Central America. WASP is calculated on a gridded scale with a horizontal resolution of 0.5o (≈50kmat the equator) for three projected
emission pathways (i.e. rcp2.6, rcp4.5, and rcp8.5). Models are used for comparing drought hazard (dH) during two future time periods (2021-2050, and 2071-2099) to the historical control period (1971-2000). Under contemporary climate, we have evaluated the ability of the WASP-index to depict the major Amazonian droughts in the last decade. We have selected this region because the 2005 and 2010 Amazon droughts were both characterized as “100yr events”, and their socioeconomic impacts were well documented by numerous studies carried out to identify their origins and characterize their dynamics. Severity values show good agreement with the outcomes of drought indicators that relate to specific hydro-ecological impacts of absolute local precipitation deficits on Amazon rainforest for that period. For the future, and with a few exceptions, climate models show increasing drought hazard for South–Central America under all RCPs. It was found that projections of dH changes for most regions are neither robust nor significant in the near future, whereas significant increases for Mexico’s Pacific coast, the Central American Dry Corridor (CADC), the Amazon region and Central Chile emerge by the end of the century.
2 Introduction
Drought is a recurring and extreme climate event that is originated by a temporary water deficit and may be related to a lack of precipitation, soil moisture, streamflow, or any combination of the three taking place at the same time [1]. Drought differs from other hazard types in several ways. First, unlike earthquakes, floods or tsunamis that occur along generally well-defined fault lines, river valleys or coastlines, drought can occur anywhere (with the exception of desert regions where it does not have meaning) [2, 3]. Secondly, drought develops slowly, resulting from a prolonged period (from months to years) of precipitation that is below the average, or expected, value at a particular location [4, 5]. The immediate consequences of short-term droughts (i.e. a few weeks duration) are, for example, a fall in crop production, poor pasture growth and a decline in fodder supplies from crop residues, whereas prolonged water shortages (e.g. of several months or years duration) may, among others, lead to a reduction on hydro-electrical production and an increase of forest fire occurrences [6].
Given the major severe drought events of the last decade, e.g. the 2005 and 2010 Amazon droughts (both characterized as “100yr events” [7, 8, 9, 10, 11, 12, 13]), and the significant reliance of South–Central American economies on rain-fed agricultural yields (rain-fed crops contribute more than 80% of the total crop production in South-Central America [14]), then there is a large concern in the region about climate-change and climate-related impacts [15]. South–Central American countries have an important percentage of their GDP in agriculture (10% average [14]), and the region is a net exporter of food globally, accounting for 11% of the global value [16]. According to the agricultural statistics supplied by the United Nations Food and Agriculture Organization (FAO) [14], 65% of the world production of corn and more than 90% of the world production of soybeans are grown in Argentina, Brazil, the United States and China. Climate change has the potential to increase drought disasters by subjecting South–Central American regions to levels of drought frequency and severity not previously experienced. Indeed, the productivity of rain-fed crops is expected to decrease in the extensive plains located in middle and subtropical latitudes of South–Central America (e.g. Brazil and Argentina), leading to a reduction in the worldwide productivity of cattle farming and having adverse consequences to global food security [17, 18]. Therefore, projecting the spatial distribution of future drought frequency and severity in a non-stationary climate is of major importance for South–Central American countries. For example, [19] found that in Northeast Brazil and eastern Amazonia smaller or no changes are seen in projected precipitation intensity, though significant changes are seen in the frequency of consecutive dry periods.
This study examines the effects of climate change on the distribution and magnitude of drought hazard (dH) for South–Central America. The characteristics of drought events are estimated from monthly weighted precipitation deficits computed from the most recent climate change projections of General Circulation Models (GCMs), which were statistically downscaled to half-degree spatial resolution. The results of such analysis may motivate decision makers to respond earlier and effectively to mitigate the future impacts of foreseen global dryness on crop yields [20]. Indeed, information on the changing patterns of drought hazard can be used for deciding a particular crop or variety in a given location, and for breeding varieties of various maturity lengths. Moreover, it can be used in decision making with respect to supplementary irrigation and field operations in rain-fed agricultural activities in the future.
Since the timing of consecutive precipitation deficits relative to the cropping calendar have more impact on rain-fed agriculture than total seasonal or annual precipitation totals [21, 22, 23], then the contribution of months from rainy and dry periods to drought severity is proportional to the “weight” of absolute deficits in the annual cycle of precipitation [24, 25, 26]. It is known that a season with above-average precipitation totals over an agricultural region may not be any better than a below average season if precipitation is not well distributed in either time or space [22]. For crop cultivation, the consistency with which minimally required precipitation is received is more important than the total received over time [21]. Indeed, a lack of water is more
critical in the main season of occurrence, i.e. during the start of the rainy season and in the principal growth stages of rain-fed crops [27]. Therefore, the unbalanced estimation of drought severity during the rainy and dry seasons may mislead or delay mitigation actions, and result in significant impacts on people, the economy and the environment [28].
In this deliverable we, therefore, look at the characteristics of drought hazard derived from the Weighted Anomaly of Standardized Precipitation (WASP) index [29]. The reasons for selecting the WASP-index are threefold: (1) it is standardized in time and space; (2) allows to damp large standardized anomalies that result from small precipitation amounts occurring near the beginning or end of dry seasons; and (3) emphasizes anomalies during the heart of rainy seasons [30]. The WASP-index takes into account the annual seasonality of precipitation cycle and is computed by summing weighted standardized monthly precipitation anomalies; it is the sum of consecutive water deficits (e.g. daily, weekly, monthly or yearly) that determines the magnitude of drought hazard [31, 32]. In particular, we aim at:
• Assessing the ability of the WASP-index to detect the spatial distribution and magnitude of severe drought events for South-Central America using observation-based monthly precipitation records;
• Validating a suite of high resolution (0.5 x 0.5 degree) climate information forced with the best available Global Climate Model (GCM) projections for drought hazard characterization;
• Analyzing the robustness and significance of drought hazard changes during the next century (until 2099) from monthly WASP-index values computed under three emission scenarios; and
• Presenting a first attempt to link projected future changes in drought hazard to the management of drought-related impacts.
This report is organized as follows: section 3 describes the methods and data used in this study. In Section 4, we perform an analysis of contemporary drought and the WASP-index from observations and climate models, followed by a discussion about future changes in drought hazard (dH) and expected impacts for South-Central America. We conclude the deliverable with a summary of main achievements and their implications for drought risk management on Section 5.
3 Datasets and Statistical Methods
3.1 Drought hazard estimation: the Weighted Anomaly of Standardized Precipitation (WASP)
Hazard refers to the natural or human induced events that potentially damage different places singly or in combination [33]. In technical settings, hazards are described quantitatively by the probability that an event of a certain magnitude will occur at a certain place and time, as determined from historical data or scientific analysis [34, 35]. Since precipitation is a proxy indicator of the water available to the coupled human-environment system [36], then the frequency of abnormal precipitation deficits at some level of intensity can be used to represent drought hazard for drought-prone nations and regions, as similar as proposed by [37], [38], [39], and [40], to cite but a few.
To enable for the effects of pronounced precipitation seasonality in the estimation of drought intensity, we compute the magnitude of precipitation deficits by means of the Weighted Anomaly of Standardized Precipitation (WASP) index [29]. The WASP-index takes into account the annual seasonality of precipitation cycle and is computed by summing weighted standardized monthly precipitation anomalies, as follows [29]:
W ASP
j=
Pn,m≥τmP
Pn,m<τm P n,m−τm τm τm τA , (3.1)whereτm, 1≤m ≤12, defines the monthly threshold of meteorological drought onset, and τA =P12
m=1τmis the maximum annual precipitation deficit due to drought conditions. A drought
event j starts at yearnand month m ifPn,m < τm, and ends when Pn,m ≥τm. τm is computed from a time-series of precipitation totals, Pm,1, ..., Pm,N, collected for the reference period ofN
years. The thresholds of drought onset are derived by means of the “Fisher-Jenks” classification algorithm, which estimates the monthly precipitation values that optimize the partition of the time-series into “drought” and “non-drought” months, as described in [1].
In this study, drought hazard (dH) for regioniand time periodtis estimated as the probability of exceeding the median of global WASP-index values computed for all precipitation deficits within a reference period ofN years, as follows:
dHi,t = 1−P r{W ASPi,t ≤med (W ASPg,N)} (3.2) whereW ASPi,t represents the sorted set of WASP-index values for all precipitation deficits at regioniin time periodt, and med(W ASPg,N) denotes the 50th percentile of global WASP-index
values in the reference periodN.
3.2 Climate model simulations: the ISI-MIP Dataset
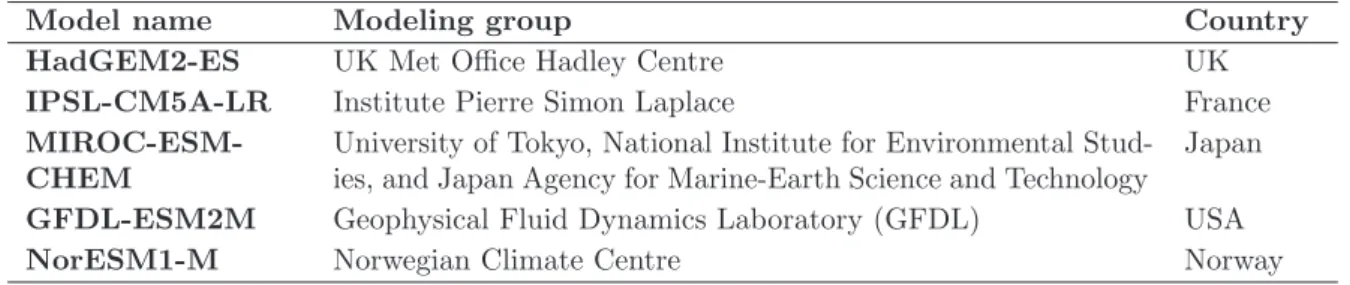
To estimate potential drought hazard changes in the future, we use high-resolution climate model simulations derived from state-of-the-art general circulation models (GCMs) collected through the Coupled Model Intercomparison Project Phase 5 (CMIP5, [41]) and exploited in the framework of ISI-MIP, the first Inter-Sectoral Impact Model Intercomparison Project [42]. ISI-MIP is designed to provide a consistent set of global impact projections in the agriculture, water, biome, health, and infrastructure sectors at different levels of global warming [43]. To provide the associated climate information for ISI-MIP, five CMIP5 simulations were selected, namely: HadGEM2-ES, IPSL-CM5A-LR, MIROC-ESM-CHEM, GFDL-ESM2M, and NorESM1-M (Table 3.1). These five models were selected based on the availability of daily data for the required variables covering the period from 1 January 1950 to 31 December 2099, i.e. historical and all Representative Concentration Pathway (RCP) scenarios in the CMIP5 archive at the beginning of the ISI-MIP project [43].
Table 3.1: CMIP5 climate model simulations used in this study.
Model name Modeling group Country
HadGEM2-ES UK Met Office Hadley Centre UK
IPSL-CM5A-LR Institute Pierre Simon Laplace France
MIROC-ESM-CHEM
University of Tokyo, National Institute for Environmental Stud-ies, and Japan Agency for Marine-Earth Science and Technology
Japan
GFDL-ESM2M Geophysical Fluid Dynamics Laboratory (GFDL) USA
NorESM1-M Norwegian Climate Centre Norway
The CMIP5 model simulations selected for the ISI-MIP climate dataset were bi-linearly interpolated in space to a 0.5o latitude/longitude spatial resolution grid, as described by [43]. Moreover, the time-series were linearly interpolated to the standard Gregorian calendar (365 days per year plus leap days) wherever necessary. The data were bias-corrected to ensure long-term statistical agreement with the observation-based GPCCv4-WATCH forcing data [44] over the period 1960-1999. The need for bias-correcting model projections is well known and impact models may be significantly dependent on the occurrence and frequency of extreme events [45]. Precipitation, and especially heavy precipitation, is strongly dependent on details of climate models parametrization (e.g. [46]), and the use of a bias-corrected multi-model ensemble gives more robust results in the prediction of climate change [47]. For instance, [48] showed that the bias-corrected data significantly improve the simulation of river flood for the present climate. Therefore, projected absolute trends in temperature and relative trends in precipitation and all other ISI-MIP variables were preserved by the bias-correction method, which was developed specifically for this project [43] and was based on the method described in [49]. Preservation of the temperature trends in each grid point also implies that the global warming trend and thus, in particular, the climate sensitivities of the GCMs, are preserved. The approach developed by [49] was previously used by [50] and [51] to perform the bias correction of ENSEMBLES daily series of temperature and precipitation. [50] showed that the bias correction improved significantly not only the present climate mean statistics but also the time-dependent properties, such as the number of consecutive dry days and the cumulative amount of rainfall for consecutive heavy precipitation days.
In this study, we concentrate in three emissions scenarios, termed Representative Concentration Pathways (RCP) by the Intergovernmental Panel on Climate Change (IPCC) and explained in detail in [52]. All scenarios specify radiative forcing relative to pre-Industrial conditions, with the 20th century increasing from 1.04 W/m2 to 2.08 W/m2 during the period 1971 to 2005. The
emissions scenarios deviate at 2005 and are named based on their radiative forcing values in 2100. The RCP8.5 scenario is the most severe, with greenhouse gases continuing to increase through the next century, resulting in radiative forcings of 8.5 W/m2, CO2 concentrations of
1370 pppm and a temperature anomaly of 4.9oC by 2100. The RCP4.5 scenario represents a
medium future scenario, where greenhouse gases and therefore radiation stabilize by the end of the century with an overshoot at 4.5 W/m2, 650 ppm CO2, and a temperature anomaly of 2.4oC.
The least severe future scenario is the RCP2.6, which includes a mid-century peak at 3 W/m2 before declining to 2.6 W/m2, 490 ppm CO
2, and a temperature anomaly of 1.5oC.
Calculation of the WASP-index (subsection 3.1) for contemporary and future climates relies only on near-surface daily precipitation (pr, kg m-2s-1), accumulated at the monthly temporal resolution.
3.3 Statistical methods
In this study, projections of drought hazard (dH), as well as the magnitude of their changes in a warming future, are estimated by means of the WASP-index values (subsection 3.1, Equation 3.1) calculated for all consecutive monthly precipitation deficits within three 30-year periodst:
(1) 1971-2000, (2) 2021-2050, and (3) 2071-2099, which we denote as present, near future, and future, respectively. Note that previous studies addressed both the frequency and intensity of projected drought changes, e.g. [53, 54, 55], to cite but a few. Here we focus on drought hazard only, which values summarize both statistics: a projected positive change of drought hazard results in a larger proportion of severe drought events and an increase of their median magnitude. Projected changes in drought hazard at each grid point are defined with respect to a reference period N, in our case 1971–2000 (present climate). In transient climate simulations, when the greenhouse forcing gradually changes, the assumption of stationarity is not necessarily valid, since, over a period of 50 years or more, the climate change signal can be significant [56]. In our case, however, since we use only 30-year time-series of model–simulated monthly precipitation totals, the climate change signal is expected to be small. Hence, with good approximation, we can treat 30 years as stationary [57].
3.3.1 Ensemble consistency of simulations
The climate models that we are using in this study are tools that have been developed to understand and to predict specific features of the real climate system of the Earth. In order to be useful for this purpose, it is necessary to evaluate the capability of such models to realistically represent these features [58, 59]. Therefore, before entering into the analysis of future changes in dH, we first evaluate its representation in the climate models for the reference period 1971-2000, assuming this to be representative of contemporary climate. Model evaluation is commonly based on the direct comparison between simulation results and measurements of individual observables (e.g. [60], [47] and [61]). Here we compare the simulated drought hazard from individual models, as well as the mean (CMIP5-EMean) and median (CMIP5-EMed) of their ensemble, to the drought hazard computed with monthly precipitation totals from the GPCCv4-WATCH forcing data. Differences at each grid point were quantified by means of the Pearson product-moment correlation coefficient, r, a widely used measure of the degree of linear dependence between two datasets [62]. The single model or ensemble statistic (mean or median) with the highest agreement is selected for projecting future changes in the geographic patterns and magnitudes of dH.
As some climate models predict a significant wetter climate, whereas others predict a drier one, there is an uncertainty that may have a large impact when the whole ensemble of data is used for deriving joint statistics, i.e. CMIP5-EMean and CMIP5-EMed [47]. For example, by considering the set of WASP-index values comprising all drought events from the five models together, the upper and lower extreme severity values of the full sorted data are those of the driest and wettest models, respectively. Thus, although three models predict severest droughts in the future and two milder ones, the future–past percentage changes may result in a negative number, indicating that the future climate is becoming milder, even if we have a larger number of models predicting a drier climate. The milder signal is due to the fact that the weighting given to each model is not equal. On the other hand, by estimating first the drought hazard for each single model and then computing the ensemble median, the same weight is given to each model, meaning that if three of the models project severest drought events and two milder events, the future climate will be classified as drier. Here we give the same weight to the five models and compute CMIP5-EMed as the median of single drought hazard values, as emphasized by [63, 64, 65, 47, 20]. Moreover, to perform a statistical sound comparison, we also compute CMIP5-EMean as the average of estimated hazard for each of the five individual models.
We also investigate the regional consistency between simulations and observations for contem-porary climate under the paradigm of a statistically indistinguishable ensemble. Despite the fact that the link between models’ performance for contemporary climate and the performance for a future climate is often not clear, the assessment of the ensemble consistency provides a necessary proxy for the evaluation of the ensemble accuracy in the future under large uncertainties and due to the lack of an observed climate [66, 58, 59]. In this type of analysis, the null hypothesis is that
observations and simulations are statistically indistinguishable and, therefore, are exchangeable with each other [67]. The concept of indistinguishability or exchangeability bases on the assump-tion that the observed climate system is sampled from the ensemble of climate models [66]. To assess whether the ensemble of simulated drought hazard can be considered to be consistent with the observed drought hazard, we use a robust and non-parametric location test based on the median absolute deviation about the median (MAD) of simulated drought hazard, which is computed as [68]:
M ADi =bi medi |xk−medi(x)|, (3.3)
wherexis the set of five hazard values from the CMIP5 climate ensemble,xkis the hazard value
computed from climate model k, andbi is a constant needed to make the estimator consistent for the distribution of interest [69]. For each grid point i, we empirically estimatebi = 1/Qi(0.75), as suggested by [70]. The consistence of the ensemble is assessed by testing the null hypothesis that the median hazard across all models is the same as the observed drought hazard for the contemporary climate. As proposed by [71, 69, 70], the null hypothesis can be rejected for test values > 2.5, which are computed as follows:
|xi−medi(x)|
M ADi , (3.4)
wherexi is the observed drought hazard computed from the GPCCv4-WATCH forcing data at grid point i.
3.3.2 Robustness and significance of climate projections
We should keep in mind that fluctuations in climate due to anthropogenic forcing, which cannot be predicted, are expected to occur and will augment or reduce the magnitude of natural climate change in the future [72]. To assess whether dH in a future time periodt is distinct from that in the reference period N, we used a method adapted from previous works, namely [73], [74] and [75], to cite but a few. This method identifies regions with relatively robust and significant drought changes from an ensemble of climate simulations, and can be applied to simulation results on regular model grids or to data aggregated onto larger regions. As pointed out by [73], there is a fundamental difference between lack of signal (i.e. lack of detection of a significant response to anthropogenic forcing) versus lack of agreement in the signal (i.e. regions where different models produce changes of opposite sign). Therefore, we use two statistical tests to analyze both the significance and robustness of future drought changes given by the ensemble of climate projections. Only regions that pass both tests are identified as regions with robust and significant drought changes.
The first test regards the agreement of individual simulations in terms of the direction of the changes, i.e robustness. We use the consensus between the five models to measure the uncertainties associated with natural variations and model errors, and defined robust changes in grid points where more than 80% of the models agree (i.e. 4 out of 5), as similar as [75, 76]. The idea is that if multiple models, based on different but plausible assumptions, simplifications and parameterizations, agree on a result, we have higher confidence than if the result is based on a single model, or if models disagree on the result [74].
In the second test, the projected changes are assessed by means of thep-values of the Mann-Whitney-Wilcoxon test [77, 67] for the ensemble of simulations, i.e significance. This statistical test, which is non-parametric and has the advantage of making no assumptions about the distribution of the data, is used to determine whether CMIP5-EMean computed for the reference period N (dHN) and future period t(dHt) are significantly different, precisely, whether or not
are drawn from the same distribution at a chosen level of significance (e.g. 5%). As similar as for [53], we only quantify the magnitude of drought changes for those grid points where the
null hypothesis that dHN and dHt are drawn from the same population is rejected at the 5%
significance level.
On account of the fact that dealing with drought concepts in contemporary hyperarid and cold regions is physically meaningless [29, 1, 78], we used the global aridity index dataset from [78] to exclude these areas from drought change analysis, as similar as [57] and [79]. Moreover, since GMCs have difficulty in simulating very dry conditions [80], the exclusion of the hyperarid regions from our analysis is also important because future precipitation changes are difficult to interpret there. As many authors have discussed, e.g. [81], [82], [83], and [84] to cite but a few, projections of precipitation changes for the twenty-first century are very uncertain in those regions, with equal numbers of models predicting a significantly wetter or drier future, or no significant change with respect to present conditions at all. For South-Central America, we have excluded mainly the region comprising the Atacama Desert.
4 Results and Discussion
First, we assess the ability of the WASP-index to detect the spatial distribution of drought events and their magnitude in South-Central America. In the sequence, we evaluate the representation of drought in the climate models by comparing the hazard computed from single models and their ensemble with observation-based data to determine whether the models are capable of reproducing contemporary drought occurrence at the global level. Finally, we look into the identification and quantification of changes in drought hazard (dH) in the near future and future for South-Central America.
4.1 Identifying and characterizing the major Amazonian droughts in the last decade with the WASP-index
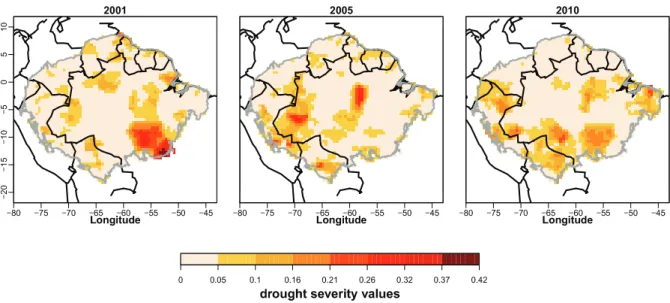
In Fig. 4.1, we present the maximum meteorological drought severity computed with the WASP-index from the GPCCv4-WATCH forcing data for the Amazon rainforest in the years of 2001, 2005 and 2010. We are interested in whether the drought severity conditions, as represented by accumulated monthly WASP-index values, are good indicators of drought events and how this compares with other measures of drought magnitude. These droughts were chosen because of their documented socioeconomic impacts and the large number of studies carried out to identify their origins and characterize their dynamics (e.g. [7, 8, 9, 10, 11, 12, 13]). If historical drought events are well characterized by the WASP-index, then it can be used as a proxy indicator for computing drought hazard in contemporary and future climates.
!" ! #" # "" " $" % & ' % ( ) % ( ' % ) ' ) ( ' * + + , -. /0 1234 5 67 8 9 8: ;< !" ! #" # "" " $" * ++ = -. /0 1234 5 !" ! #" # "" " $" * + ,+ -. /0 1234 5 > " >? >?# >@? >@# >A@ >A! >$@ B CD E F G H I J K J CLHM K N OE J I
Figure 4.1: Geographic distribution of maximum annual drought severity (as measured by accumulated
monthly WASP-index values) in the Amazon basin for 2001, 2005 and 2010.
Following [10] and [11], Amazon is limited to the region identified as forest from the vegetation map of South America by [85]. In 2001, extreme precipitation deficits above 400mm month−1
were registered for south-eastern Amazon basin [86]. A combination of increased energy demand and meteorological drought conditions, reduced the capacity to produce hydroelectric power and caused a virtual breakdown in hydroelectricity generation in most of Brazil, which forced the Brazilian govern to impose energy saving measures to avoid total loss of power and contributed to a gross domestic product (GDP) reduction of 1.5% [17]. [86] used absolute precipitation deficits’ values in mm to study the monthly variation of the geographic distribution and magnitude of this drought event that seriously dashed the region between January and May 2001. The geographic pattern of maximum drought severity computed with WASP-index for 2001 (Fig. 4.1) matches the epicenter of maximum absolute monthly precipitation anomalies in the southeastern
part of the basin as depicted by [86] for that period. This spatial match is indicative of a good agreement between meteorological drought severity computed with the accumulated values of monthly WASP-index and local climate conditions. Moreover, we found that this meteorological drought was spatially the most extensive and severe striking the Amazon region in the last 100 years (data not shown).
Absolute precipitation anomalies’ maps (in mm) presented by [8] indicate that most of Amazon basin experienced precipitation deficiency during 2005. Between January and April 2005, precipitation anomalies were strongly negative in the central part of the basin [8]. During that period, very low-than-normal monthly precipitation supplies occurred in most of the Madeira river basin (center region of the Amazon rainforest at ≈lon=57.5W; lat=3.5S) [13], in good agreement with the stronger drought severity estimated with the WASP-index for 2005 (Fig. 4.1). Starting from April, strong precipitation deficits extended to the south-western two-thirds of the Amazon basin and lessen the discharges of major tributaries of the Amazon river during the dry season (from June to October) [7, 8, 9, 10, 11, 12, 13]. Maps of absolute precipitation anomalies (mm) and maximum cumulative water deficit (MCWD), presented respectively by [8] and [11], confirm the widespread “meteorological-induced” water stress conditions throughout most of south-western basin. The MCWD is an absolute measure of drought severity that relates to specific hydro-ecological impacts in eastern and south-western Amazon evergreen rainforests [87, 88]. It measures the accumulated precipitation shortages over consecutive months below a fixed precipitation threshold value of 100mm month−1 [7, 12, 11]. The hot-spots of absolute precipitation anomalies and MCWD match the geographic pattern of yearly maximum drought severity computed with the WASP-index for 2005 (Fig. 4.1) and also confirm the effectiveness of the results attained with our index for this humid region.
The drought of 2010 was geographically more extensive than the drought of 2005 [89]. It had three identifiable epicenters in south-western Amazon basin, north-central Bolivia, and Brazil’s Mato Grosso state [11]. Consistently, there is a good agreement between the spatial pattern of yearly maximum drought severity computed with the WASP-index for 2010 (Fig. 4.1) and the hot-spots of MCWD presented by [11]. Not surprisingly, for the same year we identified more areas of comparable drought severity in the north-western region of Mara˜n´on and Putumayo tributaries of Amazon river, which were not depicted in the maps presented by [11]. The reason is that the MCWD only identifies the severity of meteorological droughts in specific geographic regions where monthly precipitation conditions are below 100mm. Since the WASP-index is based on threshold levels of drought onset that feedback on local climate variability [1], it is able to depict the severity patterns of drought at locations with distinct precipitation regimes, including specifically those that are not depicted by the MCWD for north-western Amazon river basin.
4.2 Global analysis of contemporary drought hazard from observations and climate models
In Figure 4.2, we present the global maps of drought hazard for contemporary climate (i.e. 1971–2000), as computed with the monthly precipitation totals from GPCCv4-WATCH forcing data and the ensemble mean of drought hazard from single CMIP5 models (CMIP5-EMean). Looking at Figure 4.2(a), it is noticeable a match between the geographic distribution of the observed global drought hazard, as computed with the WASP-index, and the wide range of global dry regions, as depicted by the global map of aridity computed by [78]. Our experiments are consistent with previous results presented by [90], [3], [91], and [92]: drought hazard is generally high for semiarid areas, such as Northeastern and Southern South America, Northern, Southwestern and Horn of Africa, Central Asia, Australia, West U.S. and the Iberian Peninsula; and low for tropical regions, such as the Amazon, Central Africa and Southern Asia. Let us also look in detail at the link between observed drought hazard mapped with the WASP-index and the drought hazard pattern at the regional scale for South-Center America. In 1936, the Semi-Arid
Region of Northeast Brazil (SARNB) was officially recognized by the federal government as having a common recurrence of drought episodes and it was delimited under the name of Drought Polygon to augment the governmental support to the resident populations living there [93, 94]. The results shown in Figure 4.2(a) confirm that the geographic distribution of drought hazard computed with the WASP-index for Northeast Brazil is overall consistent with the geometric shape of the official Drought Polygon [94]. These results seem to emphasize the validity of the WASP-index at estimating drought hazard and lend additional support to its use over the globe, for multiple geographic scales and different precipitation regimes. Moreover, it supports the use of the GPCCv4-WATCH forcing data for evaluating the consistency of the drought hazard simulations in contemporary climate.
P Q R P S R R S R Q R T R U R VW X Y Z [ \ ]^ \ _ ` a b b c d e f b g g W h W ]_ Vi j k i c l m m m X no p q pr st P Q R P S R R S R Q R T R U R VZ X g u[ vw ]ux W y b z {a | c } z \ W ~ g W h W ]_ Vi j k i c l m m m X no p q pr st P Q R P S R R S R Q R T R U R Vx X e Z [ w y v\ \ ]x \ ~ v _ \ ^ uW vuw ~ Z \ v \ \ ~ Y Z [ \ ]^ \ _ W ~ _ g u[ vw ]ux W y g W h W ]_ no p q pr st
Figure 4.2: Global maps of drought hazard for the period 1971-2000: a) computed with monthly
pre-cipitation totals from GPCCv4-WATCH forcing data; b) computed with CMIP5-EMean; c) absolute percentage change between maps (a) and (b). The Semi-Arid Region of Northeast Brazil (SARNB) is delimited in black.
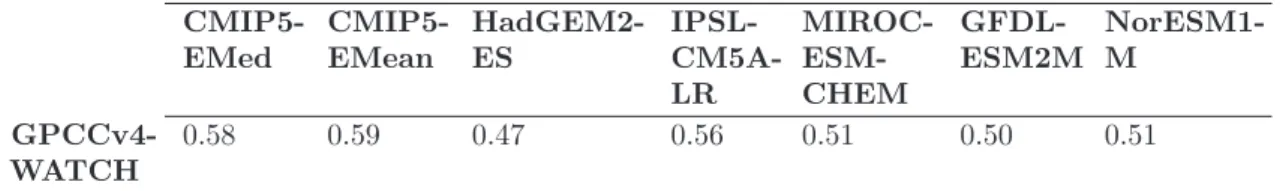
In Table 4.1, we present the Pearson product-moment correlation coefficient,r, between the hazard computed with the GPCCv4-WATCH forcing data and the models for contemporary climate, i.e. 1971–2000.
Table 4.1: Pearson product-moment correlation coefficient (r) between the drought hazard computed with
monthly precipitation totals from GPCCv4-WATCH forcing data for the period 1971–2000 and the drought hazard computed with monthly precipitation totals from CMIP5 models (ensemble median and mean, and individual models) for the same time period.
CMIP5-EMed CMIP5-EMean HadGEM2-ES IPSL- CM5A-LR MIROC- ESM-CHEM GFDL-ESM2M NorESM1-M GPCCv4-WATCH 0.58 0.59 0.47 0.56 0.51 0.50 0.51
The results presented in Table 4.1, suggest that the ensemble mean drought hazard (CMIP5-EMean) outperforms the respective median (CMIP5-EMed), as well as the hazard computed with individual simulations. These results confirm and strengthen the outcomes of previous studies, namely [64, 65, 20], to cite but a few, in that the mean of individual simulations correlates better to the climate variable being projected into the future. As the mean can filter uncertainty from inter-model variability, it is generally the best representation of the response to imposed anthropogenic forcing, and it is better at predictions than any individual member [63, 64, 65, 20]. Indeed, most of the observed global patterns of drought hazard computed with the GPCCv4-WATCH forcing data are consistently simulated by the ensemble mean drought hazard (CMIP5-EMean) computed from the set of individual CMIP5 models (Figure 4.2(b)). The geographic distribution of hazard magnitude is matching for most of north America, Europe and the Mediterranean region, south Australia, central Africa, south and east Asia, and southwest of South America.
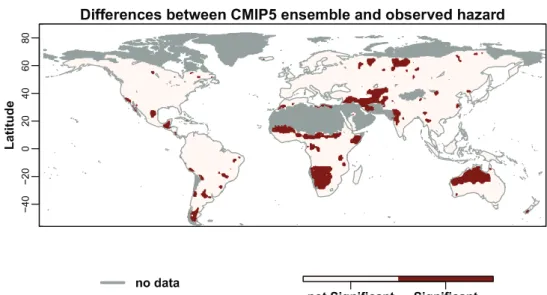
Notwithstanding the ensemble mean drought hazard (CMIP5-EMean) shows the best global correlation with the observed drought hazard computed with the GPCCv4-WATCH forcing data, it is also very important to evaluate the consistency of the ensemble, i.e. if the observed drought hazard behaves like a random draw from the probability distribution describing the ensemble of climate models [67]. In Figure 4.3, we present the geographic distribution of the test statistic values assessing the ensemble consistency, as defined in Equation 3.4. Overall, the results suggest that the ensemble mean drought hazard (CMIP5-EMean) is less consistent with the observed drought hazard for those regions placed in the subtropical subsidence zones around 10o and 30o N/S, such as Central America, South Brazil, Bolivia and Paraguay. It is noticeable a match between the geographic distribution of statistical disagreements among observed and simulated drought hazard, and the arid regions with highly marked precipitation seasonality, as measured by the relative entropy indicator proposed by [59]. They found that the models participating to the CMIP5 project, consistently overestimate the distribution of monthly precipitation throughout the year in arid and semiarid regions with intermittent precipitation regimes due to, in most cases, an excess of rainfall during the premonsoonal months (e.g. Central American region). Since GCMs are not able to simulate the right monthly fractions of rainfall along the year for the so-called monsoon regions [95], then the simulated WASP-index values are biased there and the respective drought hazard inconsistent with that estimated from the observation-based data.
©ª « ¬ « ®¯ ° ± ² ³ ´³ ° ± ´ µ ¶· ° ¶¸ ¶¹ ³ ° ´ µ ¶· ° ¶¸ ¶¹ ³ ° ´
Figure 4.3: Geographic agreement between the ensemble mean drought hazard (CMIP5-EMean) and the
drought hazard computed from the GPCCv4-WATCH forcing data.
The Pearson product-moment correlation coefficient,r, between observed and ensemble mean drought hazard increases from 0.59 to 0.75 after removing the inconsistent grid points of intermittent precipitation regimes located in the subtropical subsidence zones from the analysis (dark red regions dressing the Figure 4.3). On account of the fact that [54] performed a correlation analysis of contemporary drought conditions (as measured by the SPI-12) from three observation-based datasets and ther values averaged at 0.8, then we can conclude that the ensemble mean drought hazard simulated with the WASP-index for the consistent areas correlates extremely well and is coherent with that estimated from the GPCCv4-WATCH forcing data.
4.3 Future Changes in Global Drought Hazard
Figure 4.4 shows near future (2021-2050, left) and future (2071–2099, right) percentage changes of drought hazard (dH), as measured by means of the CMIP5-EMean. The period 1971-2000 (contemporary climate) is used as the reference (N) to measure future percentage changes of dH.
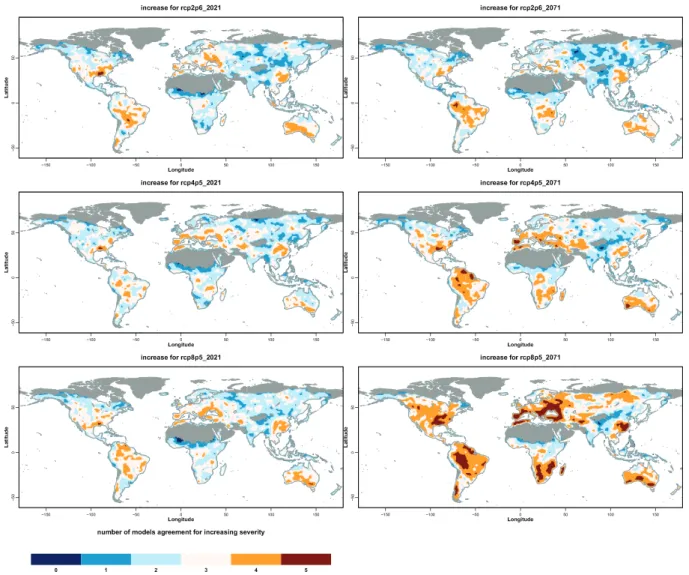
The robustness and significance of percentage changes between present and future periods for dH are evaluated by means of two statistical tests: an agreement of individual simulations in terms of the direction of the changes (Figure 4.5), and a Mann-Whitney-Wilcoxon test (Figure 4.6, see subsection 3.3). In Figure 4.5, regions where dH changes are robust according to the first test are colored in orange and dark red, whereas regions that show significant changes at the chosen 95% confidence level are colored in dark red in Figure 4.6. Non-robust and non-significant regions are masked out in beige and blue, whereas cold and hyper-arid areas are masked out in grey (Figures 4.5 and 4.6). The changes are calculated for three Representative Concentration Pathways (RCPs): 2.6, 4.5 and 8.5, respectively at the top, middle and bottom of Figure 4.4, 4.5 and 4.6.
In general, drought hazard increases globally between the twentieth century and both future time periods (Figure 4.4). More interestingly though, is the fact that the geographic distribution of increasing and decreasing dH look very similar for middle and late twenty-first century, as well as for the three RCPs. In the one hand, the extend of positive dH changes is projected to cover nearly all of the continental areas of North and South America, Europe, West and South Africa, East Asia and Australia. The projected positive changes in dH are consistent with CMIP3 analyses in [53] and follow the tendencies of regional precipitation decreases projected with simulations from CMIP5 by [60, 96, 74, 54], to cite but a few. On the other hand, and as similar as for [96] and [54], models agree that dH will decrease in some drought hot spot regions
º»¼½ º»½½ º¼½ ½ ¼½ »½½ »¼½ ¾ ¿ À À ¿ À ÎÏÐÑÒÓÔÕÖ × Ø ÙÚ Ù Û Ü Ý º»¼½ º»½½ º¼½ ½ ¼½ »½½ »¼½ ¾ ¿ À À ¿ À ÎÏÐÑÒÓÔÕÖ × Ø ÙÚ Ù Û Ü Ý º»¼½ º»½½ º¼½ ½ ¼½ »½½ »¼½ ¾ ¿ À À ¿ À ÁÂÃÁÄÅÆÆÆ ÇÈ ÉÊËÞËßÍÅÆÅÁ ÎÏÐÑÒÓÔÕÖ × Ø ÙÚ Ù Û Ü Ý º»¼½ º»½½ º¼½ ½ ¼½ »½½ »¼½ ¾ ¿ À À ¿ À ÁÂÃÁÄÅÆÆÆ ÇÈ ÉÊËÞËßÍÅÆÃÁ ÎÏÐÑÒÓÔÕÖ × Ø ÙÚ Ù Û Ü Ý º»¼½ º»½½ º¼½ ½ ¼½ »½½ »¼½ ¾ ¿ À À ¿ À ÁÂÃÁÄÅÆÆÆ ÇÈ ÉÊËàËßÍÅÆÅÁ ÎÏÐÑÒÓÔÕÖ × Ø ÙÚ Ù Û Ü Ý º»¼½ º»½½ º¼½ ½ ¼½ »½½ »¼½ ¾ ¿ À À ¿ À ÁÂÃÁÄÅÆÆÆ ÇÈ ÉÊËàËßÍÅÆÃÁ ÎÏÐÑÒÓÔÕÖ × Ø ÙÚ Ù Û Ü Ý á Êâãäåæçèä Çâæ é êëÇèé Èìæëæäçæé íëæ é æãä çæîæÉèÇï ðñ ðò ðóôõñ ðóôñ ðóôöñ ó óôöñ óôñ óôõñ ò ñ
Figure 4.4: Percentage change in CMIP5-EMean drought hazard (dH) from the reference period (1971–
2000) to the near future (2021–2050, left) and future (2071–99, right).
of the last decades, such as Central Asia, South and Southeast Asian monsoon regions, and East Africa.
4.3.1 Projections in South-Central America for the period 2021-2050
Let us now look int detail at the magnitude, robustness and significance of dH changes at the near-future for South-Central America. Although decision makers are usually more interested in the 10–30–yr time horizon [97], we did not find substantial differences between the magnitude of dH changes for the three RCPs in the middle of the century: with a few exceptions, dH is varying spatially by at most±25% (Figure 4.4, left), and the geographic consensus (more than 80%) of the projected dH among the five models is restricted to a few and sparse areas in central of South-Central America (Figure 4.5, left). Drying scenarios are about as likely as reduced drought conditions in most regions and, not surprisingly, statistical significant changes, as defined by the Mann-Whitney-Wilcoxon test (see subsection 3.3), are difficult to pinpoint for the region (Figure 4.6, left). Arguably, mild changes in dH should not be mistaken for low drought risk in the near future, since projections for most countries are neither significant nor consensual, and still include the possibility of increasing magnitude, even in the cases where the average projections point towards wetter conditions.
º»¼½ º»½½ º¼½ ½ ¼½ »½½ »¼½ ¾ ¿ À À ¿ À ÎÏÐÑÒÓÔÕÖ × Ø ÙÚ Ù Û Ü Ý º»¼½ º»½½ º¼½ ½ ¼½ »½½ »¼½ ¾ ¿ À À ¿ À ÎÏÐÑÒÓÔÕÖ × Ø ÙÚ Ù Û Ü Ý º»¼½ º»½½ º¼½ ½ ¼½ »½½ »¼½ ¾ ¿ À À ¿ À èäÊÉæãçæ÷ÈÉÉÊËÞËßÍÅÆÅÁ ÎÏÐÑÒÓÔÕÖ × Ø ÙÚ Ù Û Ü Ý º»¼½ º»½½ º¼½ ½ ¼½ »½½ »¼½ ¾ ¿ À À ¿ À èäÊÉæãçæ÷ÈÉÉÊËÞËßÍÅÆÃÁ ÎÏÐÑÒÓÔÕÖ × Ø ÙÚ Ù Û Ü Ý º»¼½ º»½½ º¼½ ½ ¼½ »½½ »¼½ ¾ ¿ À À ¿ À èäÊÉæãçæ÷ÈÉÉÊËàËßÍÅÆÅÁ ÎÏÐÑÒÓÔÕÖ × Ø ÙÚ Ù Û Ü Ý º»¼½ º»½½ º¼½ ½ ¼½ »½½ »¼½ ¾ ¿ À À ¿ À èäÊÉæãçæ÷ÈÉÉÊËàËßÍÅÆÃÁ ÎÏÐÑÒÓÔÕÖ × Ø ÙÚ Ù Û Ü Ý äêéíæÉÈ÷é Èìæëç ãåÉææéæäÇ÷ÈÉèäÊÉæãçèäå çæîæÉèÇï ó ò ö ø ù ñ
Figure 4.5: Model agreement in the direction of mean severity change (4 out of 5 indicates at least 80%
agree with positive change; 2 out of 5 indicates at least 80% with negative change).
are not missing part of the phenomenon, but highlight the inherent ambiguity in decadal dH predictions from a forced climate change signal that is weaker than the magnitude of internally generated climate variations, as pointed out by [98]. Indeed, dH changes are not significant and the spatial patterns are similar for the three different concentration pathways in the period 2021-2050, because the climate system response is comparable over the next few decades no matter which RCP is followed [99]. This situation becomes more evident for indicators based on precipitation only (than for, e.g. temperature), where even contemporary large-scale forced changes are only marginally separable from internal climate [100, 72]. Indeed, previous studies (e.g. [53], [3], [54], and [55], to cite but a few) have shown that increases in drought impacts during the recent past were not driven by decreased precipitation only, but also by increased evapotranspiration, highlighting that trends in precipitation emerge slowly and their effects on extreme climate events, such as drought, only establish in the longer-term.
4.3.2 Projections in South-Central America for the period 2071-2099
At the end of the century, the magnitude of dH remarkably increases under RCPs 4.5 and 8.5, as compared to the respective values for the period 2021–2050, and increases at almost all regions from RCP2.6 to RCP8.5 (from top to bottom of Figure 4.4, right). For example, the estimated magnitude of dH changes for northern of South America is positive and around 25% under
º»¼½ º»½½ º¼½ ½ ¼½ »½½ »¼½ ¾ ¿ À À ¿ À ÎÏÐÑÒÓÔÕÖ × Ø ÙÚ Ù Û Ü Ý º»¼½ º»½½ º¼½ ½ ¼½ »½½ »¼½ ¾ ¿ À À ¿ À ÎÏÐÑÒÓÔÕÖ × Ø ÙÚ Ù Û Ü Ý º»¼½ º»½½ º¼½ ½ ¼½ »½½ »¼½ ¾ ¿ À À ¿ À ËÄîãëêæÉÊËÞËßÍÅÆÅÁ ÎÏÐÑÒÓÔÕÖ × Ø ÙÚ Ù Û Ü Ý º»¼½ º»½½ º¼½ ½ ¼½ »½½ »¼½ ¾ ¿ À À ¿ À ËÄîãëêæÉÊËÞËßÍÅÆÃÁ ÎÏÐÑÒÓÔÕÖ × Ø ÙÚ Ù Û Ü Ý º»¼½ º»½½ º¼½ ½ ¼½ »½½ »¼½ ¾ ¿ À À ¿ À ËÄîãëêæÉÊËàËßÍÅÆÅÁ ÎÏÐÑÒÓÔÕÖ × Ø ÙÚ Ù Û Ü Ý º»¼½ º»½½ º¼½ ½ ¼½ »½½ »¼½ ¾ ¿ À À ¿ À ËÄîãëêæÉÊËàËßÍÅÆÃÁ ÎÏÐÑÒÓÔÕÖ × Ø ÙÚ Ù Û Ü Ý ËÄîãëêæ÷ÈÉá Êâãäåæç èä Çâæ é êëÇèé Èìæëæäçæé íëæé æãä çæîæÉèÇï ó óôóñ óôò ò
Figure 4.6: p-value for CMIP5-EM percentage changes in severity as computed with the
Mann-Whitney-Wilcoxon test.
RCP2.6, increases by 50% under RCP4.5 and grows by more than 75% under RCP8.5. These results are in line with [98] and further support the idea that only in the second half of the twenty-first century does the climatological response of precipitation depend significantly on which concentration pathway is followed. Indeed, under RCP2.6, the magnitude of changes is similar to the values registered for the period 2021–2050 at almost all regions, and the spatial patterns of robustness and significance also maintain alike (top of Figures 4.5 and 4.6). This result was somewhat expected, as the radiative forcing for this RCP reaches its maximum around the middle of the twenty-first century and the occurrence of climate extremes beyond that time should not be significantly aggravated [41].
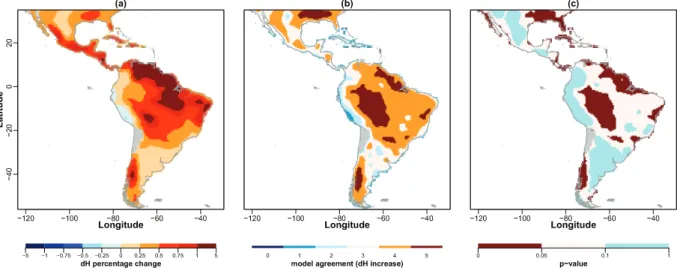
On the other hand, significant signals of dH changes emerge in a few regions by the end of the century, as averaged over all models under RCPs 4.5 and 8.5 (middle and bottom of Figure 4.4, right). The analysis of Figure 4.7, reveals that dH increases will be robust and significant over the entire Amazon region by the end of the century, thus reconfirming results from CMIP3 drought analysis in [53], and corroborating the CMIP5 experiments under RCP8.5 in [60], [54] and [96], to cite but a few. Several studies agree that the approximate causes are twofold (e.g. [7, 8]): increasing Pacific Sea surface temperatures (SSTs), which intensify El Ni˜no Southern Oscillation and the associated periodic Amazon droughts, and an increase of the Atlantic SST that displaces the inter-tropical convergence zone towards northwest and increases the frequency of historically random droughts. As the Amazon basin is less disturbed by antropogenic actions in comparison
to the world’s large river basins [13], the series of extreme droughts in recent years provides a unique opportunity to improve our understanding on how pristine environments might function during dH increases by the end of the century. Indeed, although the Amazon rainforest has adapted to seasonal and short-term dry spells by strategies such as water uptake by deep roots, the severe drought events of 2005 and 2010 (see subsection 4.1) had profound environmental and socioeconomic impacts, and highlighted the sensitivity of its hydrology and ecosystem to prolonged drought conditions [9, 11]. For example, [101] and [102] have reported that long-term drought-induced water stress on intact forests suppresses tree growth, increases tree mortality, and generates leaf litter drying due to increasing canopy openness and understory insolation. [10] evaluated net biomass changes, growth, and mortality of old rainforest during the drought event of 2005, and confirmed that the affected areas lost biomass and reversed a large long-term carbon sink. Consequently, the extremely extended dry seasons in 2005 and 2010, associated with intense natural forest degradation, human induced deforestation and logging, broke out severe wildfires and affected the natural sustainability of the rainforest [8, 89]. As rivers and lakes had the lowest water levels in years, the drought events also provoked large impacts on transportation, fishery, agriculture, generation of hydroelectricity, and affected the health of human populations in the region [7, 8, 9, 89]. Therefore, the increase of periodic and random severe drought events by the end of the century might dry the rainforest ecosystem, impact on human activities and change the whole global carbon cycle [103, 104, 10, 11]. Since the Amazon rainforest process more than twice the rate of anthropogenic fossil fuel emissions [10], than future dH might substantially affect the concentration of atmospheric CO2 and exert a higher feedback
on climate change. ú ûüý ú ûýý úþý úÿý ú ý ú ûüý ú ûýý úþý úÿý ú ý úûüý ú ûýý úþý úÿý ú ý !"# $" #
%& %' %() *& %() & %() +& ( () +& () & ()*& ' & , ."# , !/ 0 "12 ( ' + 3 4 & 56".7 ( () (& ()' '
Figure 4.7: (a) Percentage change under RCP8.5 in CMIP5-EMean drought hazard (dH) between the
ref-erence period (1971–2000) and future (2071–2099) for South-Central America. (b) Robustness and (c) significance of dH changes.
Turning now to the analysis of drought hazard changes for southern of South America, our results suggest that positive trends are neither robust nor significant (Figure 4.7(b) and (c)). Moreover, we have found some differences to the results computed by [105] on both short- and long-term severe drought frequency computed with the SPI3 and SPI12 from a multi-model ensemble of CMIP5 precipitation simulations. [105] found changes in drought frequencies that in average start around the 30% and can go above 100% for SPI12, whereas the drought hazard computed with the WASP-index is always inferior to 25% in the region. This discrepancy may be related to several factors, including different hydrological indices, different control periods and different ways of defining the thresholds of drought onset. Indeed, as the SPI defines the drought onset on a fix probability value for all regions, it might underestimate the frequency of events under contemporary climate for some regions and overestimate the percentage changes for
the future. Taking these factors into account, our results do not contradict the patterns from [105], but highlight the inherent difficulty and ambiguity in quantifying such trends.
Regarding the region of northeast Brazil, our results suggest that drought hazard increases are robust, but will not be significant as those for the Amazon region (Figure 4.7(c)). Although positive trends are projected for the whole region (Figure 4.7(a)), in agreement with projected dry spell length increases by [19], their magnitude is below the positive changes estimated for the rainforest region. In line with previous studies, e.g. [61], the CMIP5 multi-model ensembles show a large bias for excessive precipitation over northeastern Brazil, thus mitigating the positive impacts of climate change on drought hazard trends for that region.
Changes in CMIP5-EMean indicate increase hazard in many CADC countries, Caribbean islands, the Yucatan, and in southwestern Mexico adjacent to the east Pacific warm pool (Figure 4.7(a)). The agreement on reduced precipitation for the Caribbean and Mexico is also high for other ensembles of CMIP5 models (e.g. [106]) and is reinforced in this study with the regional intermodel agreement on drought hazard changes. [106] have shown that CMIP5 models agree on a drier early summer (June and July) and wetter fall (September and October) from the north Intertropical Convergence Zone to the north American region, accompanied by robust strengthening of the midsummer drought in Central America and the greater Caribbean region. As for most of Central America and southern Mexico, climatological precipitation has a maximum in June and September [106], then the strengthening of midsummer droughts for the region in the future will increase as well drought hazard as measured by the WASP-index.
5 Conclusions
This technical report presents an assessment of large-scale and long-term statistics of drought haz-ard as characterized by the likelihood of persistent monthly precipitation deficits in contemporary and future climates. In particular, we have estimated historical drought hazard and its future changes from independent drought events computed by means of the WASP-index. We followed a rigorous analysis to determine where local assessments should be carried out to improve future adaptation plans and mitigation activities, and strengthen regional drought risk management policies. This study is part of the activities developed in the framework of Component 3 of the second phase of the Programme EUROCLIMA: “Sustainable Agriculture, Food Security and Climate Change in Latin America: Strengthening the capacities of key stakeholders to adapt agriculture to climate change and mitigate its effects”. Therefore, we decided to conduct our analysis from a global to a continental perspective (in order to place South-Central America in the globe), and finally to look at the national and sub-national scales of drought hazard changes for the middle and end of the century in South-Central America.
First, we have used the WASP-index to characterize the magnitude and spatial pattern of major drought events for the Amazon region in 2001, 2005 and 2010. Results indicate that the index is able to reproduce the distribution of droughts’ severity, as mapped by earlier indices, such as the maximum cumulative water deficit (MCWD) that relates drought to specific hydro-ecological impacts of absolute local precipitation deficits. The WASP-index is an easy tractable and robust measure of drought severity that adapts to different precipitation regimes. Moreover, because it is standardized, it is also able to identify regional drought hot-spots that cannot be depicted by absolute indices of drought developed for specific applications and/or regions. Overall, the presented results indicate that severity indices of absolute anomalies are useful for particular applications concerning local management activities, but they do not allow to compare the severity of drought events in space and/or time. Results emphasize the strength of the WASP-index and reveal the necessity of standardized measures for a comprehensive analysis of drought occurrence, its frequency and possible impacts in time and space.
In the sequence, we have analyzed high-resolution monthly precipitation data provided by the ISI-MIP project for three RCPs from five models participating to the CMIP5 project. With a few exceptions, climate models show increasing global drought hazard between contemporary and both future time periods under all RCPs. On the one hand, the extend of positive dH changes is projected to cover nearly all of the continental areas of North and South America, Europe, West and South Africa, East Asia and Australia. On the other hand, models agree that dH will decrease in some drought hot spot regions of the last decades, such as Central Asia, South and Southeast Asian monsoon regions, and East Africa.
Although the predicted future changes in drought hazard are monotonically increasing and robust across many regions for all RCPs and both future time periods, they are generally not statistically significant. Significance of changes is dependent on many factors, including the magnitude of the change, and the chosen level of significance in the statistical testing used in detecting the impacts of climate change. As this is generally an arbitrary choice, we have used a 95% confidence level that is ubiquitous in the scientific literature – a 90 or 99% confidence level could easily be used with important changes in the results. As regards the magnitude of changes, in contrast to primary climate variables, such as surface air temperature, significance changes in drought hazard are predicted to become detectable only after multiple decades – our results confirm that significant changes in intra-annual precipitation regimes for South-Central America only emerge by the end of the century.
Despite the methodological issues, there are still many uncertainties in drought hazard projec-tions arising from the simulaprojec-tions themselves. Firstly, we have by necessity used only five models to represent the uncertainty across models. The error in doing this is difficult to quantify, but our results for the middle and end of the century in South-Central America are consistent with the results from previous studies for a larger set of models. Secondly, the models themselves
may be biased because of inadequacies in the modeled physical processes, parameterizations, downscaling and because of processes that are not included in the modeling. Such biases can generally be evaluated by comparison with observed conditions and this is critical for confidence to be instilled in future projections.
Evaluation of the models’ ability to replicate contemporary climate variability and the terrestrial water cycle has been addressed. Accurate and reliable diagnosis of consecutive precipitation deficits under contemporary climate is a valid tool for gauging GCMs performance, evaluating their realism and quantifying changes in the hydroclimatic regimes. We have shown that the models do reasonably well in replicating our best estimates of twentieth century drought hazard statistics in South-Central America, yet with a general under-estimation of drought hazard for subtropical subsidence zones with highly marked precipitation seasonality (e.g. CADC). The reasons for the differences between the climate models and the observational GPCCv4-WATCH dataset are unclear at present, but may include model biases in the characteristics of precipitation, especially in the frequency and intensity of individual monthly totals, which impact on the persistence of precipitation anomalies and intensity of dH as computed by the WASP-index. Our experiments are in line with previous results that suggest an overestimation of monthly precipitation totals in arid and semiarid regions by the models participating to the CMIP5 project.
Notwithstanding the uncertainties in future dH changes and some regional inconsistencies between climate models and observations, we can make some final observations regarding the results for South-Central America. The consensus among this set of the latest GCM projections of future climates is that regional drought hazard will increase relative to the contemporary climate, but will not show statistically significant changes for several decades, indicating that the impacts of climate change will not be felt immediately at regional scales. Regional drought hazard is shown to increase under all emission scenarios, including the RCP2.6 that projects an increase of 1.5oC by the end of the twenty-first century relative to the present day. The implication is that drought hazard will increase, despite future emission reductions, which in turn will increase the time to stabilize atmospheric concentrations of greenhouse gases. Indeed, under higher RCPs (4.5 and 8.5), the magnitude of the drought hazard changes are expected to be even higher and impact very important natural ecosystems (such has the Amazon), thus exerting higher feedback in the whole carbon cycle. Taken together, our findings point towards the idea that the challenge of drought risk management for South-Central America is not only to establish organizational frameworks and operational arrangements that prepare local populations to drought hazard and its changes, but to progress on regional initiatives that prevent drought impacts in important natural ecosystems with high biodiversity and capacity to process anthropogenic fossil fuel emissions.
References
[1] H. Carr˜ao, A. Singleton, G. Naumann, P. Barbosa, J. Vogt, An optimized system for the classification of meteorological drought intensity with applications in frequency analysis, J. Appl. Meteor. Climatol. 53 (2014) 1943–1960.
[2] S. Goddard, S. K. Harms, S. E. Reichenbach, T. Tadesse, W. J. Waltman, Geospatial decision support for drought risk management, Commun. ACM 46 (2003) 35–37.
[3] A. Dai, Drought under global warming: a review, Wiley Interdiscip. Rev. Clim. Change 2 (2011) 45–65.
[4] J. A. Dracup, K. S. Lee, E. G. P. Jr., On the definition of droughts, Water Resour. Res. 16 (1980) 297–302.
[5] D. A. Wilhite, M. H. Glantz, Understanding the drought phenomenon: The role of definitions, Water Int. 10 (1985) 111–120.
[6] A. K. Mishra, V. P. Singh, A review of drought concepts, J. Hydrol. 391 (2009) 202–216. [7] L. E. O. C. Arag˜ao, Y. Malhi, R. M. Roman-Cuesta, S. Saatchi, L. O. Anderson, Y. E.
Shimabukuro, Spatial patterns and fire response of recent amazonian droughts, Geophys. Res. Lett. 34 (2007) 5.
[8] J. A. Marengo, C. A. Nobre, J. Tomasella, M. D. Oyama, G. S. de Oliveira, R. de Oliveira, H. Camargo, L. M. Alves, I. F. Brown, The drought of amazonia in 2005, J. Clim. 21 (2008) 495–516.
[9] N. J.-H. Y. Zeng, J. A. Marengo, A. Subramaniam, C. A. Nobre, A. Mariotti, , J. D. Neelin, Causes and impacts of the 2005 amazon drought, Environ. Res. Lett. 3 (2008) 9.
[10] O. L. Phillips, L. E. O. C. Arago, S. L. Lewis, J. B. Fisher, J. Lloyd, G. Lpez-Gonzlez, Y. Malhi, A. Monteagudo, J. Peacock, C. A. Quesada, G. van der Heijden, S. Almeida, I. Amaral, L. Arroyo, G. Aymard, T. R. Baker, O. Bnki, L. Blanc, D. Bonal, P. Brando, J. Chave, . C. A. de Oliveira, N. D. Cardozo, C. I. Czimczik, T. R. Feldpauschand, M. A. Freitas, E. Gloor, N. Higuchi, E. Jimnez, G. Lloyd, P. Meir, C. Mendoza, A. Morel, D. A. Neill, D. Nepstad, S. Patio, M. C. Peuela, A. Prieto, F. Ramrez, M. Schwarz, J. Silva, M. Silveira, A. S. Thomas, H. Steege, J. Stropp, R. Vsquez, P. Zelazowski, E. A. Dvila, S. Andelman, A. Andrade, K.-J. Chao, T. Erwin, A. D. Fiore, E. H. C., H. Keeling, T. Killeen, W. F. Laurance, A. P. Cruz, N. C. A. Pitman, P. N. Vargas, H. Ramrez-Angulo, A. Rudas, R. Salamo, N. Silva, J. Terborgh, A. Torres-Lezama, Drought sensitivity of the amazon rainforest, Science 323 (2009) 1344–1347.
[11] S. L. Lewis, P. M. Brando, O. L. Phillips, G. M. F. van der Heijden, D. Nepstad, The 2010 amazon drought, Science 331 (2011) 554.
[12] J.-H. Yoon, N. Zeng, An atlantic influence on amazon rainfall, Clim. Dyn. 34 (2010) 249–264.
[13] J. Tomasella, L. S. Borma, J. A. Marengo, D. A. Rodriguez, L. A. Cuartas, C. A. Nobre, M. C. R. Prado, The droughts of 19961997 and 20042005 in amazonia: hydrological response in the river main-stem, Hydrol. Process. 25 (2011) 1228–1242.
[14] FAO, Aquastat database - food and agriculture organization of the united nations (fao), [Available online at http://www.fao.org/nr/water/aquastat/main/index.stm.] (cited 18/11/2014).
[15] K. E. Trenberth, D. Stepaniak, Indices of el Ni˜no evolution, J. Clim. 14 (2011) 1697–1701. [16] S. S. Yadav, R. Redden, J. L. Hatfield, H. Lotze-Campen, A. J. W. Hall, Crop Adaptation
to Climate Change, John Wiley & Sons, 2011.
[17] G. Magrin, C. G. Garc´ıa, D. C. Choque, J. C. Gim´enez, A. R. Moreno, G. J. Nagy, C. Nobre, A. Villamizar, Climate change 2007: Impacts, adaptation and vulnerability, in: M. L. Parry, O. F. Canziani, J. P. Palutikof, P. J. van der Linden, C. E. Hanson (Eds.), Contribution of Working Group II to the Fourth Assessment Report of the Intergovernmental Panel on Climate Change, Cambridge University Press, 2007, pp. 581–615.
[18] M. P. Llano, W. Vargas, G. Naumann, Climate variability in areas of the world with high production of soya beans and corn: its relationship to crop yields, Meteorol. Appl. 19 (4) (2012) 385–396.
[19] J. A. Marengo, R. Jones, L. M. Alves, M. C. Valverde, Future change of temperature and precipitation extremes in south america as derived from the precis regional climate modeling system, Int. J. Climatol. 29 (15) (2009) 2241–2255. doi:10.1002/joc.1863. [20] J. Huang, H. Yu, X. Guan, G. Wang, R. Guo, Accelerated dryland expansion under climate
change, Nature Clim. Change 6 (2015) 166171. doi:10.1038/nclimate2837.
[21] T. C. Sharma, Simulation of the kenyan longest dry and wet spells and the largest rain-sums using a markov model, J. Hydrol. 178 (1996) 55–67.
[22] M. T. Usman, C. J. C. Reason, Dry spell frequencies and their variability over southern africa, Clim. Res. 26 (2004) 199–211.
[23] B. Lyon, M. A. Bell, M. K. Tippett, A. Kumar, M. P. Hoerling, X.-W. Quan, H. Wang, Baseline probabilities for the seasonal prediction of meteorological drought, J. Appl. Meteor. Climatol. 51 (2012) 12221237.
[24] H.-R. Byun, D. A. Wilhite, Objective quantification of drought severity and duration, J. Climate 12 (1999) 27472756.
[25] J. Keyantash, J. A. Dracup, The quantification of drought: An evaluation of drought indices, Bull. Am. Meteorol. Soc. 83 (2002) 1167–1180.
[26] G. Kallis, Droughts, Annu. Rev. Environ. Resour. 33 (1) (2008) 85–118.
[27] V. U. Smakhtin, E. L. F. Schipper, Droughts: The impact of semantics and perceptions, Water Pol. 10 (2008) 131–143.
[28] E. Kampragou, S. Apostolaki, E. Manoli, J. Froebrich, D. Assimacopoulos, Towards the harmonization of water-related policies for managing drought risks across the {EU}, Environ. Sci. Policy 14 (7) (2011) 815 – 824.
[29] B. Lyon, A. G. Barnston, Enso and the spatial extent of interannual precipitation extremes in tropical land areas, J. Climate 18 (2005) 5095–5109.
[30] C. Andrade, M. Belo-Pereira, Assessment of droughts in the iberian peninsula using the wasp-index, Atmos. Sci. Lett. 16 (2015) 208–218.
[31] V. Yevjevich, An objective approach to definitions and investigations of continental hy-drologic droughts, Hydrology Paper 23, Colorado State University, Fort Collins, Colorado (1967).