RESEARCH ARTICLE
Evaluation of pre-processing on the
meta-analysis of DNA methylation data from the
Illumina HumanMethylation450 BeadChip
platform
Claudia SalaID1*, Pietro Di LenaID2, Danielle Fernandes Durso3, Andrea Prodi4, Gastone Castellani5,6, Christine Nardini7,8,9
*
1 Department of Physics and Astronomy, University of Bologna, Bologna, Italy, 2 Department of Computer Science and Engineering, University of Bologna, Bologna, Italy, 3 Division of Infectious Diseases and Immunology, University of Massachusetts Medical School, Worcester, Massachusetts, United States of America, 4 Smart Cities Living Lab, Institute of Organic Synthesis and Photoreactivity, CNR, Bologna, Italy, 5 Department of Experimental, Diagnostic and Specialty Medicine, University of Bologna, Bologna, Italy, 6 Interdepartmental Center “L. Galvani”, University of Bologna, Bologna, Italy, 7 Department of Laboratory Medicine, Karolinska Institutet, Stockholm, Sweden, 8 CNR IAC “Mauro Picone”, Roma, Italy, 9 Sol Group, Monza, Italy
*[email protected](CS);[email protected](CN)
Abstract
Introduction
Meta-analysis is a powerful means for leveraging the hundreds of experiments being run worldwide into more statistically powerful analyses. This is also true for the analysis of omic data, including genome-wide DNA methylation. In particular, thousands of DNA methylation profiles generated using the Illumina 450k are stored in the publicly accessible Gene Expression Omnibus (GEO) repository. Often, however, the intensity values produced by the BeadChip (raw data) are not deposited, therefore only pre-processed values -obtained after computational manipulation- are available. Pre-processing is possibly different among studies and may then affect meta-analysis by introducing non-biological sources of
variability.
Material and methods
To systematically investigate the effect of pre-processing on meta-analysis, we analysed four different collections of DNA methylation samples (datasets), each composed of two subsets, for which raw data from controls (i.e. healthy subjects) and cases (i.e. patients) are available. We pre-processed the data from each dataset with nine among the most common pipelines found in literature. Moreover, we evaluated the performance of regRCPqn, a modi-fication of the RCP algorithm that aims to improve data consistency. For each combination of pre-processing (9×9), we first evaluated the between-sample variability among control subjects and, then, we identified genomic positions that are differentially methylated between cases and controls (differential analysis).
a1111111111 a1111111111 a1111111111 a1111111111 a1111111111 OPEN ACCESS
Citation: Sala C, Di Lena P, Fernandes Durso D, Prodi A, Castellani G, Nardini C (2020) Evaluation of pre-processing on the meta-analysis of DNA methylation data from the Illumina
HumanMethylation450 BeadChip platform. PLoS ONE 15(3): e0229763.https://doi.org/10.1371/ journal.pone.0229763
Editor: Y-h. Taguchi, Chuo University, JAPAN Received: June 25, 2019
Accepted: February 13, 2020 Published: March 10, 2020
Copyright:©2020 Sala et al. This is an open access article distributed under the terms of the Creative Commons Attribution License, which permits unrestricted use, distribution, and reproduction in any medium, provided the original author and source are credited.
Data Availability Statement: All data used in this study are available from the GEO database (accession numbers GSE87648, GSE111629, GSE65163, GSE109446, GSE80261, GSE109042). Funding: CS is funded by European Union’s Horizon 2020 research and innovation programme (H2020-MSCA-ITN grant agreement 721815 “IMforFUTURE”,https://imforfuture.eu/). The funder had no role in study design, data collection and analysis, decision to publish, or preparation of work included in this submission. The specific role
Results and conclusion
The pre-processing of DNA methylation data affects both the between-sample variability and the loci identified as differentially methylated, and the effects of pre-processing are strongly dataset-dependent. By contrast, application of our renormalization algorithm regRCPqn: (i) reduces variability and (ii) increases agreement between meta-analysed datasets, both critical components of data harmonization.
Introduction
The public availability of thousands of human DNA methylation datasets offers the possibility to gain appropriate statistical power to test hypotheses relevant to the mechanisms involved with methylation, to reveal and validate its role in health and disease and to identify stable epi-genetic signatures, via meta-analysis. However, together with the opening of great opportuni-ties, meta-analysis also brings critical challenges associated to data harmonization. This is particularly true for DNA methylation, where data are often available only in pre-processed rather than raw forms and where numerous pre-processing pipelines exist.
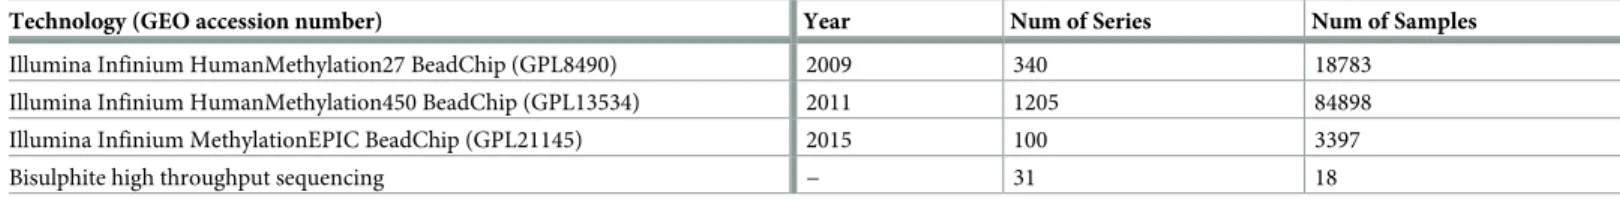
The popular international public repository Gene Expression Omnibus (GEO, [1]) contains over 100000 human DNA methylation samples, mostly measured using the Illumina Infinium HumanMethylation450 BeadChip [2] technology (GEO accession number GPL13534) (see Table 1).
The Illumina 450K BeadChip contains 485577 probes targeting 99% of RefSeq genes, besides several other locations on the genome [2]. Overall, the 450k probes target both CpG sites that are isolated on the genome (i.e. CpG OpenSeas) and CpG sites that reside in regions of variable density (CpG Islands, Shelves or Shores), targeting 96% of the CpG Island regions. Unlike the previous Illumina Infinium HumanMethylation27 BeadChip, this array incorpo-rates two different chemical assays: Infinium I, that includes 135501 probes, and Infinium II, that includes 350076 probes. Each CpG site of Infinium I is targeted by two probes that respec-tively detectmethylated(M) andunmethylated(U) signal intensities, while each CpG site of Infinium II is targeted by a single probe with 2 different dye colors (green and red) that distin-guishMandUsignal intensities.
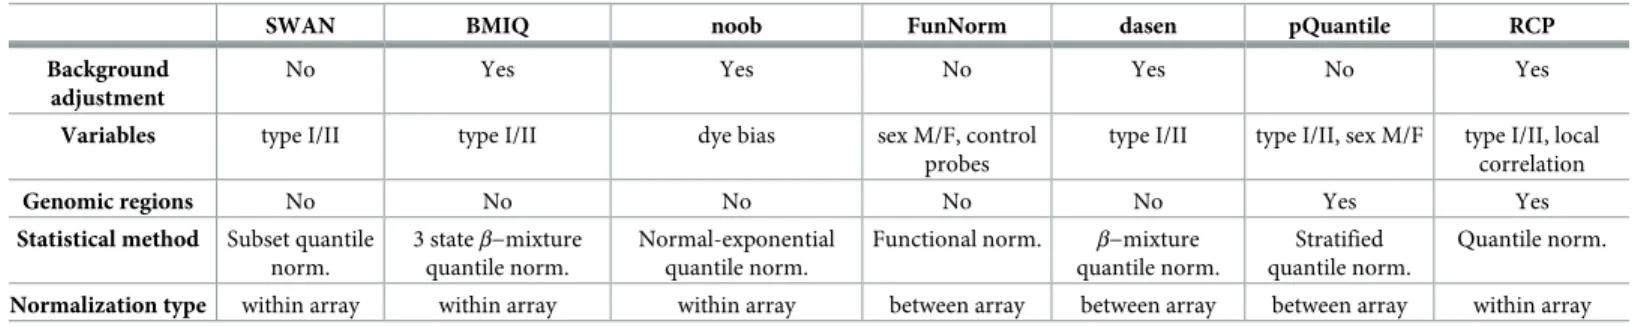
The pre-processing pipeline designed to obtain methylation profiles from raw experimental data (.idat files) in the form ofβ-values (β=M/(M+U+α), where typicallyα= 100 [3]) is not standardized, even within the same technological platform, as illustrated inTable 2. Indeed, different pre-processing methods make different assumptions on the data regarding their dis-tribution, their correlation structure and the extent (localized or global) of the DNA methyla-tion variability on the genome [4], since this is still a matter of debate [5].
Table 1. Summary of human DNA methylation data available on GEO listed by sequencing technology on 01/03/2019.
Technology (GEO accession number) Year Num of Series Num of Samples
Illumina Infinium HumanMethylation27 BeadChip (GPL8490) 2009 340 18783
Illumina Infinium HumanMethylation450 BeadChip (GPL13534) 2011 1205 84898
Illumina Infinium MethylationEPIC BeadChip (GPL21145) 2015 100 3397
Bisulphite high throughput sequencing − 31 18
https://doi.org/10.1371/journal.pone.0229763.t001 of this author is articulated in the ‘author contributions’ section.
Competing interests: The authors have read the journal’s policy and the authors of this manuscript have the following competing interests: CN is a part-time employee of SOL Group and part-time associate to CNR-IAC. This does not alter our adherence to PLOS ONE policies on sharing data and materials. There are no patents, products in development or marketed products to declare.
Notice that the pre-processing transformations of the data aim at reducing the experimental variability but may also affect the biological variation of the samples. The magnitude of such undesired effect depends on the pre-processing method that was applied and remains a critical and ambiguous point in DNA methylation data analysis that will not be addressed here.
Besides the peculiarities of each pre-processing method, it is possible to identify a number of common computational manipulations applied to the raw data. These include probe type and colour bias adjustment, background signal subtraction and average normalization to reduce the effects of experimental variation early in the pipeline; and intra- and inter-sample normalization as well as batch effect correction, that are usually taken into consideration fur-ther down in the pipeline [6,7].
When analysing a single dataset, the choice of the pre-processing pipeline must be done carefully to maximize the statistical power of the analysis and the robustness of the results [8]. In meta-analysis two further critical issues arise: dataset and sample selection, and also data harmonization. Meta-analysis can be performed in different ways: some approaches first ana-lyse separately individual datasets and then combine the results into a final estimate; others first pool data from all the datasets and then analyse the pooled data using a single model. The first class of approaches includesAggregated Data(AD) andtwo-step Individual Participant Data(IPD) meta-analyses [9]. The main advantage of these approaches is the relatively low complexity of their implementation. The main drawback is the need for raw data. The second class of approaches is referred to asone-step IPDmeta-analysis. Althoughone-step IPD
approaches are expected to behave similarly to thetwo-steps IPDones [9], they allow additional flexibility (e.g. no need to start from raw data) and, for example, give the possibility to compare different models and investigate interactions [9]. An important assumption of theone-step IPDmeta-analyses is the comparability of the variables measured in different datasets [10], and this is why data harmonization is crucial to guarantee that methylation samples of the same type (same tissue, health state, age, sex, etc.) from different datasets can be compared.
Knowing that less than half of the Illumina BeadArrays datasets in GEO include raw data (521 over 1205 studies considering the Illumina 450K BeadChip) we here propose aone-step IPDapproach to systematically assess the effects of different pre-processing methods on meta-analysis.
Finally, we introduceregRCPqn(regional Regression on Correlated Probes with quantile normalization), as a possible solution (and currently the only one, to the best of our knowl-edge) to reducea posteriorithe variability and compensate for the artefacts in theβ-value dis-tribution resulting from different choices of pre-processing protocols. Enhancing existing Table 2. Summary of the pre-processing methods considered in the study.
SWAN BMIQ noob FunNorm dasen pQuantile RCP Background
adjustment
No Yes Yes No Yes No Yes
Variables type I/II type I/II dye bias sex M/F, control probes
type I/II type I/II, sex M/F type I/II, local correlation
Genomic regions No No No No No Yes Yes
Statistical method Subset quantile norm.
3 stateβ−mixture quantile norm.
Normal-exponential quantile norm.
Functional norm. β−mixture quantile norm.
Stratified quantile norm.
Quantile norm.
Normalization type within array within array within array between array between array between array within array Pre-processing methods considered in the study, detailed by: background adjustment; variables considered such as probe type, subset of probes, sex or fluorescence color channel; genomic region; underlying statistical approach; normalization type. In addition,NOOB+BMIQand rawβ-values pipelines were obtained applying two of the above in sequence and considering unprocessed values, respectively, for a total of nine pre-processing methods.
methods (RCP[11]),regRCPqnenables meta-analyses even when raw data are not publicly available. To validate our method, we propose differential analysis as a ubiquitous and flexible approach to show the results of our findings.
Materials and methods
To evaluate the effects of pre-processing on the between-sample variability and on the identifi-cation of Differentially Methylated Positions (DMPs) in case-control studies, we analyse four different collections of datasets. The datasets have been selected based on their sample size and on the assumption that there is no global DNA methylation variation among samples (see Introductionand [5]). This assumption is required to apply methods that are based on quantile normalization [4,6]. In the following, we first describe the datasets (SectionMaterials) and the nine pre-processing methods that we tested (SectionPre-processing). We then introduce
regRCPqn(SectionRegional RCP with quantile normalization(regRCPqn)), and finally, we
specify how the datasets are pre-processed (SectionDatasets pre-processing), as well as which model and variables are used for the differential analysis (SectionStatistical Analysis).
Materials
We consider four datasets, each composed of two studies, characterized by features that are progressively challenging from the harmonization point of view: the first one (BloodIBD) is a dataset from a single project and laboratory, where samples are processed at two different dates, mimicking two datasets; the second one (BloodParkinson) artificially breaks one study into two batches; the third (NasalAsthma) and the fourth (BuccalFetalAlcohol) datasets repre-sent real life scenarios, where independent projects address the same clinical issue (atopic asthma and foetal alcohol spectrum disorder (FASD), respectively) in different laboratories, different dates, different clinical centres and heterogenous patients enrolment. In all cases, the datasets raw.idat files were available in GEO.
1. BloodIBD: the dataset from [12], GSE87648, includes whole blood DNA methylation data from 384 samples (18-79 y.o.), 204 subjects with Inflammatory Bowel Disease (IBD) and 180 healthy controls. Samples were processed in two different dates: 192 samples (90 IBD and 102 Controls) were scanned on 11/13 (date1), while 192 samples (90 IBD and 102 Con-trols) were scanned on 11/20 (date2). Here we simulate a meta-analysis by considering the two batches (dates) as two distinct studies with limited experimental variation, since sub-jects were selected according to the same criteria and samples were sequenced in the same laboratory and with the same protocols.
2. BloodParkinson: the dataset from [13], GSE111629, includes whole blood DNA methyla-tion data from 563 samples (35-92 y.o.), 329 subjects with Parkinson’s disease (PD) and 234 from healthy PD-free control subjects. Here the presence of two studies was simulated by artificially dividing the samples into two groups through a stratified sampling based on health status. One study includes 281 subjects (164 PD and 117 controls), while the other includes 282 subjects (165 PD and 117 controls). No batch effect is expected to exist between the two simulated studies, but we still use different pre-processing methods to investigate their effects on the results.
3. NasalAsthma: in this meta-analysis we consider two datasets that include DNA methylation data of nasal epithelial cells from children with persistent atopic asthma and controls. The first dataset (GSE65163) includes 72 subjects (9-12 y.o.), 36 asthmatics and 36 controls. The second dataset (GSE109446) includes 58 subjects (5-18 y.o.), 29 asthmatics and 29 controls.
4. BuccalFetalAlcohol: in this meta-analysis we consider two datasets that include DNA meth-ylation data of buccal epithelial cells from children with FASD and controls. The first data-set (GSE80261 [14]) includes 202 subjects (5-18 y.o.), 106 FASD and 96 controls, that were processed in two different dates, 89 on 04/12 (44 FADS and 45 controls) and 113 on 06/13 (62 FADS and 51 controls). The second dataset (GSE109042 [15]) includes 54 subjects (4-18 y.o.), 26 FASD and 27 controls.
Raw data of each study (.idat files) were downloaded from the GEO database and pre-pro-cessed with the R packages minfi 1.28.0 [6], wateRmelon 1.26.0 [7] and ENmix 1.18.1 [16]. In all cases, samples and probes were first filtered according to the recommended criteria [6] and then pre-processed. Specifically, samples were discarded if>5% of the probes had detection p-value>0.05. Probes were filtered out if the detection p-value was>0.05 in>1% of the samples. Samples whose median intensities in both the methylated (M) and unmethylated (U) channels were lower than most cases were also removed. For the BloodIBD dataset, 256 sam-ples over 384 were finally retained: 111 (60 IBD and 51 Controls) scanned ondate1and 154 (87 IBD and 67 Controls) scanned ondate2. For the BloodParkinson dataset all samples passed the pre-processing filters in both simulated batches. For the NasalAsthma meta-analysis 3 sam-ples were discarded from GSE65163 and none from GSE109446. For the BuccalFetalAlcohol study 18 samples were removed from GSE80261, leaving 94 FASD and 90 controls, while 22 samples were removed from GSE109042, leaving 16 FASD and 16 controls.
Methods
Raw data were pre-processed using eight of the most commonly used algorithms in literature [8]: 1) subset-quantile within array normalization (SWAN) [17], 2) Functional normalization
(FunNorm) [4], 3)dasen[7], 4) stratified quantile normalization (pQuantile) [6], 5)
normal-exponential using out-of-band probes (noob) [18], 6) Regression on Correlated Probes (RCP) [11], 7) Beta-Mixture Quantile Method (BMIQ) [19], and 8) the combination ofnooband
BMIQ, that was proven to outperform the other methods in [8].
Although a careful review of all methods can be found in [8], we here briefly recall their main features, further summarized inTable 2. In short, SWAN [17] performs within-array normalization separately for the methylated and unmethylated channels. First, it selects a ran-dom subset of type I and type II probes matched on the number of underlying CpG and it per-forms a quantile normalization. Then, it uses a linear interpolation to adjust the intensities of the remaining probes, separately for each probe type.
BMIQ [19] is a within-array normalization method that adjusts for probe type bias. It sepa-rately fits theβ-values distribution of type I and type II probes with a three-state beta mixture model, where the three states correspond to unmethylated, 50% methylated and fully methyl-ated probes. Then,BMIQquantile normalizes type II probes by state on the distribution of type I probes of the same state.
Noob[18] is a within-array normalization method that first performs background subtrac-tion by estimating the background mean intensity from the out-of-band control probes using a normal-exponential convolution model, and then normalizes the background-corrected intensities of the red and green channels based on the positive control probes.
Differently from the previous methods,dasen[7] performs a between-sample normaliza-tion. It equalizes type I and type II backgrounds and then quantile normalizes methylated and unmethylated intensities individually, considering separately type I and type II probes.
FunNorm[4] is also a between-sample normalization that uses the internal control probes
to estimate and adjust for technical variations. It normalizes separately the two probe types, and the methylated/unmethylated signals. Moreover, it processes separately for males and
females the probes that are located in chromosome X or Y.FunNormis particularly suitable when global changes of the methylome are expected between samples (i.e. in cancer-control studies or when comparing the DNA methylation of different tissues), as it does not rely on the assumptions of quantile normalization.
Stratified quantile normalization (preprocessQuantile, herepQuantile) [6] is a between-sam-ple normalization that takes into account the probe genomic region, known to affect the DNA methylation. It first quantile normalizes type I and type II intensities and then interpolates a reference distribution against which type I probes are normalized. This is done separately in each region and also separately for males and females for probes located in chromosome X and Y. Background correction is not used, but very small intensities are identified as outliers and removed.
Finally,RCP[11] is a within-array normalization that exploits the spatial correlation of DNA methylation on CpG sites. Namely, it uses type I and type II probes pairs that are closer than 25 base pairs and that share the same genomic context (Island, N_Shelf, N_Shore, S_Shelf, S_shore or OpenSea) to estimate the calibration transformation between type I and type II intensities.
In addition to the eight normalizations we also assessed raw data. In all cases, M-values (logit2 ofβ-values) rather thanβ-values were used for further analysis, as suggested in [20].
Regional RCP with quantile normalization (
regRCPqn
)
Given the impact of heterogeneous normalizations on meta-analysis (see sectionResults and discussion), we propose an additional step to harmonize datasets that were pre-processed with different algorithms. Notice that our method does not require the raw.idat files and can hence be applied also to datasets with only pre-processedβ-values available, a common real-life sce-nario. Our procedure,regRCPqn, outlined in Algorithm 1, specifically enhancesRCPwith the inclusion of three features to address the issue under study (i.e. meta-analysis from possibly differently pre-processed datasets). First (lines 4-8 in Algorithm 1), it computes theRCP nor-malization separately for each genomic region type (i.e. for CpG belonging to Islands, Shores, Shelves or OpenSeas), as the distribution of DNA methylation values is different in each of these regions [21] (RCP considers the regions to compute the transformation, but it does not normalize separately the CpG that belong to different regions). Then, it performs a between-sample quantile normalization where the CpG values of all between-samples are quantile normalized separately for each CpG region and for type I and type II probes (lines 11-12). Finally, it intro-duces the possibility to save a reference distribution and to use it to perform a reference-based quantile normalization of the samples from the other dataset(s) (lines 14-17). The reference distribution is computed separately for each region type and for type I and type II probes and it is computed as the average of the values obtained over the samples. When available, such dis-tribution is used byregRCPqnto perform the reference-based normalization, again separately for each region and probe type (lines 21-22).
Notice that, as it is the case for some pre-processing methods, e.g.dasenandpQuantile, the
regRCPqnalgorithm performs a between-sample quantile normalization. Hence it should not
be applied when global differences are expected, such as in cancer-control studies or when comparing the DNA methylation of different tissues. The X- and Y-chromosomes are removed from the analysis to avoid gender bias [22].
regRCPqnis implemented in R 3.5.1. It is available as open source R package on GitHub
(https://github.com/regRCPqn/regRCPqn) and can be installed using the devtools command install_github(“regRCPqn/regRCPqn”).
Algorithm 1regRCPqn
Require: Mdata is a matrix of M-values; annot450k is a matrix of CpG region annotations that includes CpG region and probe type; refPDF = {refPDF.I, refPDF.II} are (optional) reference distributions of type I and II
1: function REGRCPQN(Mdata, annot450k, refPDF)
2: Mdata_out Mdata
3: for R 2 {OpenSea,Island,Shelve,Shore} do 4: CpGR CpG in region R from annot450k
5: probe.I type I CpGR
6: probe.II type II CpGR
7: MdataR Mdata[GpGR] . Submatrix in region R
8: RCP(MdataR) . Run RCP on region R data
9: if refPDF = NULL then
10: . Quantile normalization for each probe type
11: MdataR[probe.I] QN(MdataR[probe.I]) 12: MdataR[probe.II] QN(MdataR[probe.II])
13: . Save reference distribution on file
14: refPDF.I mean(MdataR[probe.I]) 15: refPDF.II mean(MdataR[probe.II])
16: refPDF {refPDF.I, refPDF.II}
17: save(refPDF)
18: else
19: .Quantile normalization for each probe type
20: .wrt reference refPDF = {refPDF.I, refPDF.II}
21: MdataR[probe.I] QN(MdataR[probe.I],refPDF.I) 22: MdataR[probe.II] QN(MdataR[probe.II],refPDF.II)
23: end if
24: .Save region R normalized data
25: Mdata_out[GpGR,] MdataR
26: end for
27: return Mdata_out
28: end function
Datasets pre-processing
We pre-processed the two studies of each dataset considering each possible combination of the nine pre-processing methods (eight pre-processing pipelines plus raw data). Then, we evalu-ated the effect of pre-processing on meta-analysis by performing a differential methylation analysis using the health status as variable of interest. In each meta-analysis we always consid-ered the case of data re-normalized withregRCPqn. WhenregRCPqnwas used, we first applied the re-normalization to one of the two studies (data from 11/13 for BloodIBD, first random subset for BloodParkinson, GSE65163 for NasalAsthma and GSE109042 for BuccalFetalAlco-hol), and then we used the obtained reference distribution to normalize the samples from the other study. Before proceeding with the differential analysis we performed batch effect correc-tion using Combat [23].
Statistical analysis
We perform differential analysis to identified differentially methylated positions (DMPs) between cases and controls by computing a linear regression model for each CpG site. The analysis was performed in R 3.5.1. Each DNA methylation value (M-value) was regressed against the health status, while adjusting for confounding variables, an approach widely used in literature [12–15]. In BloodIBD, the confounding variables included age, sex, smoking sta-tus and cell counts, estimated with minfi [24]. In BloodParkinson and BuccalFetalAlcohol,
smoking status was not available, but we included ethnicity. In BuccalFetalAlcohol we con-strained the analysis to the 648 CpG sites that were investigated by the authors [15]. The Nasa-lAsthma dataset GSE109446 included pairs of siblings, hence we introduced a random effect to model the correlations among family members. We fitted the model using the R libraries lme4 1.1.19 [25] and lmerTest 3.1.0 [26] and we included age, sex and ethnicity as confounding variables.
In all cases, statistical significance was set at p-value<0.05 following adjustment for multi-ple testing using the Benjamini-Hochberg correction.
Finally, we computed the variability in the number of DMPs obtained by the different pre-processing combinations as the Median Absolute Deviation (MAD). To test whether the MADs obtained usingregRCPqnare lower than those obtained withoutregRCPqn harmoniza-tion, we performed a bootstrap resampling with 1000 iterations. Then, we tested for statistical significance using a one-tailed t-test. Finally, we identified outliers as points whose absolute distance from the median is larger than three times the dataset MAD.
Results and discussion
Between-sample variability
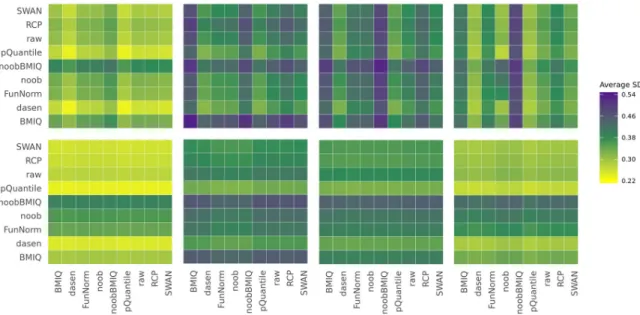
To investigate the impact of pre-processing on the distribution of M-values we estimated the global between-sample variability. For each meta-analysis, we considered all the control sub-jects (from both subsets), and we computed the standard deviation (SD) of each CpG site (M-value). Finally, we used the average SD as a measure of between-sample variability. The com-putation was performed for each of the nine pre-processing procedures outlined above, con-sidering all combinations, including same pre-processing method for both studies.
The average between-sample variability depends on the pre-processing. When both datasets are pre-processed in the same way, we observe that the highest average SD is obtained when usingBMIQornoobBMIQ, while the lowest one is achieved withdasenandpQuantile(Fig 1 top,S1 Table), in agreement with the results obtained by Liu et al. [8]. Interestingly,BMIQand
Fig 1. Heat maps representing the average of the M-values between-sample standard deviations. The x-axis and the y-axis indicate
which pre-processing method was applied to the two datasets of the same analysis. Results are shown with (bottom) and without (top) application ofregRCPqnand refer from left to right to datasets BloodIBD, BloodParkinson, NasalAsthma and BuccalFetalAlcohol.
noobBMIQperform a within-sample normalization adjusting for probe type bias and, in the case ofnoobBMIQ, for the background, whiledasenandpQuantileimplement a between-sam-ple normalization, a feature that could explain our results. Although absolute performances are not the aim of our study, we observe that when applyingregRCPqn, the global between-sample variability is generally reduced, as proven by the one-tailed t-test p-values inS1 Table and shown at the bottom plot ofFig 1. This suggests that applyingregRCPqnon top of a meta-analysis helps reducing data harmonization issues.
In particular, if the pre-processing of the two datasets is different, then the observed vari-ance mainly depends on the method used in the first dataset, normalized usingregRCPqn with-out reference distributions. This indicates that using the reference-based version ofregRCPqn
masks the effect of the pre-processing choice on the second dataset.
Differential analysis is affected by pre-processing
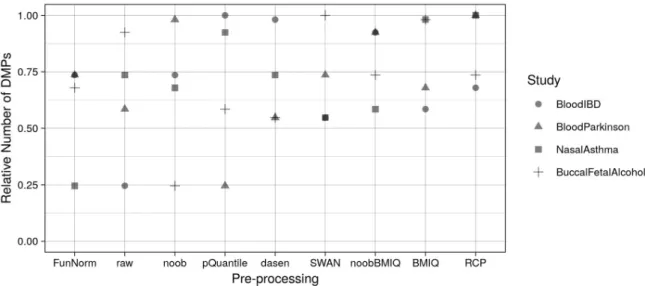
We evaluated the effect of pre-processing on differential analysis by counting the number of DMPs obtained when using different methods. We considered all the nine pre-processing pipelines and we assessed the results pre-processing the two subsets of each meta-analysis both with the same method and with different ones.
Notice that the number of DMPsper seis not a metric of success of the method. However, since a pre-processing independent ground truth cannot be knowna priori, the consensus among methods was used as a proxy of the robustness of the finding [27]. Therefore, we inves-tigated the variability in the number of DMPs and the concordance between results obtained with the various methods.
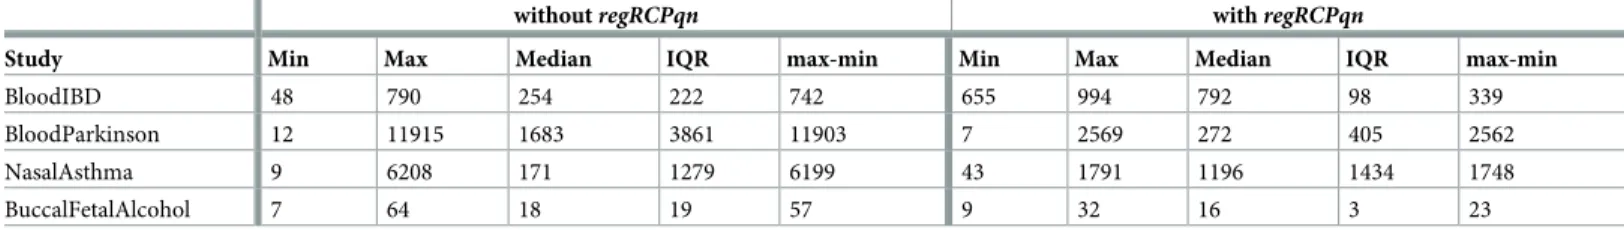
The number of DMPs found by each analysis was highly variable (from 1 to 3 orders of magnitude) depending on the pre-processing method used, as shown inTable 3. Such variabil-ity was observed even when using the same pre-processing method for both datasets (Table 4), confirming the pertinence of this analysis in the methylation meta-analysis context.Fig 2and S2 Tableshow that, on average, the minimum number of DMPs was obtained when using Fun-Norm, followed by raw data. The result onFunNormwas in line with the findings of Liu et al. [8], showing that this method has a higher sensitivity than raw data but performs worse than other within-samples normalization methods. It was also expected for the raw data approach Table 3. Summary statistics of the number of DMPs found by the differential analysis.
withoutregRCPqn withregRCPqn
Study Min Max Median IQR max-min Min Max Median IQR max-min
BloodIBD 48 790 254 222 742 655 994 792 98 339
BloodParkinson 12 11915 1683 3861 11903 7 2569 272 405 2562
NasalAsthma 9 6208 171 1279 6199 43 1791 1196 1434 1748
BuccalFetalAlcohol 7 64 18 19 57 9 32 16 3 23
https://doi.org/10.1371/journal.pone.0229763.t003
Table 4. Summary statistics of the number of DMPs found by the differential analysis when the two subsets of each study are pre-processed with the same method. withoutregRCPqn withregRCPqn
Study Min Max Median IQR Max-Min Min Max Median IQR Max-Min
BloodIBD 48 790 492 347 742 662 994 850 100 332
BloodParkinson 142 11915 4729 3577 11773 15 2569 465 1041 2554
NasalAsthma 27 6153 1432 2187 6126 43 1791 1636 1612 1748
BuccalFetalAlcohol 13 53 39 18 40 13 27 19 3 14
to identify less DMPs than other methods. In fact, the lack of a normalization step should gen-erate more noisy data, hence the differences between cases and controls are more difficult to detect. Finally, the maximum number of DMPs was obtained withRCP, confirming previous findings [11].
In general, our results were not stable when considering different datasets, an issue also pre-viously reported [8]. For example, usingnoob, we observed the minimum number of DMPs in BuccalFetalAlcohol, while in BloodParkinson we obtained a number of DMPs equal to 98% of the maximum number of DMPs observed for this meta-analysis. However, sorting the pre-processing methods according to the average fraction of detected DMPs, we could observe the trend shown on the x-axis ofFig 2(seeS2 Tablefor numeric values).
The high variability in the number of DMPs was reduced when usingregRCPqn. In fact, Table 3shows that the Inter Quartile Range (IQR) of the number of DMPs decreased after the application ofregRCPqnin all meta-analyses but NasalAsthma, and that the difference between the maximum and minimum number of DMPs also decreased in all meta-analyses. The heat maps inFig 3graphically display these results.
In all analyses, heat maps are shown with (right) and without (left)regRCPqn. In general, when applyingregRCPqn, the number of DMPs found with different pre-processing became closer to the median number of DMPs.S3 Tablereports the MADs obtained with and without
regRCPqn. Bootstrap p-values show that in all studies but NasalAsthma we obtained a lower
MAD when usingregRCPqn. Moreover, whenregRCPqnwas applied, the number of outliers was reduced in half of the datasets. These results are visually shown inFig 3, where heat maps have lighter colours (i.e. number of DMPs closer to the median) whenregRCPqnis used (plots on the right), and box plots have longer boxes (wider Inter Quartile Range) whenregRCPqnis not used.
Finally, we investigated the concordance between the results obtained with different pre-processing methods, counting the number of DMPs that are identified by more than one method. This was achieved using two approaches: first, comparing the results of each pair of pre-processing methods; second, considering the same pre-processing for both subsets of each meta-analysis and evaluating the concordance between each method and all the others. To Fig 2. Relative number of DMPs found in each meta-analysis when using the same pre-processing for both datasets. Counts of each
meta-analysis have been normalized dividing for the maximum number of DMPs. Pre-processing methods are listed on the x-axis in ascending order according to the average relative number of DMPs obtained in the four meta-analyses.
evaluate the pairwise concordance, we considered each pair of pre-processing pipelines and computed the number of DMPs recognized by both methods (co-occurrence matrix). The box plots inFig 4, display the distribution of the number of co-occurring DMPs considering all possible pairwise combinations of pre-processing methods with (right) and without (left)
regRCPqn. The fraction of co-occurring DMPs varies from less than 0.25 to 1 and depends on
the pair of methods and on the meta-analysis under investigation. Moreover, in general, the Fig 3. Heat maps and box plots representing the number of DMPs found in the four studies (from top to bottom: BloodIBD, BloodParkinson, NasalAsthma and BuccalFetalAlcohol) when using different pre-processing methods. For each study, the two heat
maps correspond to the case whereregRCPqnwas (right) or was not (left) applied. The colour of each cell is representative of the number of DMPs found when the datasets under consideration are pre-processed according to the methods specified on the x and y axes. Here, yellow corresponds to the minimum number of DMPs (with or withoutregRCPqn), purple to the maximum and green to the median. The cells on the diagonal indicate that both datasets were pre-processed with the same method and show that DPMs remain highly variabile.
concordance increases usingregRCPqn: for all datasets, one-tailed Welch’s test p-values are less than 10−16.
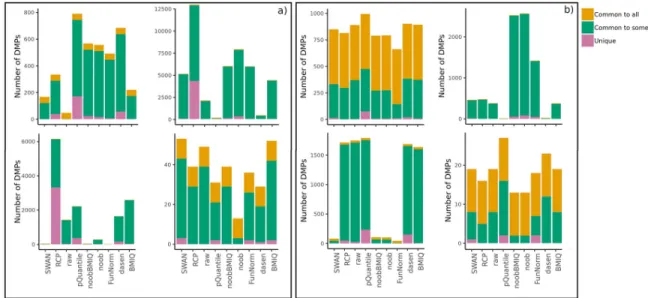
The concordance between each method and all the others was evaluated by computing the number of DMPs that are found by all, some or none of the other approaches.S4 Tableand the bar plots inFig 5show for each method the number of identified DMPs that are also detected by all, some, or none of the other methods. Without usingregRCPqn(Fig 5, panel a)), all meta-analyses contained a subset of DMPs that were identified by all methods andunique
DMPs were obtained mainly by methods that identified a greater number of DMPs (RCPand
pQuantile). One-tailed Welch’s test p-values (S4 Table) suggested that applyingregRCPqn
improves the outcome. In fact, even if the statistical significance was low for two out of four datasets, our results showed that the use ofregRCPqntends to increase the number of DMPs Fig 4. Box plots of the fraction of co-occurring DMPs computed as the number of DMPs found by one pair of analyses divided by the number of DMPs found by the analysis with less DMPs (within the pair). Results are shown for the four datasets (from left to
right: BloodIBD, BloodParkinson, NasalAsthma and BuccalFetalAlcohol) and considering the cases where regRCP was or was not applied, as indicated on the x-axis.
https://doi.org/10.1371/journal.pone.0229763.g004
Fig 5. Bar plots of the number of DMPs found by each pre-processing method, considering both datasets pre-processed in the same way. Colours indicate: (i) the number of DMPs that are found by at least one other method (Common to some), (ii) by all the
methods (Common to all) or (iii) only by that method (Unique). Results are shown for the four analyses: BloodIBD (top-left), BloodParkinson (top-right), NasalAsthma (bottom-left), BuccalFetalAlcohol (bottom-right). Panel a) refers to the case whereregRCPqn
is not applied, while panel b) shows the results obtained usingregRCPqn.
shared by all methods while decreasing the number ofuniqueDMPs identified by only one method (Fig 5, panel b).
Our results, hence, suggested that harmonizing the data withregRCPqnreduces the vari-ability related to the use of different pre-processing procedures in the two datasets.
Conclusion
The high availability of public DNA methylation datasets opens to the possibility of perform-ing meta-analyses. Often, however, data are pre-processed in different ways, due to the lack of consensus on pre-processing and on potentially different needs associated to the specificities of the study. Further, owing to the limited compliance to GEO guidelines and standards, raw data are seldom made available. In order to assess the impact of this on further analyses we sys-tematically investigated the effects of different processing methods. We found that pre-processing affects both the between-sample variability and the results of meta-analysis, using as exemplar differential analysis. In general, results are highly variable depending on the dataset under investigation. We must notice that our results are based on a selection of dataset sufficiently diverse to grant generalization, but limited (4 dataset pairs) and that dataset agree-ment is used as a performance metric, as ‘ground truth’ is not available for this type of analyses. Nevertheless, we were able to identify some general trends. Concerning the between-sample variability, we show that the lowest variability among control samples is achieved when pre-processing methods that perform a between-sample normalization are applied (i.e.dasenor
pQuantile), while the highest variability is obtained when usingBMIQornoobBMIQ. The
dependence on the pre-processing method was also observed for the results of the differential analysis. Specifically, the number of DMPs identified in the comparison between cases and controls can vary by more than a few thousands when changing the pre-processing method, and the concordance between the identified DMPs is only partial.
Data harmonization remains a main issue of meta-analysis. Our algorithm, named
regRCPqn, largely relies onRCPand can reduce the global variability between control samples
and increase the stability of the differential analysis.
Supporting information
S1 Table. For each combination of pre-processing, we show the between-sample variability (average SD) with and withoutregRCPqn. T-test was performed to test if the difference in
average SD usingregRCPqnor not is statistically significant. (XLSX)
S2 Table. For each pre-processing we report the number of DMPs found in each meta-analysis. Mean and standard deviation of the number of DMPs across the 4 studies are also
reported. Only the case in which the same pre-processing is used for both datasets of the meta-analysis is considered.
(XLSX)
S3 Table. For each dataset, we report the MAD of the number of DMPs obtained when using different preprocessing. Outliers and boostrap p-values that tests whether using
regRCPqnreduces MAP, are also reported.
(XLSX)
S4 Table. For each dataset, we report for each pre-processing method the number of DMPs also found by all the others (Common to all), by at least one other (Common to other) and by none of the others (Unique). To test whether usingregRCPqnincreases the number of DMPs common to all methods and decreases the number ofuniqueDMPs, we considered the
difference between the fractions obtained with and withoutregRCPqnand we used a one-tailed Welch’s test. Finally, we report a summary table in which the number of DMPs obtained for each dataset and for each pre-processing method, using and not usingregRCPqn, is indicated. Only the case in which the same pre-processing is used for both datasets of the meta-analysis is considered.
(XLSX)
Author Contributions
Conceptualization: Claudia Sala, Christine Nardini. Data curation: Claudia Sala, Danielle Fernandes Durso. Formal analysis: Claudia Sala.
Funding acquisition: Gastone Castellani.
Methodology: Claudia Sala, Pietro Di Lena, Christine Nardini. Software: Claudia Sala.
Supervision: Christine Nardini. Validation: Claudia Sala.
Visualization: Claudia Sala, Andrea Prodi.
Writing – original draft: Claudia Sala, Christine Nardini.
Writing – review & editing: Claudia Sala, Pietro Di Lena, Danielle Fernandes Durso, Andrea
Prodi, Gastone Castellani, Christine Nardini.
References
1. Edgar R, Domrachev M, Lash AE. Gene Expression Omnibus: NCBI gene expression and hybridization array data repository. Nucleic acids Res, 2002; 30(1): 207–210.https://doi.org/10.1093/nar/30.1.207 PMID:11752295
2. Bibikova M, Barnes B, Tsan C, Ho V, Klotzle B, Le JM, et al. High density DNA methylation array with single CpG site resolution. Genomics, 2011; 98(4): 288–295.https://doi.org/10.1016/j.ygeno.2011.07. 007PMID:21839163
3. Wang Z, Wu X, Wang Y. A framework for analyzing DNA methylation data from Illumina Infinium HumanMethylation450 BeadChip. BMC Bioinformatics, 2018; 19(5): 115.https://doi.org/10.1186/ s12859-018-2096-3
4. Fortin JP, Labbe A, Lemire M, Zanke BW, Hudson TJ, Fertig EJ, et al. Functional normalization of 450k methylation array data improves replication in large cancer studies. Genome biol. 2014; 15(11): 503. https://doi.org/10.1186/s13059-014-0503-2PMID:25599564
5. Palumbo D, Affinito O, Monticelli A and Cocozza S. DNA Methylation variability among individuals is related to CpGs cluster density and evolutionary signatures. BMC genomics, 2018, 19(1): 229.https:// doi.org/10.1186/s12864-018-4618-9PMID:29606093
6. Aryee MJ, Jaffe AE, Corrada-Bravo H, Ladd-Acosta C, Feinberg AP, Hansen KD, et al. Minfi: A flexible and comprehensive Bioconductor package for the analysis of Infinium DNA Methylation microarrays. Bioinformatics. 2014; 30(10): 1363–1369.https://doi.org/10.1093/bioinformatics/btu049PMID: 24478339
7. Pidsley R, Wong CC, Volta M, Lunnon K, Mill J, Schalkwyk LC. A data-driven approach to preprocess-ing Illumina 450K methylation array data. BMC Genomics. 2013; 14(1): 293.https://doi.org/10.1186/ 1471-2164-14-293PMID:23631413
8. Liu J, Siegmund KD. An evaluation of processing methods for HumanMethylation450 BeadChip data. BMC Genomics, 2016; 17(1): 469.https://doi.org/10.1186/s12864-016-2819-7PMID:27334613
9. Stewart GB, Altman DG, Askie LM, Duley L, Simmonds MC, Stewart LA. Statistical analysis of individ-ual participant data meta-analyses: a comparison of methods and recommendations for practice. PloS one, 2012, 7(10): e46042.https://doi.org/10.1371/journal.pone.0046042PMID:23056232
10. Smith-Warner SA, Spiegelman D, Ritz John, Albanes D, Beeson WL, Bernstein L, et al. Methods for pooling results of epidemiologic studies: the Pooling Project of Prospective Studies of Diet and Cancer. Am J Epidemiol, 2006, 163(11): 1053–64.https://doi.org/10.1093/aje/kwj127PMID:16624970 11. Niu L, Xu Z, Taylor JA. RCP: a novel probe design bias correction method for Illumina Methylation
Bead-Chip. Bioinformatics, 2016; 32(17): 2659–2663.https://doi.org/10.1093/bioinformatics/btw285PMID: 27153672
12. Ventham NT, Kennedy NA, Adams AT, Kalla R, Heath S, O’leary KR, et al. Integrative epigenome-wide analysis demonstrates that DNA methylation may mediate genetic risk in inflammatory bowel disease. Nat Commun. 2016; 7: 13507.https://doi.org/10.1038/ncomms13507PMID:27886173
13. Chuang YH, Paul KC, Bronstein JM, Bordelon Y, Horvath S, Ritz B. Parkinson’s disease is associated with DNA methylation levels in human blood and saliva. Genome Med, 2107; 9(1): 76.https://doi.org/ 10.1186/s13073-017-0466-5
14. Portales–Casamar E, Lussier AA, Jones MJ, MacIsaac JL, Edgar RD, Mah SM, et al. DNA methylation signature of human fetal alcohol spectrum disorder. Epigenetics Chromatin, 2016; 9(1): 25.https://doi. org/10.1186/s13072-016-0074-4PMID:27358653
15. Lussier AA, Morin AM, MacIsaac JL, Salmon J, Weinberg J, Reynolds JN, et al. DNA methylation as a predictor of fetal alcohol spectrum disorder. Clin Epigenetics, 2018; 10(1): 5.https://doi.org/10.1186/ s13148-018-0439-6PMID:29344313
16. Xu Z, Niu L, Li L, Taylor JA. ENmix: a novel background correction method for Illumina HumanMethyla-tion450 BeadChip. Nucleic Acids Res. 2015; 44(3): e20–e20.https://doi.org/10.1093/nar/gkv907 PMID:26384415
17. Maksimovic J, Gordon L, Oshlack A. SWAN: Subset-quantile within array normalization for illumina infi-nium HumanMethylation450 BeadChips. Genome Biol. 2012; 13(6): R44. https://doi.org/10.1186/gb-2012-13-6-r44PMID:22703947
18. Triche TJ Jr, Weisenberger DJ, Van Den Berg D, Laird PW, Siegmund KD. Low-level processing of Illu-mina Infinium DNA methylation beadarrays. Genome biol. 2013; 41(7): e90.
19. Teschendorff AE, Marabita F, Lechner M, Bartlett T, Tegner J, Gomez-Cabrero D, et al. A beta-mixture quantile normalization method for correcting probe design bias in Illumina Infinium 450k DNA methyla-tion data. Bioinformatics. 2013; 29(2): 189–196.https://doi.org/10.1093/bioinformatics/bts680PMID: 23175756
20. Du P, Zhang X, Huang CC, Jafari N, Kibbe WA, Hou L, et al. Comparison of Beta-value and M-value methods for quantifying methylation levels by microarray analysis. BMC Bioinformatics, 2010; 11(1): 587.https://doi.org/10.1186/1471-2105-11-587PMID:21118553
21. Touleimat N, Tost J. Complete pipeline for Infinium®Human Methylation 450K BeadChip data
process-ing usprocess-ing subset quantile normalization for accurate DNA methylation estimation. Epigenomics, 2012; 4(3): 325–341.https://doi.org/10.2217/epi.12.21PMID:22690668
22. Moen EL, Litwin E, Arnovitz S, Zhang X, Zhang W, Dolan ME, et al. Characterization of CpG sites that escape methylation on the inactive human X-chromosome. Epigenetics, 2015; 10(2): 810–8.https:// doi.org/10.1080/15592294.2015.1069461PMID:26178744
23. Johnson WE, Li C, Rabinovic A. Adjusting batch effects in microarray data using empirical bayes meth-ods. Biostatistics, 2007; 8(1): 118–127.https://doi.org/10.1093/biostatistics/kxj037PMID:16632515 24. Houseman EA, Accomando WP, Koestler DC, Christensen BC, Marsit CJ, Nelson HH, et al. DNA
meth-ylation arrays as surrogate measures of cell mixture distribution. BMC Bioinformatics, 2012; 13(1): 86. https://doi.org/10.1186/1471-2105-13-86PMID:22568884
25. Bates D, Ma¨chler M, Bolker B, Walker S. Fitting Linear Mixed-Effects Models Using lme4. J Stat Softw, 2015; 67(1): 1–48.https://doi.org/10.18637/jss.v067.i01
26. Kuznetsova A, Brockhoff PB, Christensen RH. lmerTest Package: Tests in Linear Mixed Effects Mod-els. J Stat Softw, 2017; 82(13): 1–26.https://doi.org/10.18637/jss.v082.i13
27. Sung J, Wang Y, Chandrasekaran S, Witten DM, Price ND. Molecular signatures from omics data: from chaos to consensus. Biotechnol J, 2012, 7(8): 946–57.https://doi.org/10.1002/biot.201100305PMID: 22528809