Cite this article as: Srikanth, S., Mehar, A., Praveen, K. G. N. V. (2020) "Simulation of Traffic Flow to Analyze Lane Changes on Multi-lane Highways under Non-lane Discipline", Periodica Polytechnica Transportation Engineering, 48(2), pp. 109–116. https://doi.org/10.3311/PPtr.10150
Simulation of Traffic Flow to Analyze Lane Changes
on Multi-lane Highways under Non-lane Discipline
Seelam Srikanth1*, Arpan Mehar1, Kolisetty Guru Naga Venkata Praveen1
1 Transportation Division, Department of Civil Engineering, National Institute of Technology, Warangal – 506004, Telangana, India * Corresponding author, e-mail: [email protected]
Received: 10 September 2016, Accepted: 22 September 2017, Published online: 30 January 2018
Abstract
The present study uses the microscopic traffic simulation flow model VISSIM for generating traffic flow data to obtain the essential parameters. Study calibrated and validated the VISSIM model based on the field data. Further, lane change behaviour is analyzed with homogeneous vehicle type traffic on four-lane, six-lane and eight-lane divided highways sections through VISSIM simulation model. The study finds the number of lane changes depends on traffic volume as well as on a number of lanes provided for a direction of travel. Lane change data was correlated with traffic volume, and the third-degree polynomial trend was found to be fitted on each type of simulated highway sections. A maximum number of lane changes and lane change at the capacity level of the volume are also quantified on simulated sections of four-lane, six-lane and eight-lane divided highways.
Keywords
mixed traffic, VISSIM, calibration, validation, lane changes
1 Introduction
India has second largest road network in the world with a total length of 4.6 million kilometres. The substantial increase in vehicular traffic growth on roads need a bet -ter system for transporting goods and people across the nation. Traffic volume in India is expected to increase in future years due to rapid growth in social and economic development. Realizing this fact that the Government of India (GOI) has taken new steps under National Highway Development Program (NHDP) to provide high-den-sity corridors such as multilane highways and express -ways for meeting the present and future needs of rapid, efficient, safe, and inter-connected highway networks. Multilane highways need serious thoughtfulness concern-ing the movement of traffic flow and capacity. Various lane changing and overtaking manoeuvres as take place on such highways which some leads to severe accidents.
Traffic flow behaviour on multilane highways is a com -plex phenomenon to understand and need better concep -tual and logical way of data collection, analysis, and its interpretation. Various attempts made for modeling and the quantifying analogy of traffic flow behavior using empirical and analytical approach even under mixed traf -fic are successful but limited to field speci-fic roadway
and traffic conditions. The limitations arise due to prac -tical difficulties in conducting extensive field experi -ments under wide variations of traffic flow parameters, non-availability of required field conditions, difficulty in experimenting with individual components in isolation, etc. As a solution to these practical problems, computer simulation has been proved to be a powerful tool in repli-cating complex traffic systems which allow experimenta -tion to the basic traffic flow system. One such microscopic traffic simulation model is VISSIM which was developed in Germany based on the continuous work of Widemann on car-following behaviour. In the present study, VISSIM model is used to generate the traffic flow for a wide range from lower to higher levels and analyzed a num-ber of lane changes on multilane highways. The capac-ity of four-lane, six-lane and eight-lane divided sections was also estimated with the help of a speed-flow diagram. The present study aims to analyze the capacity and lane changes for homogeneous vehicle type traffic stream by using pre-calibrated values of parameters CC0 and CC1 under non-lane discipline. To attain the study objectives, influencing parameters in VISSIM model are calibrated and validated based on field data, and subsequently, lane
changes of vehicles were analyzed on a different type of highway sections.
2 Background Literature
Extensive research has been carried out worldwide to understand the traffic flow behaviour under interrupted and uninterrupted conditions. One of the oldest study done by Greenshield (1934), where the author assumed a polynomial shape of the speed-flow curve obtained from field data based on calculated density. Afterwards, many empirical studies were performed using speed and flow data and proposed different alternative forms of speed-flow curves under both heterogeneous and homogeneous. However, present review of literature is covering some of the most relevant studies on capacity and lane changes done in recent past decades based on field data and traffic simulation model.
2.1 Studies based on field data
Hoban (1987) performed the traffic study using field-col -lected traffic flow data to summarize the simple lin -ear form of speed-volume relationship as an alterna-tive to polynomial one, to determine highway capacity. Highway Research Board (HRB) of USA released the first Highway Capacity Manual (HCM) in 1965 that provided basic guidelines for capacity analysis. Later, the guide-lines were revised several times as and when technolog-ical development took place into vehicle manufacturing and infrastructure industries. Indonesian IHCM (1997) was developed with certain guidelines to model speed and flow data for determining capacity values. HCM (2010) have provided the shape of speed-flow curves at differ -ent free flow speeds where stream speeds are assumed to be insignificant with an increase in volume. A substan -tial amount of studies were also performed under mixed traffic conditions. Some of the relevant studies are dis -cussed in this section. Tanaboriboon and Aryal (1990) studied the effect of vehicle size on highway capacity in Thailand. It was found that medium-size vehicles do not affect the lane capacity. Roadway capacity was estimated to be 2100 PCU/hour/lane which was 9% more than the basic capacity adopted on highways in Thailand. Yang and Zhang (2005) established the fundamental flow rela -tionships based on extensive field traffic flow survey data collected on multilane highways in Beijing. The average capacity per lane was found to reduce with the addition of an extra lane to a highway. They suggested ideal capac -ity values for four-lane, six-lane, and eight-lane divided
highways as 2250, 2100 and 2000 PCU/hour/lane. Sinha et al., (2012) performed a comparative study on the effect of motorcycle proportions on the capacity of four-lane urban roads in India and Thailand. Linear regression analysis was carried out to propose the relationship between capac-ity and motorcycle percent share for the highways in both countries. Mehar et al., (2014) determine the capacity of four-lane divided highway under mixed traffic conditions. Authors analyzed field data and suggested the capac -ity of four-lane divided highway with the paved shoulder as 5227 PCU/hr/dir. Many authors related capacity of a roadway with lane changing and overtaking behaviour. Laval et al., (2008) introduced a framework to solve vehi -cle lane-changing problem using a macroscopic theory inside microscopic models. Knoop et al., (2012) proposed a methodology to quantify lane changes and tested with the field observed data. Authors suggested the proposed lane change measurement can be used to quantify the effect of lane changes on the capacity. Jin (2010) analyzed macroscopic characteristics of lane changing on multilane highways. The author revealed that angles of lane chang-ing of the vehicle are highly related to the density of traffic stream and found that the lane changes have a significant effect on the capacity of multilane highways.
2.2 Studies based on simulation
The analysis and modeling of traffic flow behavior using traffic flow simulation have been very popular during past few decades. The traffic simulation models are very vital in resolving the complexities arrive in the modeling of mac -roscopic and mic-roscopic traffic flow behaviours. Some of the important studies based on simulation model are dis-cussed in this subsection. Chitturi and Benekohal (2008) presented a procedure for calibration of default parameters in VISSIM and found that the driver behaviour parame -ters namely CC0 (standstill distance) and CC1 (time head-way) influences the capacity values and also for low-speed conditions, the impact of CC0 on capacity was found sig-nificant but as the speed increases its effect diminishes while the impact of CC1 increases. Park and Won (2006) described a procedure for calibration of default parame-ters in VISSIM and found that the safety distance reduc -tion factor defined for the link indicates the aggressive -ness of the driver. Menneni et al., (2008) also performed the parameter calibration of VISSIM using optimization algorithm and developed a new methodology for assess-ing the capacity by matchassess-ing the speed-flow graphs from the field as well as from simulation. Park and Kwak (2011)
also evaluated the results of calibration and validation pro-cedure by comparing the distribution of simulation output with field data. Mehar et al., (2013) investigated the sen -sitivity of different driving behaviour parameters given in VISSIM model on capacity. Authors identified two param -eters in the Widemann 99 model as CC0 and CC1 affect-ing the simulated capacity significantly. Velmurugan et al., (2010) also used traffic simulation model VISSIM and plotted speed-flow curves on four-lane, six-lane and eight-lane divided highways and reported their directional capacity values as 5574 PCU/hr, 7733 PCU/hr, and 9796 PCU/hr respectively. Authors analyzed capacity of multi -lane highways with and without -lane changing behaviour.
3 Field data
Field data were collected for present study at two differ-ent locations on four-lane divided National Highway (NH) known as NH 163, Warangal to Hyderabad, India. The traf-fic flow data on the first section (Section I) was collected near Bibinagar village and on second section (Section –II) near Ghanpur village. Both the highways are having paved shoulders in good conditions with 1.5 m width and differ concerning access control. The snapshot of Section I is shown in Fig. 1. Field data collected in the section-I used for development of VISSIM model whereas data collected on section II used for validation of VISSIM model.
Traffic flow data on sections were collected by using the video-graphic method with the help of marking 50 m trap-length in one direction of travel. Data collection was performed for 4 hours from 8 AM to 12 PM on a typical weekday under clear weather conditions. The collected data were then extracted with the aid of semi-automated data extraction software to obtain classified traffic vol -ume counts and mean speed of vehicles at every 5-minute interval. All the vehicles were classified into five catego -ries namely, Standard car (CS), big utility car (CB), Two-wheeler (2W), Three-Two-wheeler (3W), and Heavy Vehicle (HV). Standard car (CS) is defined as a Passenger car in the present analysis.
4 Field data analysis
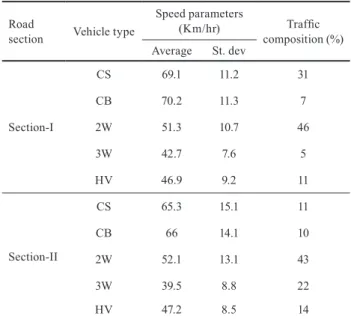
The speed of a vehicle was determined by noting down the time taken by a vehicle to traverse the trap length using a stopwatch of 0.01s accuracy. Speeds of an individ -ual category of vehicles were extracted, and the distribu -tion profiles were created. The average speed of different vehicles and their traffic composition are given in Table 1.
Field traffic volume measured in veh/hr and further converted into passenger car equivalency units using the method of dynamic PCU estimation as proposed by Chandra and Kumar (2003). PCU of ith type of vehicle was estimated by using Eq. (1).
PCUi =
(
Vc Vi) (
Ac Ai)
Where, PCUi is the passenger car unit of the ith type of
vehicle, Vc is the speed of standard car in km/hr, Vi is the speed of ith vehicle type in km/hr; A
c is the projected area of the small car in m2; A
i is the projected area of the ith vehicle type in m2.
The stream speed was calculated at each 5 min inter-val by taking the weighted average speed of all vehicle categories. The speed-flow relationship was developed from field data to determine a capacity of the study sec -tion. The speed-flow field data was fitted to a theoretical Greenshields polynomial speed-flow model by assuming a straight line relationship between calculated density and stream speed. This theoretical model yielded the capacity of the four-lane divided highway as 5267 PCU/hr/dir.
Fig. 1 Snapshot of four-lane divided highway (Section-I)
Table 1 Speed data and traffic composition on both sections
Road
section Vehicle type
Speed parameters (Km/hr) Traffic composition (%) Average St. dev Section-I CS 69.1 11.2 31 CB 70.2 11.3 7 2W 51.3 10.7 46 3W 42.7 7.6 5 HV 46.9 9.2 11 Section-II CS 65.3 15.1 11 CB 66 14.1 10 2W 52.1 13.1 43 3W 39.5 8.8 22 HV 47.2 8.5 14
5 Simulation analysis
Microscopic traffic flow simulation model VISSIM has been used in the present analysis to perform simulation analysis. VISSIM is a microscopic, time step and behaviour based simulation model developed to model freeways, urban traffic, and public transit operations. It performs tra -jectory-based analysis that utilizes psycho-physical driver behaviour developed by Wiedemann. The model is devel-oped in Germany and contains certain specific parameters which need to be checked before performing simulation analysis. Simulation analysis was performed in present study using the data collected on two different sections in the field. Field data collected on section-I was used for development of the base model network in VISSIM and model calibration. Whereas, field data collected on sec -tion-II was used for validation of the model.
For the development of the base model, a straight link of 1.4 km was created in VISSIM where only 1.0 km of the center part was considered for data analysis and 0.2 km length on either side of the stretch was considered as buffer link. The link was created with two lanes of 3.5 m width and shoulder lane of 1.5 m. To measure the simulated speed a section of 50 m was created at the appropriate distance away from the point of vehicle input. The lateral and over-taking behaviours in VISSIM were modified as per left sided rule to truly replicate the non-lane based traffic condi -tions. Primarily, the model was run based on its default set-ting of parameters with basic field input data such as desired speed of each vehicle types and volume in veh/hr as per field observation. The simulation data was extracted for one hr and output was compared with the field data. The com -parison was made on the basis of field traffic volume and speed distribution profile of vehicles. The comparison of traffic volume and speed profile of one of the vehicle types is depicted in Fig. 2. Field traffic volume obtained at 5 min interval was compared with simulated volume at the same interval. Simulation output based on the default parameters settings has resulted in large differences between the field data, and it can be inferred that the VISSIM at default values of parameters not able to reflect field traffic flow behaviour. Therefore, model required the fine-tuning of volume and
speed related parameters to obtain the minimum difference in a field and simulated outputs.
6 Calibration of VISSIM
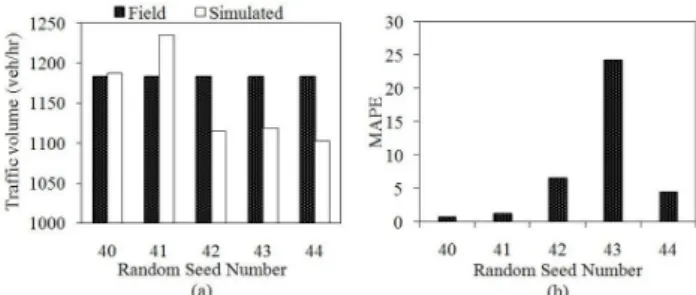
It has been observed from the review of literature that VISSIM consist of some simulation parameters which have the direct influence on traffic flow, speed and capa -city (Chitturi and Benekohal, 2008). VISSIM works based on car-following driver behaviour model developed by Widemnann. Some of the parameters have been found to be influential at capacity, and some of them affect the beha -viour of the driver only under car-following situations. Apart from driving behaviour model, VISSIM consists of simulation parameter such as Random Seed number (RSN). The default value of RSN parameter is 42 and any change in RSN values significantly affect the distribution of vehicle generation into the network or in other words; it changes the inter-arrival time of vehicles. Therefore, it was decided to observe the change in RSN value on traf -fic volume measurement at a point on a four-lane divided section. Five different values of RSN were chosen (40, 41, 42, 43, 44) and simulation was performed using field data inputs. The traffic volume found to be varied at different RSN and Mean absolute percentage error (MAPE) were calculated to compare simulated and field traffic volume for entire 4 hrs. The RSN values 41, 42, 43 and 44 have shown the large value of MAPE in compared to 40, and therefore, the value with least absolute percentage error was selected for further analysis. The comparison of simu-lated and field traffic volume and its MAPE estimated at different RSN values are shown in Fig. 3 (a) and (b).
The present study is further targeted to the estimation of capacity by developing speed-flow diagram. Among ten different driver behaviour parameters (CC0 to CC9) given in Wiedemann Model 99 only two of them namely; CC0 (standstill distance) and CC1 (time headway) are found to be significant as the traffic flow reaches to capa -city (Mehar et al., 2013). These are the two parameters
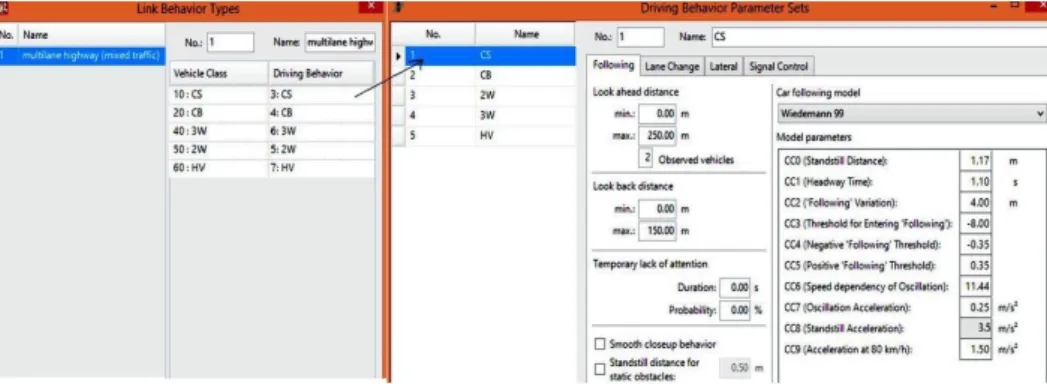
which govern the safety distance between the vehicles in the simulation model. Default values of CC0 and CC1 parameters are 1.5 m and 0.9 sec respectively. Capacity obtained from default values of these two parameters may not be reliable unless calibration is performed using field data. The present study refers to the previous simulation study performed by Mehar et al. (2014) under mixed traffic on the calibration of VISSIM parameters influencing the capacity of four-lane divided highway. The outcome of the calibration was based on the sensitivity analysis perfor-med by considering multiple parameter analysis. Authors calibrated the parameters for homogeneous vehicle type traffic situations such as ‘All CS’, ‘ All CB’, ‘All 2W’, ‘All 3W’, ‘All HV’ and suggested appropriate values of CC1 and CC0. The present study uses the values of CC0 and CC1 parameters suggested by Mehar et al. (2014) for simu -lating ‘All CS’ type traffic situation in VISSIM to obtain capacity and to quantify a number of lane changes on four-lane, six-four-lane, and eight-lane divided highway sections. The calibrated values of CC0 and CC1 parameters are shown in Table 2. The values of CC0 and CC1 parameters were given as input to driver behavior model by creating separate driving behavior set for each vehicle types and kept all the other parameters as default (CC2 to CC9). The input values of vehicle type driving behavior parameter sets along with new link behavior type are shown in Fig. 4.
Speed-flow curve developed through simulation gives a capacity value of four-lane divided road as 5334 PCU/hr/ dir with paved shoulders. Fig. 5 shows the comparison of speed-flow curves from a field and simulated data. Capacity determined through simulation was also compared with field capacity (5267 PCU/hr/dir) and the difference between the two capacity values is found as 1.25%. It can be inferred that the calibration of VISSIM model parameters have been performed successfully as the model can reflect field capac -ity under an acceptable range of error (less than 5%).
7 Validation
Validation of the VISSIM parameters was performed using another set of field data collected on a four-lane divided inter-urban highway with partially access control having paved shoulders. The speed and traffic composi -tion of this sec-tion have been provided in Table 1. Speed and traffic volume data collected in the field are given as basic input to VISSIM.
The field and simulated average speed of each vehi -cle types were also compared for validation by estimating Root Mean Square Error (RMSE) of average speeds. The RMSE value was estimated as 2.07 which is also consid -ered as satisfactory. The comparison for average speed data of field and simulated for each vehicle type is shown in Fig. 6. Simulated traffic volume output was also com -pared with the field volume which has shown only 5 % absolute percentage error.
Mean absolute percentage error (MAPE) was estimated to compare simulated and field observed speed distribu -tion parameters and the results were found under the sat-isfactory limit. Simulated speed distribution profiles were also created for each vehicle type and compared with the profiles developed with field speed data. The comparison is shown in Fig. 7.
Table 2 VISSIM parameters for homogeneous traffic stream
Homogeneous vehicle
type Simulated capacity (veh/hr)
Calibrated values CC0 (m) CC1 (sec) CS 4950 1.17 1.1 CB 3385 1.5 1.4 2W 9540 0.3 0.3 3W 2950 1.5 0.9 HV 1245 2.4 1.7
8 Analysis of lane change
Lane change behaviour of vehicles represents the macro-scopic traffic flow behaviour and influences the operational characteristics on the highway very substantially. Lane changing is sometimes necessary for overtaking and cross-ing a weavcross-ing segment on a roadway. Lane changcross-ing of vehicles creates voids or spaces within traffic streams which tend to increase the stream speeds and capacity. The study analyses lane change the behaviour of vehicles on the multi-lane highway using microscopic simulation model VISSIM. To quantify a number of lane changes, VISSIM was run with homogeneous type traffic situations on the four-lane divided road, in one direction of travel (two-lanes, 3.5 m per lane width). ‘All CS’ traffic stream was simulated in VISSIM with input values of CC0 and CC1 as suggested in Table 2. Traffic volume input was also varied from low to higher levels and simulation runs were performed for 2 hrs. Lane change data was extracted from the output file at 10 min interval. Traffic volume and speed data also extracted from the same output file, and similar exercise was performed for six-lane and eight-lane divided section.
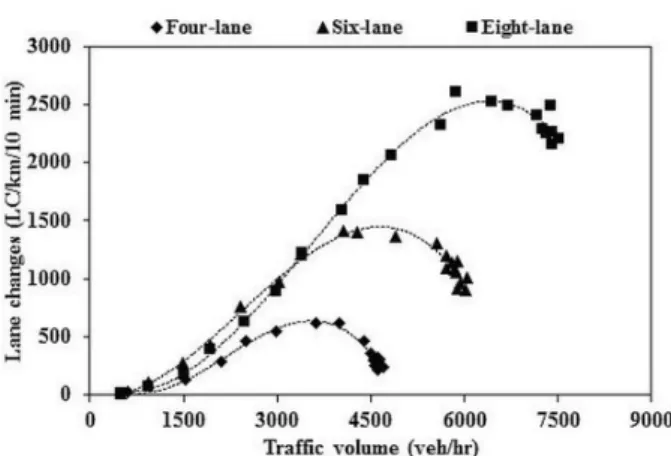
Fig. 8 shows the number of the lane change in one direction of travel on four-lane, six-lane and eight-lane
simulated divided sections at different volume levels. The relationships presented above are also providing the idea of finding a maximum possible number of lane changes on each type of highway section. The third-degree polyno-mial curve was found to be the best fit for lane change data when it correlated with traffic volume. A maximum num -ber of lane changes on four-lane, six-lane and eight-lane divided highway sections were quantified by observing the peak of the fitted curve. Traffic flow and speed data were analyzed, and speed-volume curve developed for each type of highway section to determine capacity. For exam -ple, the speed-volume curve for “All CS” type traffic flow on the six-lane divided highway is shown, with a num -ber of lane changes in Fig. 9. Simulated capacity (maxi -mum volume) on four-lane, six-lane and eight-lane divided highways was determined under ‘All CS’ type traffic sit -uation. The number of lane changes on each highway sec-tion at the capacity level of the volume is also estimated. The estimated values of a number of lane changes at sim-ulated capacity values are given for four-lane, six-lane and eight-lane divided sections in Table 3. It is observed that the number of lane changes restricted at a capacity level of volume and no more lane changes are observed beyond Fig. 5 Speed-flow curves from field and simulated data
Fig. 7 Comparison of simulated and field speed cumulative frequency profiles
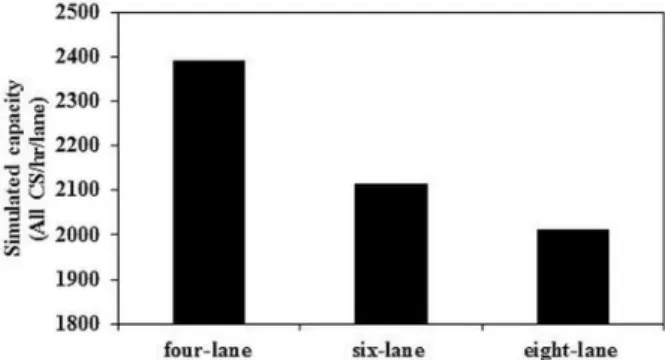
Fig. 10 Capacity per lane on different simulated sections
capacity. The phenomenon happens due to the reason that the drivers feel difficulty in finding space or lane and tends to follow others vehicles on the same lane when the volume reaches to capacity. An interesting phenomenon is also observed when the number of lanes increased, total capacity also increased (regardless of lanes), but it found to be decreased when estimated per lane basis. It can be inferred that as a number of lanes increase the frequency of lane change also increases and hence it affects the per lane capacity. The capacity per lane for a different simu-lated section is shown in Fig. 10.
9 Conclusions
Traffic flow and speed data collected at four-lane divided highway sections are analyzed to estimate capacity. The estimated capacity of four-lane divided highway with paved shoulders was found as 5267 PCU/hr/dir. Traffic data obtained from the field was used as input for the development of base network model in VISSIM. The fine-tuning of VISSIM desired speed distribution param -eters and RSN was performed using field data. The mar -ginal variation in traffic volume was found with different RSN values. RSN value as 40 was decided to keep for fur -ther simulation analysis as it was giving the least error. A separate link behavior type was created in the model and inputs for driving behavior parameters such CC0 and CC1 were given separately for each vehicle types. Simulated capacity based on field data inputs determined as close as
to field capacity. The difference between the capacity was only 1.25 percent. Validation of VISSIM model was also performed with the different set of field data by taking speed and volume as the measure of effectiveness.
VISSIM was further run with calibrated link network to quantify a number of lane changes. The simulation runs were performed with homogeneous vehicle type sit-uation such as ‘All CS’ and with a different number of lanes. The number of lane changes estimated on varying number of lanes showed correlation with traffic volume. Third-degree parabola found as best fit for presenting lane change behavior under lower to higher volume levels. It was observed that the number of lane changes increased with volume to some extent but further decreased at higher volume level. But no significant change in lane changes has been observed between six-lane and eight-lane divided sections when traffic volume is less than 3500 All CS/hr. The value of maximum lane changes was also estimated in case of four-lane, six-lane and eight-lane divided sec -tions. The number of lane changes is found to be stag-nating when traffic volume reaches capacity. At capacity, the opportunity of the lane change is restricted due to the availability of less free space. Even very small numbers of forced lane change maneuvers may be caused sudden breakdown of flow which led to the unstable condition. It has been observed that the number of lane changes increases with a number of lanes. Still, the capacity of a roadway estimated as per lane is found to decrease with increase in a number of lanes. It is true that the addition of a lane will provide more opportunity to the vehicles to change lanes but the same times causes a reduction in traf-fic stream speed under non-lane disciple which results in a reduction of per lane capacity. In future, the lane change behaviour will be analyzed under mixed traffic situation to observe its effect on the capacity of multilane highways. Fig. 9 Lane change and capacity curves on six-lane divided section
Table 3 Number of lane changes on multilane highways Highway
type (All CS/hr)Capacity capacity (LC/km/hr)Lane changes at change (LC/km/hr)Maximum lane
Four-lane 4800 1860 3600
Six-lane 6042 6013 8484
References
Chandra, S., Kumar, U. (2003) "Effect of lane width on capacity under mixed traffic conditions in India", Journal of Transportation Engineering, ASCE, 129, pp. 155–160.
https://doi.org/10.1061/(ASCE)0733-947X(2003)129:2(155)
Chitturi, M. V., Benekohal, R. F. (2008) "Calibration of VISSIM for the freeway", In: Proceeding of 87th TRB Annual Meeting, TRB, National Research Council, Washington D.C., pp. 1–10.
Greenshields, B. D. (1934) "A study of traffic capacity", Proceeding of Highway Research Record Board, 14, pp. 448–477.
Highway Capacity Manual (2010) "Transportation Research Board of the National Academies", 5th ed., Vol. 2, Washington DC., USA. Hoban, C. J. (1987) "Evaluating traffic capacity and improve
-ments to road geometry", The World Bank Technical Paper
Number 74, Washington D. C. [online] Available at: http://doc
-uments.worldbank.org/curated/en/616111468184147999/pdf/
WTP74000Proced0nts0to0road0geometry.pdf [Accessed: 02 September 2016]
Indonesian Highway Capacity Manual (IHCM), Directorate General, Bina Marga, Republic Indonesia (1997) [online] Available at: www.
ajisuraji/wp-content/uploads/2011/12/IHCM-1997-Indonesian-Highway-Capacity-Manual.pdf [Accessed: 05 September 2016] Laval, J. A., Leclercq, L. (2008) "Microscopic modeling of the relax
-ation phenomenon using a macroscopic lane-changing model", Transportation Research Part B: Methodological, 42(6), pp. 511–522.
https://doi.org/10.1016/j.trb.2007.10.004
Jin, W. L. (2010) "Macroscopic characteristics of lane-changing traffic",
Transportation Research Record: Journal of the Transportation
Research Board, 2188, pp. 55–63.
https://doi.org/10.3141/2188-07
Knoop, V. L., Hoogendoorn, S. P., Yasuhiro, S., Buisson, C. (2012) "Quantifying the number of lane changes in traffic: empiri
-cal analysis", Transportation Research Records, Journal of the Transportation Research Board. 2278, pp. 31–41.
https://doi.org/10.3141/2278-04
Mehar, A., Chandra, S., Velmurugan, S. (2013) "Passenger car units
at different levels-of-service for capacity analysis of multilane
divided highways", ASCE, Journal of Transportation Engineering, 140(1), pp. 81–88.
https://doi.org/10.1061/(ASCE)TE.1943-5436.0000615
Mehar, A., Chandra, S., Velmurugan, S. (2014) "Highway capacity through VISSIM calibrated for mixed traffic conditions", KSCE Journal of Civil Engineering, 18(2), pp. 639–645.
https://doi.org/10.1007/s12205-014-0440-3
Menneni, S., Sun, C., Vortisch, P. (2008) "Microsimulation calibration using speed-flow relationships", Transportation Research Record: Journal of the Transportation Research Board, 2088, pp. 1–9.
https://doi.org/10.3141/2088-01
Park, B. B., Won, J. (2006) "Simulation model calibration and validation: Phase II: Development of implementation handbook", [online]
Available at: http://www.virginiadot.org/vtrc/main/online_ reports/pdf/07-cr5.pdf [Accessed: 01 September 2016]
Park, B. B., Kwak, J. (2011) "Calibration and validation of TRANSIMS micro simulator for an urban arterial network", KSCE Journal of Civil Engineering, KSCE, 15(6), pp. 1091–1100.
https://doi.org/10.1007/s12205-011-1002-6
Sinha, S., Taneerananon, P., Chandra, S. (2012) "A comparative study of
effect of motorcycle volume on capacity of four-lane urban roads in
India and Thailand", Journal of Eastern Society of Transportation and Traffic Studies(JSTS), 3(4), pp. 52–62.
Shukla, S., Chandra, S. (2011) "Simulation of mixed traffic flow on four-lane divided highways", Journal of the Indian Roads Congress, 72(1), pp. 55–69.
Tanaboriboon, Y., Aryal, R. (1990) "Effect of vehicle size on highway capacity in Thailand", Journal of Transportation Engineering, 116(5), pp. 658–666.
https://doi.org/10.1061/(ASCE)0733-947X(1990)116:5(658)
Velmurugan, S., Errampalli, M., Ravinder, K., Sitaramanjaneyulu, K. (2010) "Critical evaluation of roadway capacity of multilane high-speed corridors under heterogeneous traffic condition through traditional and microscopic simulation model", Journal of Indian Roads Congress, 566, pp. 235–264. [online] Available at: http://
www.crridom.gov.in/sites/default/files/irc-paper-no.566-paper-given-bihar-pwd-medal-by-irc.pdf [Accessed: 01 September 2016] Yang, X., Zhang, N. (2005) "The marginal decrease of lane capacity
with the number of lanes on highway", Proceeding of International Conference of Eastern Asia Society for Transportation Studies (EASTS), 5, pp. 739–749. [online] Available at: http://www.easts. info/on-line/proceedings_05/739.pdf [Accessed: 02 September 2016]