O R I G I N A L A R T I C L E
Open Access
Stigmatization and racial selection after
September 11, 2001: self-identity among Arab
and Islamic Americans
Patrick L Mason
*and Andrew Matella
* Correspondence:[email protected]
Department of Economics, 266 Bellamy Building, Florida State University, Tallahassee, FL 32306-2180, USA
Abstract
During the 2000s Arab and Islamic American racial identity selection was subjected to an exogenous racializing event, viz., public and private reaction to the Al Qaeda attacks of September 11, 2001. The Al Qaeda attacks clearly demarcate a period in which there was a structural increase in the intensity of US stigmatization of persons with Islamic religious affiliation and Arab ethnicity. This stigmatization created an exogenous reduction in the expected payoff to acculturation relative to non-acculturation. This paper uses self-identification as white as its measure of acculturation and the fraction of all hate crimes directed at Muslims as its measure of stigmatization after 9/11. Comparing 2002–2012 to 1996–2001, there is a statistically significant and substantively large decrease in the unconditional and conditional probabilities that Arab and Islamic Americans will self-identify as white. The data are combined cross sections of the Current Population Survey Annual Social and Economic Supplement.
Jel codes:J11, J15, Z13
Keywords:Race; Identity; Arab; Muslim; Islam; September 11
1. Introduction
Economists have long known that racial identity, whether self-selected or assigned, is a statistically significant and substantively large explanatory variable for a wide variety of social and economic outcomes. A strong consensus has emerged among modern evolutionary biologists that human racial categories represent a social construct, not a biological datum (Lewontin 2006; Graves 2006). Biologists have no objective means for assigning various human populations to discrete racial groups. Social dominance creates different environmental conditions for the emergence and persistence of socially constructed races in America (Graves 2006). Consequently, for empirical econo-mists, race is an important explanatory variable in regression models of social outcomes; yet, the empirical insights from evolutionary biology are that race is also a dependent variable.
An empirical examination of recent changes in racial self-identity among Arab and Islamic Americans presents an opportunity to address this empirical challenge. Arab and Islamic Americans are overlapping and diverse populations. There are of 3.5 million Arab Americans, with ancestral origins in all 22 Arab countries (Arab American 2014). Sixty
percent are Christians, 24% are Muslims, 13% other religions, and the rest are unaffiliated. Eighty percent of Arabs are citizens and 40% are college educated. Arab Americans are relatively affluent, with a mean income 22% above the national average. There
are 2–7 million Muslim Americans (Lipka 2014; U.S. Department of State 2014).
They represent the most racially diverse religious group in the America. No single racial or ethnic identity applies to more than 30% of the Muslim American population. Most (63%) are first generation immigrants, coming from at least 77 different countries. Eighty-one percent are citizens. African American Muslims, that is, adherents to the Islamic faith whose cultural roots extend back to American slavery, are variously consid-ered to be one-fifth to one-third of the total for all Muslim Americans (U.S. Department of State 2014). Muslims represent the fastest growing segment of the Arab population. Muslim American education and income are close to the national average: 24% have college degrees and median income is about $50,000.
Excluding African American Muslims and focusing solely on persons with ancestral origins in predominately Muslim countries, the US Arab and Islamic populations have a high percentage of first and second generation immigrants seeking to integrate into and acculturate into the American society. An important element of their acculturation involves negotiating the white-black racial identity norm that is everywhere present in American society. For this study, America’s Arab and Islamic population consists of a heterogeneous group of people whose ancestral origins are mostly Northern Africa and Western Asia, but who also include sub-groups from Europe, sub-Saharan Africa, Cen-tral Asia, and Eastern Asia. Some are ethnic Arabs, but many are not. For example, most of the people of Iran are ethnic Persians. Some Arab and Islamic Americans have very dark skin shade, for example, North Africans and Pakistanis, but many much less so. Despite differences in ethnicity, nativity, skin shade, and religion, all persons of
North African and West Asian ancestry are classified as “white” in the US Census
(Office of Management and Budget 1997). Further, all are subject to anti-Muslim and
anti-Arab stereotypes – even those who are neither Arab nor Muslim. But, many
members of this population do not self-identify as white and recent historical events may have had a substantial effect on racial self-identity.
During the 2000s Arab and Islamic American racial identity was subjected to three sets of large scale racializing events: 1) the public and private reaction to the Al Qaeda attacks of September 11, 2001 (“9/11”); 2) the US invasion of Iraq during March 19, 2003 –May 1, 2003, the controversial war that followed, and its discussion in the 2004 elections; and, 3) the racially charged US presidential election of 2008, where an African American Christian with a Muslim father and an Islamic name was elected President of the United States, as well as the congressional election of 2010. The Al Qaeda attacks were the initial exogenous events, clearly demarcating a period whereby there was a structural increase in the intensity of US stigmatization of persons with Islamic religious affiliation and Arab ethnicity. The political events of 2003–2004 and
2008–2010 reinforced the stigmatization ushered in after 9/11. This stigmatization
The post-9/11 events are a natural experiment that corresponds closely to an exogen-ous reduction in the public’s willingness to accept Arab and Islamic acculturation into US society. This paper tests whether these racializing events altered the distribution of racial identities among Arab and Islamic Americans. We use nearly two decades of
cross-sectional microdata (1996–2012) from the March Supplement to the Current
Population Survey. Hence, we are able to examine Arab and Islamic racial self-identification for a substantial period before and after the epochal events of September 11, 2001. Respondent and parental nativity variables allow easy identification of a large
sample of 1st and 2nd generation Americans. Although we cannot completely identify
3rdand higher generation Arab and Islamic Americans, language usage, religion, or skin shade, we do find that our results are robust with respect to ancestral origin. Separating
the sample according to the timing of racializing events and comparing 2002–2012 to
1996–2001, there is a statistically significant decrease in the unconditional and condi-tional probability that Arab and Islamic Americans will self-identify as white.
2. Stigmatization after 9/11
Individuals from Greater Syria were the first major wave of Arab immigrants to the US,
mostly during 1878–1948 (Cainkar 2002a; Majaj 2000). Most of these early Arab
immi-grants were Christian. Assimilation and access to the full set of opportunities available in America required becoming a citizen. At the height of the first wave of Arab immigration into the US (1888–1914), one had to be white to be a citizen (except, freedmen and their descendants). Asians were explicitly excluded from whiteness and, hence, not eligible for citizenship. West Asian immigrants argued that they were Caucasian and therefore white, even if Asian. Through a series of court cases, culminating inGeorge Dow v. United States 1915,Syrians were legally declared white.
Prior to the creation of Israel in 1948 neither national politics nor foreign affairs had much effect on Arab integration into American society. After that, Arabs in the US
were subjected to “political and legal discrimination and monitoring, both by the US
government and by private groups (Akram 2002:90).” Nevertheless, Arab immigrants
did not develop strong ethnic institutions until the late 1960s and early 1970s. So, although the political concerns surrounding American foreign policies did shape Arab
and Muslim integration into American society during 1948–1972, Arabs and Muslims
were able to integrate into American society and acculturate into white racial identity.
During the period from 1972 – September 11, 2001, domestic American politics
combined with foreign affairs to redefine the identities of Arab and Islamic immigrants away from their ancestral origins and more toward globalized Pan-Arab, Pan-Muslim, or “Middleastern” identity. But, the shift from ancestral identities toward globalized identities did not affect racial self-identification as white.
Post-September 11, 2001
acculturation strategy (Darity, Mason, Stewart, 2006). Further, when the precipitating cause of a racializing event is unanticipated, such as the attacks of September 11, 2001, the ex post stigmatization is a natural experiment, exogenous to the evolutionary process of racial identity selection.
Arab and Muslim Americans were subject to substantial stigmatization post-9/11. Among other areas of American life, this stigmatization occurred in federal public policies, social interactions across the country, and labor market treatment. For example, the federal public policy response to the Al Qaeda attacks involved an invasive set of government policies specifically targeting Arabs and Muslims.
In reference to the period immediately following September 11, 2001, Cainkar (2002a) writes that,“Of the roughly 20 rule changes, executive orders and laws affecting
immigrants or non-immigrant visitors, 15 predominantly target Arabs.” Table 1 lists
some of these policies1. Shortly after the attacks more than 1,200 Muslim and Arab
citizens were detained. Most of these citizens were males of Pakistani and Egyptian ancestry. None were terrorists: 100 were held on minor crimes and 500 were held on im-migration violations. The Imim-migration and Naturalization Service (INS) adopted new rules that would allow the federal government to indefinitely detain non-citizens; those detained were disproportionately Arabs and Muslims.
On November 9, 2001, the DOJ mailed interview requests to 5,000 Arab and Muslim
males, 18 – 33 years of age, who arrived in America after January 2000 on student,
work, or tourist visas. These were nominally voluntary interviews. Most recipients complied: 5 people declined to be interviewed, 104 letters returned because of incor-rect addresses. None of the interviews supplied information on the September 11 at-tacks. The same month the US Department of State slowed the visa process for males
ages 16 – 45 from Arab and Muslim countries. Further, the INS engaged in mass
Table 1 Selected post-September 11, 2001 federal policies targeting Arab and Islamic Americans
Date Policy or action
Within weeks of September 11, 2001 1,200+ Muslim and Arab citizens were arrested and detained.
September 20, 2001 New rule allowing INS to indefinitely detain non-citizens
November 9, 2001 DOJ“issued guidelines for“voluntary”interviews of non-citizen men in the US on nonimmigrant visas from countries suspected of harboring terrorists”(all Arab or Muslim).
November 2001 State department announced it had slowed the process for granting visas to men ages 16–45 from certain Arab and Muslim countries
November 2001 INS announced mass arrests of nonimmigrant students who had violated terms of their visas
National origins of students included only Iran, Syria, Pakistan, Libya, Saudi Arabia, Afghanistan, and Yemen
December 5, 2001 DOJ directs INS round up 6,000“young Arab men”who had ignored deportation orders.
March 20, 2002 DOJ announces plans to interview another 3,000 Arab and Muslim men for“voluntary”interviews. Men are ages 18–33 who have entered the US since September 11, 2001.
August 12, 2002 The fingerprinting and registry initiative announced for persons from select Arab and Muslim countries (Cainkar, 2002a).
On May 26, 2004 Attorney General John Ashcroft and FBI Director Robert Mueller announced that the FBI would launch a new round of nationwide interviews in Muslim communities (American Civil Liberties Union, 2004).
arrests of students who had violated the terms of their visas; all of these students were from Iran, Syria, Pakistan, Libya, Saudi Arabia, Afghanistan, and Yemen.
By the first week of December 2001 the DOJ was once again rounding up young Arab
and Muslim males for deportation. Specifically, INS rounded up 6,000“Arab men”who
had ignored deportation orders. During Spring 2002 the DOJ started “voluntary”
interviews of another 3,000 Arab and Muslim males. These men were 18–33 years of
age and had entered the US after the attacks of September 11, 2001.
Cainkar (2002a) reports that on August 12, 2002 the DOJ finalized plans requiring thousands of visitors from predominately Muslim nations to provide fingerprints to the US government upon arrival in the country and to register with INS after 30 days. Otherwise lawful visitors who failed to provide fingerprints or to register with the INS could be fined or deported.
During Spring 2004 the Federal Bureau of Investigation (FBI) once again decided to
round up Arabs and Muslims for “voluntary” interviews. On May 28 it was revealed
that the Justice Department had targeted 5,000 Muslims and Arabs for questioning, questioning based on religion and ethnicity, and not on individualized criminal suspicion (American Civil Liberties Union 2004).
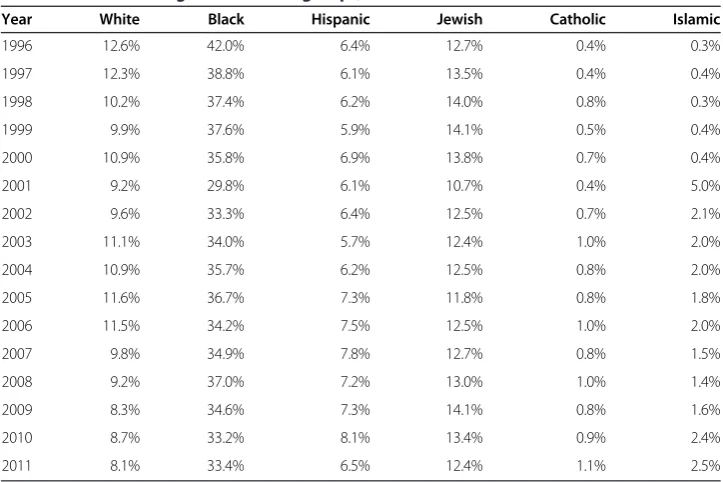
The social interaction response to the Al Qaeda attacks involved nationwide violence against Arabs and Muslims. The FBI records hate crimes by race, ethnicity/national origin (principally, Hispanic or Non-Hispanic), religion, sexual orientation, and disability status. Table 2 presents total hate crimes by year, 1996 – 2011, as well as hate crimes against selected groups: whites, blacks, Hispanics, Jews, Catholics, and Muslims2. The FBI does not record hate crimes against Arabs, Sikhs, Hindus, or others that Americans often mistake for Arabs or Muslims. Hence, the hate crimes recorded in Table 2 under-represent the extent of hate crimes directed at Arab and Islamic Americans.
Table 2 Hate crimes against selected groups, 1996-2011
Year White Black Hispanic Jewish Catholic Islamic
1996 12.6% 42.0% 6.4% 12.7% 0.4% 0.3%
1997 12.3% 38.8% 6.1% 13.5% 0.4% 0.4%
1998 10.2% 37.4% 6.2% 14.0% 0.8% 0.3%
1999 9.9% 37.6% 5.9% 14.1% 0.5% 0.4%
2000 10.9% 35.8% 6.9% 13.8% 0.7% 0.4%
2001 9.2% 29.8% 6.1% 10.7% 0.4% 5.0%
2002 9.6% 33.3% 6.4% 12.5% 0.7% 2.1%
2003 11.1% 34.0% 5.7% 12.4% 1.0% 2.0%
2004 10.9% 35.7% 6.2% 12.5% 0.8% 2.0%
2005 11.6% 36.7% 7.3% 11.8% 0.8% 1.8%
2006 11.5% 34.2% 7.5% 12.5% 1.0% 2.0%
2007 9.8% 34.9% 7.8% 12.7% 0.8% 1.5%
2008 9.2% 37.0% 7.2% 13.0% 1.0% 1.4%
2009 8.3% 34.6% 7.3% 14.1% 0.8% 1.6%
2010 8.7% 33.2% 8.1% 13.4% 0.9% 2.4%
2011 8.1% 33.4% 6.5% 12.4% 1.1% 2.5%
During 1996 – 2011 hate crimes more or less consistently trended downward for whites and blacks. Hate crimes against whites were 12.64% of all hate crimes in 1996 and 8.11% of all hate crimes in 2011, with total hate crimes against whites dropping from 1106 to 504. Similarly, hate crimes against African Americans decreased from 42% of all hate crimes to 33% of all hate crimes, with total hate crimes dropping from 3674 to 2076. For blacks and whites, there were only very minor increases in hate crimes between 2000 and 2001; in each case, the percentage relative to the total declined. Hate crimes against Jews have more or less remained constant during
1996 – 2011, staying near 12 – 13% of the annual total but declining from 14% of
the total in 2000 to 11% during 2001. Hate crimes against Hispanics and Catholics followed a similar pattern; indeed, hate crimes against Catholics fell from 0.70% of the total in 2000 to 0.39% in 2001.
By contrast, anti-Islamic hate crimes sky-rocketed in 2001 and have remained high ever since. During 1996–2000, anti-Islamic hate crimes were about 1/3 of 1% of all hate crimes. But, for the year 2001 this number rose to nearly 5%. Total anti-Islamic hate crimes rose from nearly 30 per year to 481 for 2001. Anti-Islamic hate crimes declined from 4.95% of the total in 2001 to 2.08% in 2002, but anti-Islamic hate crimes have shown no signs of returning to pre-9/11 levels.
Post-9/11, there has been an increase in labor market discrimination against Arabs, Muslims, and persons of Middle-Eastern descent, especially during the years immedi-ately following the attacks. Davila and Mora (2005) examine the earnings of men in the
US, ages 25–40 with ancestral origins in Arab countries, as well as Afghanistan,
Pakistan, and Iran. All men included in their sample worked at least 20 hours per week and at least 32 weeks per year. The earnings of the Arab and Islamic American males are compared to the earnings of US born Non-Hispanic white males. Comparing the change in relative earnings between 2000 and 2002, they find that the Middle Eastern Arab earnings differential moves from−0.152 log points for 2000 to−0.584 log points for 2002, a statistically significant and substantively large decline of 0.432 log points. The African Arab differential is −0.436 log points for 2000 and −0.484 log points for 2002, a statistically insignificant and small decline of 0.048 log points. The Other (Afghanistan, Pakistan, and Iran) differential is −0.139 log points for 2000 and−0.429 log points for 2002, a statistically significant and substantively large decline of 0.290 log points. Further, Davila and Mora report that a state’s Arab population density had no statistically significant effect on Middle Eastern Arab earnings differential in 2000, but it did have a statistically significant and substantively large effect in 2002. Arab concen-tration had no statistically significant effect on either the African Arab coefficient or the Other coefficient. Finally, Davila and Mora find that the male earnings decline was “fairly symmetrical for workers”at all deciles of the earnings distribution.
For their sample of males 21–54 years of age, Kaushal et al. (2007) find no stigmitization effect for male employment or hours worked3. However, there is a negative effect for male
log of hourly earnings (9 –12%) and log weekly wages (11–14%). Within the first 12
months after September 11, the male hourly wage and weekly wage effects are negative, significant, and substantively large (9–11%). The effects are of the same magnitudes for 13–24 and 25–36 months after the attack but are not significant. Comparing September 2004 with September 1997, there is a statistically significant weekly wage decline of 9% for men.
Kaushal, et al. report that there are no statistically significant differences in results when the data are restricted to foreign born Arabs and Muslims. However, there are statistically significant different effects when the sample is separated by men living in above median intolerance states (high hate crime incidence) versus living in below me-dian intolerance states (low hate crime incidence). The negative wage effect increases by 11% in high intolerance states, while the weekly earnings effect increases by 13-14%. The wage effect is 6-7% in low intolerance states, while the weekly earnings effect is 7-8%. But, the results for the low intolerance states are not statistically significant.
Kaushal et al. (2007) find that the size and significance of wage effects are robust to using hate crimes per Arab and Muslim population or hate crimes per total population. In states with high hate crimes, September 11 is associated with a 11% reduction in the wages of Arab and Islamic men though it is associated with a 6-9% wage reduction in states with a low incidence of hate crimes. However, the difference in these point estimates is not significant. They also report evidence of a post-9/11 decline in intrastate migration of Arab and Muslim men. Nevertheless, September 11 is not associated with interstate moves from high hate crimes states to low hate crime states.
Gould and Klor (2013) use per capita hate crimes, that is, total hate crimes against Muslims relative to the size of the Arab and Islamic population in a state during a given year, to examine changes in measures of assimilation among the US Arab and Islamic population. Gould and Klor argue that hate crimes increase the cost of assimila-tion, while increasing the return to investing in social capital within an Arab or Islamic American’s own community. These incentives lower rates of assimilation.
Consider inter-marriage as one indicator of assimilation, which is defined as the frac-tion of Arab and Islamic Americans married to someone who does not have ancestral origins in a predominately Muslim country. Gould and Klor find that post-9/11 mean per capita hate crimes reduce Arab and Islamic inter-marriage by 8.3% and 13.1% for men and women, respectively, relative to their respective means in 20004.
Arab and Islamic Americans were less likely to be accepted as white and were less likely to opt for a white identity rather than a non-white identity.
3. The model
Consider the random variable Y = {y1 = 0 (white), y2 = 1 (non-white)}. Per Darity,
Mason, and Stewart (2006), for a sample of Arab and Islamic Americans.
Pr(Y = yj|X) = E(fraction of Arab and Islamic Americans seeking to acculturate into a
white identity[−], fraction of Non-Arab and Non-Islamic American ancestry groups
willing to accept Arab and Islamic acculturation[−], fraction of social interactions with Arab Americans[+], free rider capacity[−], benefits of own-group racial altruism[+],
costs of other-group racial antagonism[−] ) + u = E(X) + u, where the explanatory
variables capture the net effect of in-group altruism and between group antagonism and E(…) is the expected payoff of alternative racial strategies.
We estimate the following reduced form racial identity equation5.
Pr Y ¼ yist ¼ Λðβ0þ β1Ageiþ β2Genderiþ β3Completed Years of Educationi
þX8 p¼1
ArrivalPeriodpγpþ X
k
AncestralGroupkϕkþX s
Statesθs
þδAnti‐Muslim Hate Crimes‐PercentistÞ þ uist
where Λ(…) is a logit specification with self-identification options j = {white (0), non-white(1)} for individual i who resides in state s during period t; “ Ancestral-Groupk,” k = North Africa, sub-Saharan Africa, West Asia, Central Asia, East Asia,
and Europe, a vector of binary variables; “States,” s = 1, …, S is a vector of binary
variables to capture state fixed effects; “ArrivalPeriodp,” p = 1, …, 8, a vector of
binary variables to capture fixed effects of immigrant cohorts arriving in US; and,
“Percent Hate Crimes Against Muslimsst” is the fraction of hate crimes directed
against Muslims in state s during time t.
The arrival periods are Arrived pre-1965, Arrived 1965–1974, Arrived 1975–1981,
Arrived 1982–1991, Arrived 1992–2001, Arrived 2002–2003, Arrived 2004–2007, and
Arrived 2008–2012. The arrival periods are demarcated by business cycles or major
institutional changes. Prior to the Immigration Reform Act of 1965 it was very difficult for persons living in African and Asian countries to legally immigrant to the US. Major recessions occurred during 1975–1975, 1981–1982, 1991–1992, 2001–2002, and the Great Recession that began during the third quarter of 2007. The recessions mark the beginning of a new business cycle. Recessions restructure occupations, industries, finances of governmental units, and public policies and, thus, the US demand for immigrants. Also, these were international recessions that differentially affected national economies and, hence, the supply of immigrants to the US. Immigrants living in the US for a longer period of time have a greater ability to acculturate than more re-cent immigrants; some immigrants from earlier cohorts who failed to acculturate will have left the US.
Our identification strategy takes advantage of intertemporal and interstate variation in the extent of hate crimes against Muslims. Importantly, Gould and Klor (2013) find
that hate crimes against Arab and Islamic Americans after 9/11 are an “exogenous
examine whether the backlash affected the assimilation rate of local Muslim immi-grants (page 20).”
Pre- and post-9/11 changes in the composition of ancestral origin groups are a potential
source of endogeneity bias. Our identification strategy accounts for “compositional
changes”by examining multiple sub-groups. Americans of Arab and Islamic descent are
extremely diverse in terms of racial self-identification. As such, changes in the fraction of Arab and Islamic Americans self-identifying as white or non-white might occur because of changes in the representation of ancestral groups with persons more or less likely to self-identify as white.
Respondents of North African ancestry include persons from Algeria, Egypt, Morocco, and a residual category identified as North Africa. Respondents of West Asian ancestry include persons with origins in Afghanistan, Iran, Iraq, Jordan, Kuwait, Lebanon, Pakistan, Palestinean Territories, Saudi Arabia, Syria, Turkey, Yemen, and a
residual category identified as the “Middle East.” Europe includes individuals with
ancestral origins in Albania and Kosovo. The sub-Saharan sample includes Somalia, Sudan, Senegal, and Sierra Leone. Indonesia and Malaysia are the East Asian countries, while Afghanistan, Pakistan, Bangladesh, and Uzbekistan are the Central Asian countries.
Additionally, we alter the ancestral composition of the sample. At the broadest level, the full sample includes all persons whose national origin is among the Pew
Research Center’s (2011) list of countries with a majority Muslim population:
Afghanistan, Albania, Algeria, Azerbaijan, Bangladesh, Egypt, Indonesia, Iran, Iraq, Jordan, Kosovo, Kuwait, Lebanon, Malaysia, Morocco, Pakistan, Palestinean Territories, Saudi Arabia, Senegal, Sierra Leone, Somalia, Sudan, Syria, Turkey, Uzbekistan, and Yemen6.
Eliminating observations from ancestral groups that were not sampled before 9/11 limits composition bias. So, the “core sample” is limited to persons affiliated with ancestral groups with CPS representation before and after September 11, 2001. Prior to 2002, the March CPS data does not identify individuals with the following ancestral origins: Albania, Algeria, Azerbaijan, Indonesia, Kosovo, Kuwait, Malaysia, Senegal, Sierra Leone, Somali, Sudan, Uzbekistan, and Yemen. Persons from these groups are included in the full sample but not the core sample.
Third, the DOJ special registration program focused on a set of ancestral groups that were to be the subject of special government surveillance and pressure (Cainkar
2002b). These groups would have reduced incentives to acculturate. The“DOJ sample”
is a sub-sample of the core sample and is limited to Afghanistan, Bangladesh, Egypt, Iran, Iraq, Jordan, Libya, Lebanon, Morocco, Oman, Pakistan, Saudi Arabia, and Syria7.
Finally, we also control for compositional bias by separately analyzing native-born and immigrant sub-groups. Regardless of ancestral heritage, native-born persons should be more acculturated than immigrants.
The parameter of interest is δ, which yields the causal effect of a change in the
nation’s racial environment on the extent of acculturation of Arab and Islamic
4. Data and descriptive statistics
The hate crimes data are an extract from the DOJ Uniform Crime Reporting Program’s
master files. The data cover all US hate crime reports for 1994–2011. Hate crime data are separated into pre- and post-9/11 periods. For each state and each period, “ Anti-Muslim Hate Crimes - Percent” includes all the period’s single-bias anti-Muslim hate
crimes divided by the period’s total hate crimes. For 2001, the hate crime rate is
calculated through September 11; hate crimes for the remainder of 2001 are calculated with 2002. The correction for 2001 and 2002 allows us to match the post-9/11 hate crimes data and the post-9/11 racial identity selection. For each state, intertemporal variation in “Anti-Muslim Hate Crimes - Percent”captures pre- and post-9/11 changes in the nation’s racial environment. For each period, interstate variation in“Anti-Muslim Hate Crimes - Percent”capture’s state specific variations in the racial environment.
Hate crime data are merged with data from the 1994 – 2012 Current Population
Survey (CPS) Annual Social and Economic Supplement (ASEC), otherwise known as the March supplement. The CPS is a monthly survey of about 60,000 households (or 110,000 persons) conducted by the Census Bureau for the Bureau of Labor Statistics and is the primary source for labor force statistics in the US. It is a probability sample designed to be representative of the civilian non-institutional population of the US. The CPS sample is redesigned, and a new sample is selected after the decennial census.
The March CPS provides a large annual sample size, information on ancestry, and multiple years of observation prior to September 11, 2001. Starting in 1994 the CPS continuously includes information on the respondent’s nativity and the nativity of the respondent’s parents. These variables identify native-born persons and 1st and 2nd generation immigrants from predominately Muslim countries, our sample of Arab and Islamic Americans. CPS data permit only partial identification of 3rdor higher generation
Arab and Islamic Americans. Zogby (2001) notes that 10% of Arab Americans are 3rdor
4thgeneration Americans, but 90% are 1stor 2ndgeneration immigrants. The data do not permit identification of persons who speak Arabic, or who live in an environment where Arabic is spoken, or the religious affiliation of individuals.
By comparison, the US Census provides a large number of observations but is available only at 10 year intervals. Moreover, the 2010 Census includes only information from the short-form and hence no information on ancestry. Previously, the 2000 Census provided information from both the short and long forms. The long form Census data are the source of the American Community Survey (ACS). Although there have been changes since implementation, the ACS has been an annual survey since 2000. It provides a large number of observations, though only one year of data prior to the Al Qaeda attacks of September 11, 2001.
years of observations after this timeperiod, we get large numbers of observations of Arab and Islamic Americans both before and after the Al Qaeda attacks.
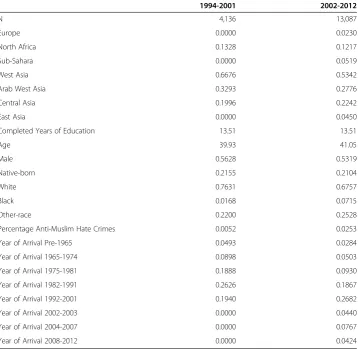
Descriptive statistics are provided in Table 3. Notably, 76% of the sample
self-identified as white during 1994–2001 and 68% self-identified as white during
2002–2012; overall, non-white representation increased from 1/4 to 1/3. Specifically, the percent self-identifying as black and other-race rose from 2% to 7% and from 22% to 25%, respectively. For the pre-9/11 and post-9/11 periods the percentage of all hate crimes that are directed against Muslim Americans increased by an order of five, from 0.52% to 2.53%. About one in five Arab and Islamic Americans are native-born, 68% are immi-grants arriving before or during 2001, and 11% are immiimmi-grants arriving after 2001.
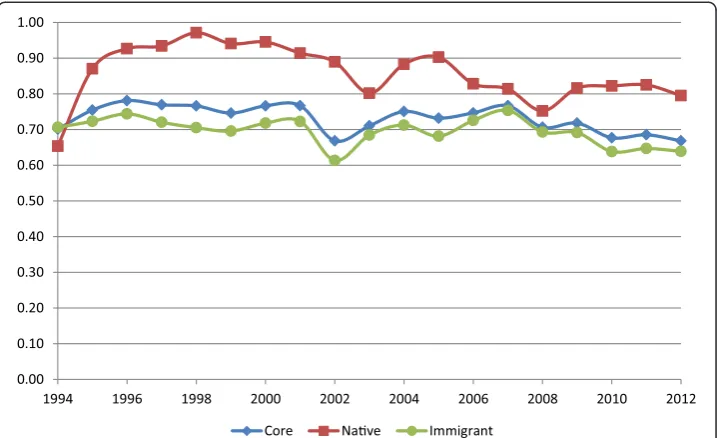
Figure 1 presents the fraction of individuals self-identifying as white by alternative
samples for 1994–2012. There is a strong decrease in the fraction of persons
self-identifying as white between March 2001 and March 2002. For the Core sample, the fraction self-identifying as white declined from 77% to 67%. There was some recovery in the fraction of Arab and Islamic Americans self-identifying as white in the years immediately after 2002; nevertheless, by 2008 a permanently lower level of white identity had set in for most groups. Figure 1 also shows that 1994 and 1995 are outliers for native-born Arab and Islamic Americans8. Native Arab and Islamic Americans are considerably
Table 3 Descriptive Statistics before and after 9/11
1994-2001 2002-2012
N 4,136 13,087
Europe 0.0000 0.0230
North Africa 0.1328 0.1217
Sub-Sahara 0.0000 0.0519
West Asia 0.6676 0.5342
Arab West Asia 0.3293 0.2776
Central Asia 0.1996 0.2242
East Asia 0.0000 0.0450
Completed Years of Education 13.51 13.51
Age 39.93 41.05
Male 0.5628 0.5319
Native-born 0.2155 0.2104
White 0.7631 0.6757
Black 0.0168 0.0715
Other-race 0.2200 0.2528
Percentage Anti-Muslim Hate Crimes 0.0052 0.0253
Year of Arrival Pre-1965 0.0493 0.0284
Year of Arrival 1965-1974 0.0898 0.0503
Year of Arrival 1975-1981 0.1888 0.0930
Year of Arrival 1982-1991 0.2626 0.1867
Year of Arrival 1992-2001 0.1940 0.2682
Year of Arrival 2002-2003 0.0000 0.0440
Year of Arrival 2004-2007 0.0000 0.0767
Year of Arrival 2008-2012 0.0000 0.0424
more likely than immigrant and younger Arab and Islamic Americans to self-identify as white. Interestingly, for native Arab and Islamic Americans the post-9/11 racial environ-ment appears to have deepened a pre-existing trend to reduce self-identification as white. Regardless of sample composition and ancestral origin, racial self-identification is subject to considerable variation between and among Arab and Islamic American ancestral groups.
Among Central Asians white identification declined from 26% to 13% between 2001 and 2002. For North Africans, the decrease was from 90% to 82%. West Asians are a strong majority of the data for all years. This group has a 24 percentage point increase in white self-identification between 1994 and 1996. This is a pure composition effect. For 1994 West Asia includes 125 observations and all are for Iran. West Asia includes 292 observations in 1995, but Iranians are 41% of those observations. From 1996 onward, Iranians are less than 1/3 of the West Asian sample. Accordingly, nearly all of our analysis concentrates on observations from 1996 onward.
5. Results
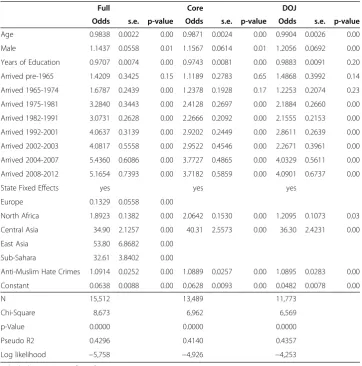
Using the full, core, and DOJ samples, alternative logistic regressions of the racial identity equation are presented in Table 4. All individuals are 15–64 years of age and we use observations for 1996–2012. The results are robust across samples: the odds of selecting a non-white racial identity, that is, self-identifying as either other-race or
black, decrease with education and age, increase by 14–21% for males, increase
considerably for more recent immigrants, and increase for persons of North African, sub-Saharan, East Asian, and Central Asian ancestral origin relative to West Asians. However, the odds that Arab and Islamic Americans of European origin will select a non-white racial identity decline by 87% relative to West Asians.
A one percentage point increase in hate crimes yields a 9% increase in the relative odds that Arab and Islamic Americans will select a non-white racial identity. The
0.00 0.10 0.20 0.30 0.40 0.50 0.60 0.70 0.80 0.90 1.00
1994 1996 1998 2000 2002 2004 2006 2008 2010 2012
Core Nave Immigrant
stability of this coefficient across all three samples suggests that although individuals represented by the DOJ sample were subjected to greater governmental legal activity than other Arab and Islamic Americans, the post-9/11 national environment reduced incentives to acculturate for all Arab and Islamic Americans.
Unobserved “culture effects” represent a potential endogeneity problem. If unobserved cultural effects favoring non-white identity increased after 9/11 then racial identity selection might have changed in response to these unobserved cultural factors rather than a change in the racial environment. If so, our statistical correlation between racial identity selection and anti-Muslim hate crimes contains some degree of spurious correlation.
We check for unobserved cultural bias by restricting our sample to elderly persons, that is, persons age 65 and above. Compared to otherwise identical school-age and working-age persons, elderly persons have a stronger cultural attachment to Arab identity and Islamic religion than their younger counter-parts (Elver 2012). Elderly Arab and Islamic Americans are subjected to the same or higher unobserved cultural influences as younger Arab and Islamic Americans, but elderly persons have much less incentive to change their racial identity selection, to change their behaviors and actions, or to move to another location in response to exogenous changes in the racial environment. Moreover, native-born elderly Arab and Islamic Americans are more invested in the
Table 4 Results about non-white racial identity
Full Core DOJ
Odds s.e. p-value Odds s.e. p-value Odds s.e. p-value
Age 0.9838 0.0022 0.00 0.9871 0.0024 0.00 0.9904 0.0026 0.00
Male 1.1437 0.0558 0.01 1.1567 0.0614 0.01 1.2056 0.0692 0.00
Years of Education 0.9707 0.0074 0.00 0.9743 0.0081 0.00 0.9883 0.0091 0.20
Arrived pre-1965 1.4209 0.3425 0.15 1.1189 0.2783 0.65 1.4868 0.3992 0.14
Arrived 1965-1974 1.6787 0.2439 0.00 1.2378 0.1928 0.17 1.2253 0.2074 0.23
Arrived 1975-1981 3.2840 0.3443 0.00 2.4128 0.2697 0.00 2.1884 0.2660 0.00
Arrived 1982-1991 3.0731 0.2628 0.00 2.2666 0.2092 0.00 2.1555 0.2153 0.00
Arrived 1992-2001 4.0637 0.3139 0.00 2.9202 0.2449 0.00 2.8611 0.2639 0.00
Arrived 2002-2003 4.0817 0.5558 0.00 2.9522 0.4546 0.00 2.2671 0.3961 0.00
Arrived 2004-2007 5.4360 0.6086 0.00 3.7727 0.4865 0.00 4.0329 0.5611 0.00
Arrived 2008-2012 5.1654 0.7393 0.00 3.7182 0.5859 0.00 4.0901 0.6737 0.00
State Fixed Effects yes yes yes
Europe 0.1329 0.0558 0.00
North Africa 1.8923 0.1382 0.00 2.0642 0.1530 0.00 1.2095 0.1073 0.03
Central Asia 34.90 2.1257 0.00 40.31 2.5573 0.00 36.30 2.4231 0.00
East Asia 53.80 6.8682 0.00
Sub-Sahara 32.61 3.8402 0.00
Anti-Muslim Hate Crimes 1.0914 0.0252 0.00 1.0889 0.0257 0.00 1.0895 0.0283 0.00
Constant 0.0638 0.0088 0.00 0.0628 0.0093 0.00 0.0482 0.0078 0.00
N 15,512 13,489 11,773
Chi-Square 8,673 6,962 6,569
p-Value 0.0000 0.0000 0.0000
Pseudo R2 0.4296 0.4140 0.4357
Log likelihood −5,758 −4,926 −4,253
dominant racial identity (white) than either younger or immigrant elderly Arab and Islamic Americans.
Restricting our sample to individuals at least 65 years of age, the logistic odds ratio for anti-Muslim hate crimes is 0.32 with a standard error of 0.30 (p-value = 0.28) for native-born elderly Arab and Islamic Americans9. Moreover, the p-value = 0.53 for the
χ2
statistic of the log-likelihood goodness-of-fit test. Similarly, the logistic odds ratio for anti-Muslim hate crimes is 0.10 with a standard error of 1.28 (p-value = 0.20) for immigrant elderly Arab and Islamic Americans. Hence, in our logistic regression evaluation, for both native-born and immigrant elderly Arab and Islamic Americans, the odds ratio for anti-Muslim hate crimes has the incorrect value (less than 1) and is statistically insignificant. These results are inconsistent with the presence of unobserved cultural effects creating endogeneity bias.
As an additional check for the presence of endogeneity bias resulting from unobserved culture, we use a non-parametric difference-in-difference estimator to derive point estimates for the effect on the change in the post-9/11 national environment on racial self-identification of Arab and Islamic Americans. All Arab and Islamic Americans received the same treatment associated with the Al Qaeda attacks of 9/11, but the treat-ment is likely to be much less effective for the elderly than for working-age and school-age persons. Hence, we treat elderly Arab and Islamic Americans as the control group.
Restricting our analysis to native-born persons at least 65 years of age and the core sam-ple for 1996–2001, all individuals self-identify as white (n = 187). But, for 2002–2012, 0.0223 self-identify as non-white (s.e. = 0.1479, n = 314). For the same group of immigrant Arab and Islamic Americans, 0.1154 self-identify as non-white (s.e. = 0.3202, n = 234) pre-9/11 and 0.2027 self-identify as non-white (s.e. = 0.4022, n = 893) post-9/11. Hence, among native-born elderly Arab and Islamic Americans the post-9/11 increase in non-white racial identity = 0.0223 (t-stat. = 2.67) and among immigrant Arab and Islamic Americans the post-9/11 increase in non-white identity = 0.0873 (t-stat. = 3.51).
Restricting our analysis to native-born working-age and school-age persons, that is, persons 15–64 years of age, and the core sample for 1996–2001, 0.0762 of native-born Arab and Islamic Americans self-identify as white (s.e. = 0.2657, n = 616). Post-9/11 non-white self-identification is 0.2096 (s.e. = 0.4071, n = 2238). For the same group of immi-grant Arab and Islamic Americans, 0.2848 self-identify as white (s.e. = 0.4514, n = 2500) pre-9/11 and 0.3698 self-identify as non-white (s.e. = 0.4828, n = 8294) post-9/11. Hence, among native-born working-age and school-age Arab and Islamic Americans the post-9/11 increase in non-white racial identity = 0.1333 (t-stat. = 9.7), and among immigrant Arab and Islamic Americans the post-9/11 increase in non-white identity = 0.0850 (t-stat. = 8.12).
The point estimates of the difference-in-difference effects for native-born and
immigrant Arab and Islamic Americans are 0.1110 (t-stat. = 6.90) and −0.0023
(t-stat. = 0.09), respectively. Hence, the non-parametric difference-in-difference estimator also suggests a statistically significant increase in post-9/11 non-white racial identification among native-born Arab and Islamic Americans caused by differences in the US racial environment.
acculturation is measured by the fraction of persons selecting a white racial identity.
Changes in the nation’s racial environment are captured by anti-Muslim hate crimes,
which spiked to historical levels after 9/11 and did not return to their pre-2001 levels. The statistically significant relationship between racial identity selection and hate crimes reported in Table 4 controls for composition changes and culture effects, which are potential sources of endogeneity bias that might confound our ability to establish a casual relationship between racial identity selection and hate crimes.
“Immigration bias” is another potential endogeneity problem. Immigration bias is
selection bias arising from changes in the potential racial identity of immigrants arriving after 9/11. Specifically, the nation’s post-9/11 racial environment may not have caused changes in racial identity selection of Arab and Islamic Americans; rather, it may have caused changes in the type of immigrants coming to America–within ancestral groups, encouraging relatively more immigrants who are likely to select a non-white racial identity. Or, post-9/11 changes in the countries of origin–related to or unrelated to the
Al Qaeda attacks on the US–may have changed the type of immigrants arriving in the
US. If immigration bias is a source of spurious correlation, then we should observe no hate crimes effect for native-born persons.
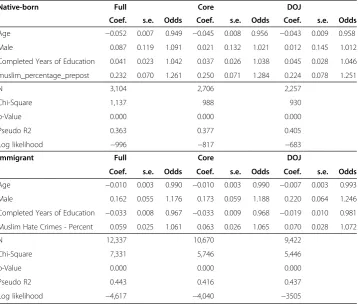
Table 5 presents selected odds ratios when the data are separated for native-born persons and immigrants and separate logistic regressions are estimated for the full, core, and DOJ samples. Figure 1 shows that immigrants are more likely to self-identity as non-white than native-born persons. The statistical results in Table 5 show that changes in acculturation for native-born persons are more sensitive to changes in the post-9/11 racial environment. In particular, a one percentage point increase in
anti-Muslim hate crimes will increase the odds of non-white identity selection by 25–28%
for native-born persons, but 6–7% for immigrants. These results are inconsistent with immigration bias as a source of an endogeneity problem.
As an additional check for immigration bias, we estimate logistic and multi-nomial logit versions of the racial identity equation with a restricted sample of immigrants. Specifically, we use the core sample of immigrants but exclude the elderly and immi-grants arriving on or after 2002. Observations are for 1996–2012. If post-9/11 selective immigration is a source of endogeneity bias, we should not observe a hate crimes effect with this restricted sample of immigrants.
However, differences in the racial identity equation for native-born and immigrant Arab and Islamic Americans are revealed in Table 5. For example, gender effects are greater among immigrants. Relative to females, the odds of a male selecting a
non-white identity increases by 18% (full and core samples)–25% (DOJ sample). Gender is
insignificant for native-born persons. Notably, also, highly educated native-born Arab and Islamic Americans are more likely to select a non-white identity. Sometimes this coefficient has large standard errors. Among immigrants, the odds of selecting a non-white identity decline with completed years of education.
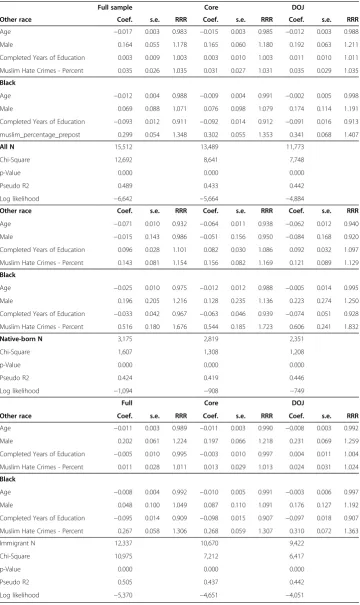
Selective relative risk ratios (RRR) from multinomial logit specifications of the racial identity equation are presented in Table 6. The upper panel use all observations for the full, core, and the DOJ samples. The middle and lower panel use only native-born and immigrant observations, respectively, to estimate each of the equations. For all equa-tions, selecting white is the base outcome with relative risks ratios presented for select-ing other-race or selectselect-ing black.
The relative risk of Arab and Islamic Americans selecting other-race declines with age. Among native-born persons and immigrants, a one year increase in age will reduce the relative risk ratio by 1% and 6%, respectively. The relative risk of selecting black also declines with age, but the effect is small (less than 0.50%) and statistically insignificant in each of the DOJ equations, that is, the equations with the ancestral groups subjected to the most intense governmental actions.
Table 5 Non-white racial identity selection among Arab and Islamic Americans, by nativity, selected coefficients, logistic regression
Native-born Full Core DOJ
Coef. s.e. Odds Coef. s.e. Odds Coef. s.e. Odds
Age −0.052 0.007 0.949 −0.045 0.008 0.956 −0.043 0.009 0.958
Male 0.087 0.119 1.091 0.021 0.132 1.021 0.012 0.145 1.012
Completed Years of Education 0.041 0.023 1.042 0.037 0.026 1.038 0.045 0.028 1.046
muslim_percentage_prepost 0.232 0.070 1.261 0.250 0.071 1.284 0.224 0.078 1.251
N 3,104 2,706 2,257
Chi-Square 1,137 988 930
p-Value 0.000 0.000 0.000
Pseudo R2 0.363 0.377 0.405
Log likelihood −996 −817 −683
Immigrant Full Core DOJ
Coef. s.e. Odds Coef. s.e. Odds Coef. s.e. Odds
Age −0.010 0.003 0.990 −0.010 0.003 0.990 −0.007 0.003 0.993
Male 0.162 0.055 1.176 0.173 0.059 1.188 0.220 0.064 1.246
Completed Years of Education −0.033 0.008 0.967 −0.033 0.009 0.968 −0.019 0.010 0.981
Muslim Hate Crimes - Percent 0.059 0.025 1.061 0.063 0.026 1.065 0.070 0.028 1.072
N 12,337 10,670 9,422
Chi-Square 7,331 5,746 5,446
p-Value 0.000 0.000 0.000
Pseudo R2 0.443 0.416 0.437
Log likelihood −4,617 −4,040 −3505
Table 6 Relative risk ratios of Arab and Islamic American racial identity selection, by nativity, selected coefficients
Full sample Core DOJ
Other race Coef. s.e. RRR Coef. s.e. RRR Coef. s.e. RRR
Age −0.017 0.003 0.983 −0.015 0.003 0.985 −0.012 0.003 0.988
Male 0.164 0.055 1.178 0.165 0.060 1.180 0.192 0.063 1.211
Completed Years of Education 0.003 0.009 1.003 0.003 0.010 1.003 0.011 0.010 1.011
Muslim Hate Crimes - Percent 0.035 0.026 1.035 0.031 0.027 1.031 0.035 0.029 1.035
Black
Age −0.012 0.004 0.988 −0.009 0.004 0.991 −0.002 0.005 0.998
Male 0.069 0.088 1.071 0.076 0.098 1.079 0.174 0.114 1.191
Completed Years of Education −0.093 0.012 0.911 −0.092 0.014 0.912 −0.091 0.016 0.913
muslim_percentage_prepost 0.299 0.054 1.348 0.302 0.055 1.353 0.341 0.068 1.407
All N 15,512 13,489 11,773
Chi-Square 12,692 8,641 7,748
p-Value 0.000 0.000 0.000
Pseudo R2 0.489 0.433 0.442
Log likelihood −6,642 −5,664 −4,884
Other race Coef. s.e. RRR Coef. s.e. RRR Coef. s.e. RRR
Age −0.071 0.010 0.932 −0.064 0.011 0.938 −0.062 0.012 0.940
Male −0.015 0.143 0.986 −0.051 0.156 0.950 −0.084 0.168 0.920
Completed Years of Education 0.096 0.028 1.101 0.082 0.030 1.086 0.092 0.032 1.097
Muslim Hate Crimes - Percent 0.143 0.081 1.154 0.156 0.082 1.169 0.121 0.089 1.129
Black
Age −0.025 0.010 0.975 −0.012 0.012 0.988 −0.005 0.014 0.995
Male 0.196 0.205 1.216 0.128 0.235 1.136 0.223 0.274 1.250
Completed Years of Education −0.033 0.042 0.967 −0.063 0.046 0.939 −0.074 0.051 0.928
Muslim Hate Crimes - Percent 0.516 0.180 1.676 0.544 0.185 1.723 0.606 0.241 1.832
Native-born N 3,175 2,819 2,351
Chi-Square 1,607 1,308 1,208
p-Value 0.000 0.000 0.000
Pseudo R2 0.424 0.419 0.446
Log likelihood −1,094 −908 −749
Full Core DOJ
Other race Coef. s.e. RRR Coef. s.e. RRR Coef. s.e. RRR
Age −0.011 0.003 0.989 −0.011 0.003 0.990 −0.008 0.003 0.992
Male 0.202 0.061 1.224 0.197 0.066 1.218 0.231 0.069 1.259
Completed Years of Education −0.005 0.010 0.995 −0.003 0.010 0.997 0.004 0.011 1.004
Muslim Hate Crimes - Percent 0.011 0.028 1.011 0.013 0.029 1.013 0.024 0.031 1.024
Black
Age −0.008 0.004 0.992 −0.010 0.005 0.991 −0.003 0.006 0.997
Male 0.048 0.100 1.049 0.087 0.110 1.091 0.176 0.127 1.192
Completed Years of Education −0.095 0.014 0.909 −0.098 0.015 0.907 −0.097 0.018 0.907
Muslim Hate Crimes - Percent 0.267 0.058 1.306 0.268 0.059 1.307 0.310 0.072 1.363
Immigrant N 12,337 10,670 9,422
Chi-Square 10,975 7,212 6,417
p-Value 0.000 0.000 0.000
Pseudo R2 0.505 0.437 0.442
Log likelihood −5,370 −4,651 −4,051
Completed years of education has a negative effect on the relative risk of selecting a black racial identity relative to selecting white, though the effect is insignificant for native-born Arab and Islamic Americans and about 9% for immigrants. The relative risk of selecting other-race is not significantly related to completed years of education for immigrants, but rises by 10% for a one year increase in completed years of education of native-born Arab and Islamic Americans.
The relative risk of selecting black are positive and large for both immigrant and native-born males, but the effects are not measured with precision. The relative risk of selecting other-race declines with native-born males, but this coefficient is also
insignificant. The relative risk of male immigrants selecting other-race is 22%–26%
higher relative to female Arab and Islamic immigrants.
A one percentage point increase in anti-Muslim hate crimes has a positive but small
(1%–2%) and insignificant effect for immigrant Arab and Islamic Americans selecting
other-race relative to selecting white. Among native-born persons, this coefficient suggests the relative risk ratio will increase by 13%–17%, though it has a large standard error in the DOJ equation. A one percentage point increase in hate crimes encourages a substantively large and statistically significant increase in the relative risk of Arab and Islamic Americans selecting a black identity. For immigrant and native-born Arab and Islamic Americans the relative risks of selecting a black identity increases by 31%–36% and by 68%–83%, respectively.
Finally, we test for “mobility bias” as a potential endogeneity problem. Specifically, did non-white Arab and Islamic Americans disproportionately relocate to high anti-Muslim hate crimes locations during the post-9/11 period? If so, the changes in Arab and Islamic racial identity selection may not have been caused by changes in the post-9/11 racial environment. The null hypothesis in this case is that controlling for relocation, anti-Muslim hate crimes are not significantly related to Arab and Islamic racial identity selection.
We test for mobility bias by identifying all persons who lived in a different region between adjacent years. The identifiable regions are New England, Middle Atlantic, East North Central, West North Central, South Atlantic, East South Central, West South Central, Mountain, Pacific, and persons who lived abroad during the previous year. Using the core sample for persons 15–64 years of age and for years 1996–2012, we exclude all persons who lived abroad or who lived in a different national region during the previous year for each year after March 2002. Both regional movements and the commission of hate crimes take time; hence, we keep in the sample both movers and stayers for March 2002. The point estimates and associated measures of statistical significance are identical to those presented for each of the logitstic and multinomial regions of Tables 5 and 6, respectively11. Accordingly, the data reject mobility bias as a potential endogeneity problem. This is consistent with Kaushal et al. (2007), who find that post-9/11 intrastate mobility of Arab and Islamic Americans declined by three per-centage points (20%) and that there is no statistical evidence that post-9/11 stigmatization is associated with interstate migration to avoid discrimination.
6. Summary and discussion
during March 19, 2003–May 1, 2003 and the long war that followed and its discussion in the elections of 2004, as well as the racially charged US presidential election of 2008 and the election of 2010 stigmatize Arab ethnicity and Islamic religious affiliation? These racializing events correspond closely to an exogenous reduction in the public’s willingness to accept Arab and Islamic acculturation into US society. This approach to empirically examining racial identity as a dependent variable bypasses endogeneity problems that have not been fully addressed in the previous literature. We used inter-state changes in the percentage of hate crimes targeted at Muslims to identify exogen-ous changes in the post-9/11 racial environment.
This paper finds that these stigmatizing events altered the distribution of racial identities among Arab and Islamic Americans. A one percentage point increase in anti-Muslim hate crimes is associated with a 9% increase in the odds an Arab or Islamic American will self-identify as non-white, that is, either black or other-race. The point estimates for native-born persons and immigrants are 28% and 7%, respectively. The results are robust to multiple potential sources of endogeneity bias: composition effects, immigration bias, unobserved culture effects, and mobility bias.
The results are also qualified in some important ways. Namely, the sample analyzed in this paper included only Arab and Islamic Americans of with ancestral origins in predominately Muslim countries. Also, because the data do not permit complete identification of 3rdor higher generation Arab and Islamic Americans we are unable to determine if our results apply to the most socially integrated Arab and Islamic Americans. Knowing whether there has been a change in the racial self-identity of the most
“Americanized” sub-groups would provide additional important information on the
fluidity of racial identity.
Historically, Americans think of race in terms of a black-white binary classification, based on skin shade and hypo-descent. Persons of Asian descent do fit neatly into this limited classification scheme. Recent research on Arab and Islamic identification suggests that racial categorization may be substantially more complex than envisioned by policy-makers, academics, and the general public.
Finally, the empirical results uncovered in this study hold important implications for the theoretical analysis of racial identity research. Although skin tone is likely an important determinant of racial identity selection among Arab and Islamic Americans,
it is of considerable consequence to note that the racializing events of 2002–2012
pushed individuals into racial minority status based on religion and linguistic ancestral origins–regardless of skin shade.
Endnotes 1
Unless otherwise stated, these events are extracted from Akram (2002). 2
These are single-bias incidents, that is, if a hate crime is directed toward an African American Muslim, the FBI determines if the crime is directed against the individual because he is black, a Muslim, or both. There are extremely few multi-bias incidents.
3
Kaushal et al. (2007) find no wage and employment effects for Arab and Muslim women.
4
higher fertility rates among Arab and Islamic males and females; reduced female labor force participation; and, decreased the use of English at home as well as English proficiency.
5
See Ajrouch and Jamal (2007) for a similar empirical specification. 6
There were no CPS observations on individuals from following majority Muslim countries: Bahrain, Brunei, Burkina Faso, Chad, Comoros, Djibouti, Gambia, Guinea, Kazakhstan, Kyrgyzistan, Libya, Maldives, Mali, Mauritania, Mayotte, Niger, Oman, Qatar, Tajikistan, Tunisia, Turkmenistan, United Arab Emirates, and Western Sahara.
7
Several DOJ ancestral groups are excluded from our sample for alternative reasons. Eritrea and North Korea are not Arab or Islamic groups. Algeria, Indonesia, Kuwait, Somalia, Sudan, Yemen are not in the core sample. There were no observations from Bahrain, Qatar, Tunisia, and United Arab Emirates.
8
For 1994 and 1995 there are 14 and 96 observations, respectively, for the native-born sample.
9
In order to economize on tables, we do not present the results here. The results, however, are available upon request. The elderly logistic equation is slightly different from the others. The likelihood function does not converge if we use state fixed effect; hence, we substitute US national region fixed effects. The reported results use the core sample.
10
Results are not presented here, but are available from the author upon request. 11
Results are available upon request.
Competing interests
The IZA Journal of Migration is committed to the IZA Guiding Principles of Research Integrity. The authors declare that they have observed these principles.
Acknowledgements
The authors would like to thank the responsible editor and anonymous referees for providing excellent editorial and substantive comments.
Responsible Editor: Amelie Constant
Received: 3 April 2014 Accepted: 8 September 2014
References
Ajrouch K, Amaney J (2007) Assimilating to a white identity: the case of Arab Americans. Int Migrat Rev 41(4):860–879 Akram SM (2002) The aftermath of September 11, 2001: the targeting of Arabs and Muslims in America. Arab Stud Q
24(2 & 3):61–118
American Civil Liberties Union (2004) Arab and Muslim Communities Should Not be Targets of Racial Profiling. http://www.aclu.org/national-security/aclu-warns-resurrecting-voluntary-interview-program-arab-and-muslim-communities-sh. June 22, 2004
Arab America (2014) Arab Americans. David Communications, Washington, DC, http://www.arabamerica.com/contact. php, August 8, 2014
Cainkar L (2002a)“No Longer Invisible: Arab and Muslim Exclusion After September 11”, Middle East Report 224 (December 23, 2002)
Cainkar L (2002b) Special Registration: A Fervor for Muslims. J Islam Law Cult 7(2):73–101
Darity WA Jr, Mason PL, Stewart J (2006) The Economics of Identity: The Origin and Persistence of Racial Norms.” Journal of Economic Behavior and Organizations 60(3):283–305.
Davila A, Mora MT (2005) Changes in the earnings of Arab men in the US between 2000 and 2002. J Popul Econ 18:587–601
Elver H (2012) Racializing Islam Before and After 9/11: From Melting Pot to Islamophobia. Transnat Law Contemp Probl 21(1):119–174
Gould ED, Klor EF (2013) The Long-Run Effect of 9/11: Terrorism, Backlash, and the Assimilation of Muslim Immigrants in the West. The Hebrew University of Jerusalem, Jerusalem, Israel, Unpublished Manuscript
Graves JL Jr (2006) What We Know and What We Don’t Know: Human Genetic Variation and the Social Construction of Race. http://raceandgenomics.ssrc.org/Graves/
Kaushal N, Robert K, Cordelia R (2007) Labor market effects of September 11thon Arab and Muslim residents of the
United States. J Hum Resour XLII(2):275–308
Lipka M (2014) New Muslim American Council Aims to Measure a Diverse Community. Pew Research Center, http://www.pewresearch.org/fact-tank/2014/03/20/new-muslim-american-council-aims-to-measure-a-diverse-community/, August 8, 2014
Majaj LS (2000) Arab-Americans and the meanings of race. In: Singh A, Schmidt P (eds) Post-Colonial Theory and the United States: race, ethnicity, and literature. University Press of Mississippi, pp 320–337
Office of Management and Budget (1997) Revisions to the Standards for the Classification of Federal Data on Race and Ethnicity. Federal Register Notice, http://www.whitehouse.gov/omb/fedreg_1997standards/
Pew Research Center (2011)“The future of the global Muslim Population: projections 2010–2030. Pew Research Center Forum on Religion & Public Life, Washington, DC
Rabby F, III Rodgers WM (2011) Post 9–11 U.S. Muslim labor market outcomes. Atl Econ J 39:273–289
U.S. Department of State (2014) Muslims in American–A Statistical Portrait. http://iraq.usembassy.gov/resources/ information/current/american/statistical.html, August 8, 2014
Zogby JJ (2001) What Ethnic Americans Really Think (The Zogby Culture Polls). New York: Zogby International
doi:10.1186/s40176-014-0020-9
Cite this article as:Mason and Matella:Stigmatization and racial selection after September 11, 2001: self-identity
among Arab and Islamic Americans.IZA Journal of Migration20143:20.
Submit your manuscript to a
journal and benefi t from:
7Convenient online submission 7Rigorous peer review
7Immediate publication on acceptance 7Open access: articles freely available online 7High visibility within the fi eld
7Retaining the copyright to your article