Qualification Structure, Over- and
Under-qualification of the Foreign Born in Austria
and the EU
Peter Huber, Klaus Nowotny, Julia Bock-Schappelwein
FIW Research Reports 2009/10 N° 08
March 2010
This project focuses on comparing the qualification structure of migrants
residing in Austria as well as their over- and underqualification rates to
other EU countries. The skill structure of foreign born residing in Austria has
improved slightly in the last years. Austria is, however, characterised by a
high share of medium skilled migrants and a low share of highly skilled
migrants. In addition among the pool of migrants in the EU from a given
country, Austria generally selects the less qualified. The location decisions
of highly skilled migrants are mostly governed by income opportunities,
labour market conditions, ethnic networks and a common official
language. Over- and under-qualification rates among the foreign born in
Austria largely accord with the European average, the largest part of the
differences can be explained by differences in qualification and country
structure between the foreign born in Austria and the EU. Native-foreign
born differentials in employment rates are, however, significantly higher in
Austria than in other EU countries.
JEL Codes: F22, J61, J15
Keywords: Migration, Migration Policy, Migrant Skill Structure, Integration
The FIW Research Reports 2009/10 present the results of four thematic work packages ‘Microeconomic Analysis based on Firm-Level Data’, ‘Model Simulations for Trade Policy Analysis’, ‘Migration Issues’, and ‘Trade, Energy and
Qualification Structure, Over-
and Under-qualification of the
Foreign Born in Austria and the EU
Peter Huber, Klaus Nowotny, Julia Bock-Schappelwein
Research assistance: Andrea Grabmayer,
Andrea Hartmann, Maria Thalhammer
ÖSTERREICHISCHES INSTITUT FÜR
WIRTSCHAFTSFORSCHUNG
A-1103 WIEN, POSTFACH 91 TEL. 798 26 01 • FAX 798 93 86
Peter Huber, Klaus Nowotny, Julia Bock-Schappelwein
January 2010
Austrian Institute of Economic Research
Commissioned by the Federal Ministry of Economy, Family and Youth
Research assistance: Andrea Grabmayer, Andrea Hartmann, Maria Thalhammer
Abstract
This project focuses on comparing the qualification structure of migrants residing in Austria as well as their over- and under-qualification rates to other EU countries. The skill structure of foreign born residing in Austria has improved slightly in the last years. Austria is, however, characterised by a high share of medium skilled migrants and a low share of highly skilled mi-grants. In addition among the pool of migrants in the EU from a given country, Austria generally selects the less qualified. The location decisions of highly skilled migrants are mostly governed by income opportunities, labour market conditions, ethnic networks and a common official language. Over- and under-qualification rates among the foreign born in Austria largely accord with the European average, the largest part of the differences can be explained by differences in qualification and country structure between the foreign born in Austria and the EU. Native-foreign born differentials in employment rates are, however, significantly higher in Austria than in other EU countries.
Please refer to: [email protected], [email protected], [email protected]
the EU
List of tables III
List of figures V
1. Introduction 1
2. The Skill structure of the foreign born in Austria 3
2.1 Introduction 3
2.2 Data 4
2.3 The Education structure of the foreign born in Austria 6
2.4 Age, Gender, Country of birth and Duration of Stay 11
2.5 A Shift-Share Decomposition 14
2.6 Summary 17
3. Determinants of the location choice of migrants in the EU 13 19
3.1 Introduction 19
3.2 Overview of the literature on location choice of migrants 20
3.3 Migration of highly skilled workers 24
3.4 Estimating location choice 26
3.5 Empirical analysis 32
3.6 Conclusions 43
4. Employment and over- and under-qualification rates of the foreign born
in Austria and the EU 45
4.1 Measurement and Stylized Facts 46
4.2 An aggregate decomposition of foreign-native differentials 53
4.3 Detailed decompositions of foreign-native differentials 56
4.4 Summary and conclusions 73
5. The Effects of Policy 76
5.1 Introduction 76
5.2 Institutional Background: Migration law in Austria 1990-2004 77
5.3 Data and stylised facts 81
5.4 Method 88
5.5 Results 89
5.6 Robustness 98
6. Summary and Conclusions 103
6.1 Results with respect to the skill structure of migration and settlement motives 103
6.2 Results with respect to over- and under-qualification 105
6.3 Results with respect to policy changes 108
Literature 110
List of tables
Table 2.1: Foreign born population by country of residence, gender, age groups and duration of residence 13 Table 2.2: Results of a shift share analysis of the skill structure of migration to Austria 16
Table 3.1: Summary statistics for independent variables 28
Table 3.2: Conditional logit regression, all source countries 34
Table 3.3: Conditional logit regression, only source countries with HDI ≥ 0.75 39 Table 3.4: Conditional logit regression, migrants from EU 15-countries 41 Table 4.1: Employment rates of the EU population aged 15-64 by place of residence and educational attainment 48 Table 4.2: Correspondence of Major job groups (ISCO-88) and required skill levels (ISCED-97) using the job analysis
method according to the OECD 49
Table 4.3: Share of under-, accordingly- and over-qualified employed aged 15-64 by place of residence 50 Table 4.4: Over- and under-qualification rates by educational attainment and country of residence 51 Table 4.5: Over- and under-qualification rates by country of residence and duration of stay 53
Table 4.6: Probit regression results for equation 4.3 55
Table 4.7: Detailed regression results with respect to employment rates (2006 and 2007) 60 Table 4.8: Detailed regression results with respect to over-qualification rates 63 Table 4.9: Detailed regression results with respect to under-qualification rates 67
Table 4.10: Decomposition results according to equation 4.7 69
Table 4.11: Decomposition results according to equation 4.6 72
Table 5.1: Annual quota and first time permit for residence migration 79
Table 5.2: Chronology of migration law in Austria 79
Table 5.3: Annual quota for contingent work- and "Erntehelfer”-permits 80 Table 5.4: Logit regression results of the probability for a migrant being high, medium or low skilled before and after
accession to the EEA (relative to migrants from other developed countries) 91 Table 5.5: Logit regression results of the probability for a migrant being high, medium or low skilled before and after
accession to the EEA (relative to all other migrants) 92
Table 5.6: Logit regression results of the probability for a migrant being high, medium or low skilled before and after
accession to the EEA (annual effects) 93
Table 5.7: Logit regression results of the probability for a migrant being high, medium or low skilled before and after reform in residence law 2003 (relative to migrants from other developed countries) 96
Table 5.8: Logit regression results of the probability for a migrant being high, medium or low skilled before and after reform in residence law 2003 (relative to migrants from all other countries) 97 Table 5.9: Logit regression results of the probability for a migrant being high, medium or low skilled before and after
accession to the EEA (alternative specifications) 99
Table 5.10: Logit regression results of the probability for a migrant being high, medium or low skilled before and after reform in residence law 2003 (alternative specifications) 100
Appendix 115
List of figures
Figure 2.1: Share of foreign born population by country of residence 5 Figure 2.2: Share of foreign born population by educational attainment 7
Figure 2.3: Share of native population by educational attainment 8
Figure 2.4: Share of foreign born population by country of residence, educational attainment and country of birth 9 Figure 2.5: Share of foreign born population by country of residence, highest educational attainment, and duration
of stay 10
Figure 2.6: Foreign born population by country of residence and region of birth 12 Figure 4.1: Employment rates of the EU-population aged 15-64 by place of residence and region of birth 47 Figure 4.2: Employment rates of foreign born by country of residence and region of birth and duration of stay 48 Figure 5.1: Migration flows by nationality in Austria (1981-2008) 78 Figure 5.2: Foreign born residents in Austria by year of migration and region of birth 82 Figure 5.3: Foreign born residents in Austria (excluding former Yugoslavia) by year of settlement and country of birth
(1988-2005) 84
Figure 5.4: Share of high and low skilled migrants by country of birth in Austria (1991-2002) 85 Figure 5.5: Share of high and low skilled migrants by country of birth in Austria (1997-2005) 87
public debate on the potential effects of migration on the wages and employment prospects of natives2 as well as appropriate migration and integration policies3 in Austria. One
stylized fact that has gone largely unnoticed in the public debate, however, is that the foreign born in Austria differ markedly in their characteristics from those of other EU-countries. In particular according to data from the OECD (2008) in 2001 Austria was the OECD-country with the lowest share of high skilled among its foreign born population (see OECD, 2008, Biffl,
2006 and Bock-Schappelweinet al., 2008) and, as will be shown below, is also characterized by a structure of migration that is strongly focused on European countries that are not member states of the European Union (EU) as well as on older and female migrants with a longer duration of stay in the country.
These differences in the structure of migration to Austria raise a number of issues which are relevant to the design and workings of migration policy in Austria. In this study we focus on three of these: First, we want to know what factors shape the decision of migrants of different education levels to settle in a country. Second we want to compare differences in labour market integration of the foreign born relative to natives between Austria and other EU-countries and to analyze to what degree the differences found can be explained by differences in the structure of migrants. Third, we analyze how changes of the Austrian migration law in the 1990’s impacted on the qualification structure of third country migrants to Austria.
With respect to the first question we build on the results of the theoretical literature on migration networks (see Bartel (1989) for a classical contribution), which suggests that in particular unskilled migrants will move to regions where a large number of migrants from the same ethnicity already live as well as on the literature on migrant self-selectivity (see Borjas
(1999) for a survey), which suggests that highly skilled migrants will migrate from countries with low returns to education to countries with high returns to education, and the literature which analyzes the impact of national institutions on the skill structure of migration (e.g. Egger - Radulescu, 2008) to determine which of these factors contributes most significantly to the particularities of the skill-structure of migration to Austria.
1 Austria is, however, by no means the only country of the EU where the share of foreign born increased by this much
in the last decades, other recent European cases include Ireland (see Barrett (2009) for an overview) and Spain (see
Bentolila - Dolado - Jimeno (2008) for an analysis).
2 See Winter–Ebmer – Zweimüller (1996, 1996A, 1996B), Biffl et al. (1997), Hofer – Huber (1999), Huber – Hofer (2001) for
contributions.
3 See Biffl – Bock-Schappelwein (2007), Biffl et al., (2008), Bock-Schappelwein et al., (2008A), Bock-Schappelwein,
With respect to the second question, by contrast, we analyze differences in native to foreign born employment rate differentials across EU-countries. We, however, extend on existing literature by arguing that labour market integration of foreign born workers should not only be measured against the yardstick of employment, but also in terms of the match between migrants’ qualifications and jobs (see OECD 2007). In particular we follow recent contributions to the literature on the skill-education mismatch, by assuming that such a mismatch can arise both because migrants work in jobs which require qualification-levels lower than suggested by their highest educational attainment (in which case they will be considered as over-qualified) or because migrants work in jobs which require qualification levels, that are higher than their actual level of educational attainment (which will make them under-qualified). In accordance with this literature we also argue that the difference in the level of over-qualification between migrants and natives can be considered a proxy for the difficulties in transferring formal qualifications (of in particular high skilled migrants) across borders, while differences in measures of under-qualification can be considered proxies for the difficulties in transferring work experience (of low skilled migrants). Thus we also analyse the differences in native to foreign born over- and under-qualification rates differentials across EU-countries in a similar way as differences in employment rates.
Finally, with respect to the third question, we consider the experience of accession to the EEA and reforms of residence law in 2003 in Austria and analyze how these policy changes impacted on the skill structure of migrants. Here we use the fact that since the accession to the EEA on the 1st of January 1994, migration law in Austria applies only to migrants from countries which are not member states of the EEA (so called third country migrants). Since thus only migrants from EEA member states were affected by the accession of Austria to the EEA, while third country citizen were not and the opposite is the case for the reform of residence law in 2003, we compare the skill structure of migrants from the EEA and third countries before and after policy changes and apply standard difference-in-difference estimation techniques to evaluate the impact of migration policy the structure of migration. Given these tasks the structure of this study is as follows: In the next chapter we start our analysis with a comparison of the skill structure of migrants to the European Union and Austria while chapter 3 turns to an econometric analysis of motives of migrants of different skill groups for settling in a particular region. In chapter 4 we compare the labour market situation of migrants in Austria and the EU in terms of employment, as well as over- and under-qualification rates and present results of an econometric decomposition of native foreign differentials both in Austria and the EU. Chapter 5 analyses the impact of accession to the EEA and reform of residence law in 2003 on the skill structure of migrants moving to Austria and chapter 6, finally, summarises our main findings and draws some policy conclusions.
2.
The Skill structure of the foreign born in Austria
2.1 Introduction
The literature on international migration has repeatedly stressed that the extent and structure of migration has an important impact on the competitiveness of regions and countries. In this respect a number of studies (see Guellec - Cervantes, 2002, Hunt - Gauthier-Loiselle, 2008) have shown that highly skilled migrants are an important resource pool, which can be used to strengthen national R&D systems as well as integration into international R&D networks, increase entrepreneurial activity and overcome bottlenecks in regional labour supply. In addition to these advantages it has also been argued that shifting the structure of migration to the more highly skilled also has positive impacts on the income distribution within receiving countries (since highly skilled migrants are – if they increase wage pressures – likely to do so only in the high – skill, high-wage strata of the income distribution) and are – due to their better integration into the labour markets of the receiving countries – less likely to represent a burden on national social security and transfer systems (see Chiswick, 2005). While the literature has also argued that these advantages are countered by the potential increase in wage pressures (and potentially unemployment rates) for high skilled labour as well as reduced incentives for training and education of the native population (see for instance
Gould et al., 2006), there thus seems to be an almost uniform agreement in the literature that high skilled migration is preferable to low skilled migration.
These potential advantages of high-skilled migration are also reflected in the policy arena. In the face of ageing European societies and growing needs for highly skilled labour a number of EU member states including Austria have implemented migration policies to attract increasing shares of highly skilled migrants. Furthermore also the European Commission (as evidenced for instance by the recent green paper on the European Research Area see EC, 2007) acknowledges the fact that “It is ... essential to establish a single European labour market ..., ensuring effective “brain circulation” within Europe and with partner countries and attracting young talent and women into research careers” (EC, 2007, p.11).
Despite this high profile of the skill structure of migration in both the academic as well as policy debate existing evidence for Austria also suggests that progress in attracting more highly skilled migrants has been rather limited in the past. A by now quite sizeable number of studies (e.g. OECD (2008), Biffl (2006) as well as Bock-Schappelwein et al. (2008)) find that Austria has the lowest share of high skilled foreign born among all OECD-countries. Furthermore, a recent contribution by Bellot - Hatton (2008) suggests that Austria is also one of the few OECD-countries where the average skill structure of foreign born is worse than the average skill structure in the countries of birth of these foreign born, and that thus the foreign born in Austria are negatively selected on education from among their home country population.
These studies, however, almost exclusively either focus on national data sources to identify the determinants of high skilled migration to Austria only or on data collected by the OECD
(2008) or Docquier - Mafouk (2006) which both are for the years 2000 and 2001 compare the structure of migration among the OECD-countries. The data which we use for the majority of this study by contrast provide for a more recent comparison for the years 2006 and 2007 among EU-countries.
In this chapter we thus analyze the differences in the demographic structure of migrants to Austria and EU-countries with this more recent data with the aim of first of all establishing a set of stylized facts and second of all comparing our data to the results of existing studies on the skill structure of Austria. The next section describes the data used in this study, while section 3 presents descriptive evidence on the skill structure of migration to Austria in the years 2006/07 and section 4 shortly describes other aspects of the structure of migration to Austria (such as age and gender). In section 5 we present results of a decomposition analysis of the skill structure of migration to Austria and section 6 finally concludes by summarizing our results and drawing some policy conclusion.
2.2 Data
The data we use for this purpose are taken from the European Labour Force Survey (EU-LFS) for the years 2006 and 2007. In this regular questionnaire a representative sample of households of the 27 European Union (EU) member states (EU 27)4 is asked on their country of
birth as well as on a number of demographic and workplace characteristics (such as occupation, sector of employment, age, gender, highest educational attainment and others).5 Thus from this data it is possible to estimate both the total number and structure of
foreign born residing in the EU 276. Unfortunately, however, in the national questionnaires of
Germany and Ireland the question on country of birth is not asked. Thus we exclude these countries from our analysis. Furthermore, in the data 0.2% of the residents in the remaining EU-countries did not respond to the question on place of birth, 0.6% of the foreign born did not answer to the question on duration of stay and 0.8% of the residents did not answer to the question on their highest educational attainment. 7 While these figures seem sufficiently small
to allow representative analysis, we exclude from our analysis all persons, who did not answer the
4 See: http://circa.europa.eu/irc/dsis/employment/info/data/eu_lfs/index.htm for the questionnaire and its
methodology.
5 See Hierländer - Huber (2009) for a detailed description of the data.
6 In this chapter, as in the whole of this study, in accordance with much of the migration literature we focus on the
concept of “foreign born” as a definition of a migrant. This is preferable to the nationality concept since it provides a more complete picture of migration by also including naturalized citizens and (of particular importance for international comparisons) avoids distortion arising from differences in naturalization policies across countries.
7 Non-response rates are substantially higher in individual countries. In the UK 23% of the residents do not provide their
highest completed education and in Denmark almost 27% of the foreign born do not answer to the question of the years of residence. Non response with respect to country of birth, by contrast, is not concentrated on any individual country. The highest non-response rate to this question is found in Denmark, where it amounted to 0.5% of all residents.
question on the highest completed education and place of birth, which results in an exclusion of 1.5% of our sample8. In addition, we consider only the active aged population between 15
and 64.9
Since our data is taken from a survey, it is also subject to sampling error. We minimize this problem by using averages across two years (2006 and 2007), but in a number of cases the number of foreign born is well below the confidence bounds provided by EUROSTAT. To avoid misinterpretation, we follow the rules of reporting suggested by Eurostat10 by listing all figures
where high standard errors of the estimates may be expected in brackets and suppressing all numbers where levels are below the lower confidence bounds suggested by EUROSTAT.
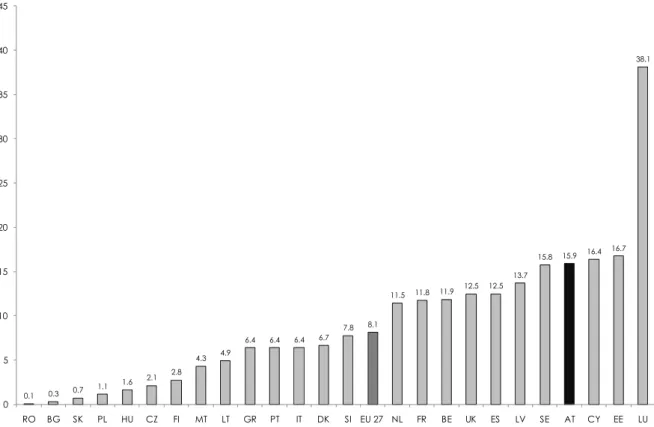
Figure 2.1: Share of foreign born population by country of residence
Average 2006 & 2007, in % of total active aged population
Source: EU-LFS. – Notes: Base population aged 15-64, excluding Germany and Ireland, excluding unkown highest completed education and unknown country of birth.
This data has recently also been used by EC (2009) and Hierländer - Huber (2009) to compare the foreign born in the EU 27. In these reports Austria emerges as an EU-country with a relatively large share of foreign born among its population. Among the 27 EU-countries,
8 We also exclude non-respondents to the question on duration of stay only where this is relevant. 9 We decided on this age limit since it makes comparison to official sources easier.
10 See http://circa.europa.eu/irc/dsis/employment/info/data/eu_lfs/index.htm 0.1 0.3 0.7 1.1 1.6 2.1 2.8 4.3 4.9 6.4 6.4 6.4 6.7 7.8 8.1 11.5 11.8 11.9 12.5 12.5 13.7 15.8 15.9 16.4 16.7 38.1 0 5 10 15 20 25 30 35 40 45 RO BG SK PL HU CZ FI MT LT GR PT IT DK SI EU 27 NL FR BE UK ES LV SE AT CY EE LU
Austria ranks fourth with respect to this indicator. Only the obvious outlier of Luxemburg (where the share of foreign born among the total resident population reaches over 38%) and the smaller countries of Cyprus and Estonia, have higher shares of foreign born among their resident population than Austria (see Figure 2.1).
At the same time Figure 2.1 also clearly points to a low share of foreign born population among most of the EU 27 countries which joined the EU after May 1st 2004 (i.e. the NMS 12).
According to LFS data around 94% of all migrants in the EU 27 reside in the EU 15. Only around 6% reside in the NMS 12 countries.11 This strong focus on the EU 15 implies that for most of the
NMS 12 the number of observations on migrants in the EU-LFS is low, that data cannot be trusted to be informative. Thus – to allow for a representative analysis – we also omit the NMS 12 countries from our sample and focus only on the EU 15 (excluding Germany and Ireland).12
2.3 The Education structure of the foreign born in Austria
Our final data thus consist of observations from 13 EU member states which joined the EU before May 1st 2004, and to which we henceforth refer to as the EU 13. According to these
data Austria is a country where the education structure of migrants is strongly focused on the medium skill segment of the labour market and where only few highly educated migrants live. 46.7% of the foreign born population in Austria has ISCED 3 or 4 educational level and is thus medium skilled. Behind the UK this is the second largest share in the EU 13. At the same time the share of high skilled migrants is only 16.5% of the total foreign born population, which is the third lowest share. The shares of high skilled migrants were lower only in Italy and Greece. The share of low skilled (I.e. ISCED 0-2) foreign born is 36.5% in Austria and is the eighth lowest among the EU 27.
Our data are thus consistent with the large body of recent comparative empirical evidence cited in the introduction to this chapter, which suggests a low share of high skilled migration to Austria. Our data, however, also suggest a moderate improvement in the relative position of Austria among the EU 13 countries with respect to the skill structure of migration. While previous studies focusing on the years 2000/2001 find that Austria has the lowest share of high skilled migrants among the OECD-countries, our more recent data suggests that since then Austria has at least overtaken Greece and Italy with respect to this Indicator. This may, however, primarily be explained by the high share of recent low skilled migrants to these countries.
11 Among the NMS 12 only the Baltic countries (Estonia, Latvia and Lithuania) have sizeable shares of foreign born in
their population. These high shares are primarily due to the large number of Russian born residing in this country.
12 This omission can also be justified on substantive grounds since a number of studies (e.g. Untiedt, 2006) suggest that
the economic and educational structure of the NMS 12 still differs substantially from that of the EU 15, and that these countries are of only limited comparability to Austria.
Figure 2.2: Share of foreign born population by educational attainment
Average 2006 & 2007, in % of the foreign born active aged population
Source: EU-LFS. – Notes: Base population aged 15-64, excluding Germany and Ireland, excluding unkown highest completed education and unknown country of birth. Low skilled = ISCED 0-2, medium skilled = ISCED 3,4, high skilled = ISCED 5 or more.
Furthermore, in contrast to earlier contributions, with the data at our hands, we can also analyse the reasons for these particularities of the education structure of the foreign born in Austria a little further. In particular, comparing the education structure of the foreign born to that of natives (see Figure 2.3) suggests that in many respects the foreign born resemble natives. Austria is also a country with a high share of medium skilled among natives. 62.9% of the Austrians belong to the medium education groups (i.e. ISCED 3 or 4). This is the highest share among all the EU-countries sampled. Similarly the share of natives with tertiary education (high skilled) is only 14.5% (and thus even lower than the share of high skilled foreign born).13 This is the third lowest share among all EU 27 countries. The share of low skilled
13 With respect to these indicators we also checked the position of Austria in the EU 27. Here (after Poland, Slovakia
and the Czech Republic) Austria is the country with the fourth highest share of medium skilled active population, holds the seventh lowest share of highly educated, and the eighth lowest share of low skilled.
49.1 46.3 36.5 52.8 35.1 46.9 41.3 31.8 45.0 34.2 23.2 38.7 24.5 38.9 39.1 39.7 47.1 27.5 43.6 30.0 35.1 44.2 29.5 37.0 47.8 32.3 46.5 38.5 11.8 14.0 16.5 19.7 21.3 23.1 23.7 23.9 25.5 28.8 28.9 29.0 29.0 22.6 0 10 20 30 40 50 60 IT GR AT PT NL FR ES FI BE DK UK LU SE EU 13
natives in Austria, by contrast, is 22.6% and the second lowest (behind Sweden) among the EU 13.14
Figure 2.3: Share of native population by educational attainment
Average 2006 & 2007, in % of the native active aged population
Source: EU-LFS. – Notes: Base population aged 15-64, excluding Germany and Ireland, excluding unkown highest completed education and unknown country of birth. Low skilled = ISCED 0-2, medium skilled = ISCED 3,4, high skilled = ISCED 5.
This thus suggests that a substantial part of the strong focus of the education structure of foreign born on the medium education levels in Austria as well as the low share of highly educated foreign born may be attributed to the aggregate structure of labour demand, while from the point of view of comparison with the education structure of natives the outstanding feature of the foreign born in Austria, is the high share of low skilled.
14 Note that these data are consistent with much of the recent evidence on the skill structure of the population in the
EU. In particular the very high share of low skilled natives in Portugal is consistent with the evidence provided by
Böheim - Iga - Zweimüller (2010) as well as official Eurostat sources.
72.9 49.1 22.6 39.2 41.0 32.4 20.1 31.9 28.5 51.0 27.6 33.8 25.7 39.0 15.9 39.2 62.9 44.3 39.6 43.2 53.6 41.3 44.0 21.3 44.2 37.8 44.9 38.6 11.2 11.7 14.5 16.5 19.4 24.4 26.3 26.8 27.5 27.7 28.2 28.4 29.4 22.4 0 10 20 30 40 50 60 70 80 PT IT AT LU GR FR SE NL UK ES DK BE FI EU 13
Figure 2.4: Share of foreign born population by country of residence, educational attainment and country of birth
Average 2006 & 2007, in %
Born in the EU 27
Born in the Rest of the World
Source:EU-LFS. – Notes:Base population aged 15-64, excluding unkown highest completed education and unknown country of birth. Low skilled = ISCED 0-2, medium skilled = ISCED 3,4, high skilled = ISCED 5 or more.
35.1 50.0 28.0 24.0 42.9 13.8 20.0 40.6 39.7 31.8 17.3 18.7 19.2 36.7 49.9 30.3 52.1 51.1 31.9 59.3 53.0 30.8 31.3 38.5 51.7 49.1 38.6 40.1 15.0 19.8 19.9 25.0 25.2 26.9 27.0 28.6 29.0 29.7 31.0 32.3 42.2 23.3 0 10 20 30 40 50 60 70 IT FR GR FI PT AT UK BE LU ES NL SE DK EU 13
Low Skilled Medium Skilled High Skilled
54.3 47.9 51.1 55.7 39.6 45.0 48.7 38.0 39.2 45.8 28.0 32.8 24.5 41.8 35.1 40.9 36.4 26.2 41.6 33.7 28.4 38.9 36.5 29.9 45.0 38.6 45.7 36.6 10.6 11.2 12.5 18.1 18.9 21.3 22.9 23.1 24.4 24.4 27.1 28.7 29.7 21.6 0 10 20 30 40 50 60 IT AT GR PT NL ES BE FI DK FR SE LU UK EU 13
Figure 2.5: Share of foreign born population by country of residence, highest educational attainment, and duration of stay
Average 2006 & 2007, in %
Less than 10 years
10 years or more
Source: EU-LFS. – Notes: Base population aged 15-64, excluding unkown highest completed education and unknown country of birth. Low skilled = ISCED 0-2, medium skilled = ISCED 3,4, high skilled = ISCED 5 or more.
47.6 38.1 42.5 45.8 36.0 48.7 53.3 47.4 25.5 27.8 44.1 29.6 26.3 40.5 40.2 47.6 41.7 34.7 43.4 30.2 25.1 29.3 50.1 46.3 28.2 39.5 39.9 36.7 12.1 14.3 15.8 19.5 20.6 21.2 21.7 23.3 24.4 25.9 27.7 30.9 33.8 22.8 0 10 20 30 40 50 60 IT AT GR LU NL FR PT BE SE FI ES DK UK EU 13
Low Skilled Medium Skilled High Skilled
50.6 51.5 52.0 38.9 33.2 41.3 19.5 31.7 41.6 39.5 36.5 25.6 25.8 37.3 38.0 37.0 32.0 40.6 46.0 37.4 57.0 44.2 29.2 29.8 32.0 34.4 27.8 40.9 11.4 11.5 15.9 20.5 20.8 21.3 23.5 24.1 29.2 30.7 31.5 40.0 46.5 21.8 0 10 20 30 40 50 60 IT GR PT FI AT ES UK NL FR BE DK SE LU EU 13
In addition there are also pronounced differences in the education structure of the foreign born by sending country region and by duration of stay in many of the 13 EU-countries. This applies in particular to the education structure by sending country (see Figure 2.4). In general, migrants from third countries15 have here substantially lower educational attainment levels in
Austria than in the average of the EU, while with respect to the qualification structure of migrants from the EU 27 Austria performs much better. For instance the share of low skilled active aged migrants born in the EU 27 in Austria is only 13.8% and thus the lowest among all EU 13 countries. Among migrants born in third countries this share is 47.9%, which is the 5th
highest. Furthermore the share of highly skilled migrants born in the EU 27 is 26.9% in Austria and thus substantially higher than the 11.2% among migrants born in third countries.
Similarly with respect to the duration of stay in the country of residence, more recent migrants (i.e. those that reside in the country for less than 10 years) in Austria are better educated than those living in Austria for more than 10 years. The share of highly educated migrants among the more recent migrant cohorts is 20.8% (and thus the 5th lowest among the 13 EU-countries
considered in figure 2.5) but 14.3% (and thus the 2nd lowest in the EU-countries) among foreign
born residents living in Austria for more than 10 years. By contrast the share of low skilled recent migrants is 33.1% (i.e. 4th lowest among the EU 13) but 38.1% (6th lowest) among those
living in Austria for more than 10 years.
The only stylized fact that applies to all groups of foreign born considered in figures 2.4 and 2.5 is the high share of migrants with an intermediate level of education. Here Austria holds the highest share among the migrants born in EU 27-countries, the 4th highest share among
migrants born in third countries and the 2nd highest share among more recent migrants as well
as the 2nd highest share among established migrants among the 13 EU-countries.
2.4 Age, Gender, Country of birth and Duration of Stay
The marked differences in the education structure of migration between the EU 13 countries and Austria are also accompanied by differences in demographic structure. According to our data 52% of the foreign born in Austria were born in other European countries outside the EU. This after Greece (59.4%) is the second highest share among all EU 13 countries and substantially higher than the European average of 13.6%. Migrants from EU 27 countries, by contrast, account for 33.4% of the foreign born population, which is a share that is about comparable to the average of the 13 EU-countries (28.9%).16 The high share of migrants born
in non-EU 27 European countries thus comes at the expense of substantially lower shares of
15 We refer to third countries as all countries that are not member states of the EU 27.
16 Within this group, however, the share of migrants from the NMS 12 to Austria than in the EU 13 average and the
migrants born in other continents in Austria, than in the European average. Thus in contrast to most of the other 13 EU-countries migration in Austria is less diversified.17
Figure 2.6: Foreign born population by country of residence and region of birth
Average 2006 & 2007, in %
Source: EU-LFS. – Notes: Base population aged 15-64, excluding unkown highest completed education and unknown country of birth.
Associated with the high share of migrants from other European countries (who in Austria primarily come from Turkey and former Yugoslavia and entered the country as “Gastarbeiter” – in the 60’s and 70’s and afterwards in the early 1990s) a large part of the foreign born live in Austria since more than 10 years. More than two thirds of the foreign born in Austria have a duration of stay that is 10 years or longer.18 The share of such “longer established” migrants is
only higher in the Netherlands, Sweden, France and Belgium, while Spain and – to a lesser
17 This is also confirmed by OECD data from the population census in the years 2000 and 2001 (see OECD 2008).
According to this data only the Czech Republic, Hungary, Luxemburg, Poland and Slovakia have higher shares of foreign born from Europe among their foreign born than Austria (see also Huber, 2009).
18 This is also by and large consistent with OECD data from the Censuses of 2000 and 2001. Here, however, differences
between Austria and the rest of the EU seem to have increased recently on account of high recent migration to individual EU-countries (such as Spain, Ireland and the UK) and the “aging” of the sizeable migration cohort of the early 1990s in Austria. In 2000 the share of foreign born with duration of stay of less than 10 years was 38.3% according to OECD data, the share of such residents was, however, 40.8%.
0% 10% 20% 30% 40% 50% 60% 70% 80% 90% 100% AT BE DK ES FI FR GR IT LU NL PT SE UK EU 13
degree – Italy have a much higher share of more recent migrants among their foreign born population (see table 2.1).
Table 2.1: Foreign born population by country of residence, gender, age groups and duration of residence
Average 2006 & 2007, in %
Gender Age in years Duration of stay in years
Males Females 15-24 25-44 45-64 10 or more 1 to 9
AT 47.4 52.6 14.1 51.3 34.5 67.1 32.9 BE 48.4 51.6 12.6 48.5 39.0 69.6 30.4 DK 47.3 52.7 18.7 49.9 31.5 59.0 41.0 ES 48.6 51.4 16.1 64.2 19.7 23.0 77.0 FI 49.6 50.4 20.0 57.1 22.9 65.7 34.3 FR 48.2 51.8 9.2 42.0 48.8 75.4 24.6 GR 48.8 51.2 17.5 58.7 23.8 57.9 42.1 IT 47.5 52.5 13.8 63.7 22.5 51.5 48.5 LU 49.8 50.2 10.4 53.6 36.0 66.0 34.0 NL 47.7 52.3 12.6 52.4 35.0 79.0 21.0 PT 48.6 51.4 15.3 63.2 21.5 65.5 34.5 SE 47.9 52.1 11.7 46.9 41.4 76.4 23.6 UK 49.5 50.5 14.9 55.2 30.0 53.2 46.8 Total 48.4 51.6 13.5 54.7 31.8 56.4 43.6
Source: EU-LFS. – Notes: Base population aged 15-64, excluding unkown highest completed education and unknown country of birth. values in brackets have a low reliability. - = data provides too few observations to be reported.
The longer duration of stay of migrants in Austria also leads to a relatively large share of migrants in the age group of 45 to 64 among the active aged foreign born in Austria. 34.5% of the active aged foreign born in Austria – as opposed to 31.8% in the average of the EU 13 – belong to this age group. At the same time the age group of the 15 to 24 year olds is also slightly overrepresented relative to the EU 13 among the foreign born, while the medium age groups of the 25 to 44 year olds are slightly underrepresented. 14.1% of the active aged foreign born in Austria are 15 to 24 years old, while 51.3% are 25 to 44 years old. In the average of the EU 13 these shares are 13.5% and 54.7%, respectively, with in particular Finland, Denmark and Greece having particularly large shares of young migrants while Spain, Italy and Portugal have a large share of active aged foreign born in the intermediate age groups.
Finally, Austria is also a country where a large share of the migrants is female. 52.6% of the foreign born residing in Austria – as opposed to 51.6% in the average of all EU 13 countries – are female (see table 2.1). Austria after Denmark is the country with the second highest share
of females among the foreign born in the EU 13, which can be attributed to the important role of family reunion in Austria.19
2.5 A Shift-Share Decomposition
Descriptive evidence thus suggests that when compared to the rest of the EU 13 the skill structure of foreign born in Austria is characterized by a high share of medium skilled migrants and a low share of highly skilled migrants, while the share of low skilled foreign born is slightly lower than in other EU-countries, but high relative to the education structure of natives. In addition this descriptive evidence also suggests that these particularities of the education structure of foreign born in Austria are closely associated with the particularities of labour demand (in particular with respect to the high share of medium education levels among the foreign born) as well as more low skilled migrants from third countries and (to a lesser extent) more established migrant groups that reside in Austria for more than 10 years.
Our data thus provides some evidence on the skill structure of migrants to Austria, which is by and large consistent with that provided in previous research and adds to existing literature by also indicating that the skill structure of the foreign born in Austria has improved relative at least to some EU-countries in the last decade and that in comparison to other EU-countries the foreign born in Austria are strongly focused on migrants born in European countries, that already reside in the country for more than 10 years and a high share of older and female migrants.
Further insights on the causes for the marked differences in the education structure of the foreign born residing in Austria and the EU can be gained from a shift share analysis. The starting point of this analysis is that the share of foreigners of a particular skill group (h) residing in Austria ( ) as well as the share of foreigners of the same skill group residing in the EU ( ) is by definition equal to the weighted sum of the shares of foreign born from this skill group from a particular country of birth (i) among all foreign born from this country of birth residing in Austria or the EU (denoted as and , respectively) with the weights equal to the share of foreign born from the country under consideration in total foreign born residing in Austria or the EU (denoted as and ).
Thus the differences between the share of foreign born of skill group (h) residing in Austria and the share of foreign born of the same skill group residing in the EU is formally given by:
(2.1) ∑ ∑
Furthermore, a prediction of the share of foreign born of skill group (h) residing in Austria assuming that the skill distribution from each and every sending country (i) were equal in both Austria and the EU 13 can be derived by calculating the sum of shares of foreign born from
19 This again is consistent with OECD data from 2000 and 2001 (see OECD, 2008). According to this data the share of
females among the foreign born in Austria is 52.1% and the 7th highest among the European OECD-countries. In
contrast to our results, however, in this data Italy and the UK have higher shares of females. These countries were, however, also characterized by substantial male in-migration since 2000.
skill group from a particular country of birth (i) among all foreign born from this country of birth residing in the EU 13 weighted with the share of foreign born from this country in total foreign born residing in Austria (i.e. from ∑ ) subtracting this prediction from the first term under the summation sign on the right hand side of equation (2.1) and adding it to the second term under the summation sign, as well as rearranging, gives the following expression for the differences between the share of foreign born of skill group (h) residing in Austria and the share of foreign born of the same skill group residing in the EU:
(2.2) ∑ ∑
The two terms in squared brackets on the left hand side of equation (2.2) represent the two shift share components that explain differences in the skill structure of migrants between Austria and the EU. These have quite intuitive interpretations:
The first term (∑ ) measures the differences in skill structure that would result if the country structure of migration to Austria and the EU were the same and only the shares of a particular skill group coming from these countries differed. It thus measures the selection of migrants from among countries. A positive value of this term indicates that, even after controlling for differences in country structure of migrants, Austria attracts a disproportionately high share of foreign born from this skill group. A negative value implies that, after controlling for different sending country structures, Austria attracts a disproportionately low share of foreign born from this skill group from among all migrants to the EU. This term is thus referred to as the selection effect.
The second term (∑ ), by contrast, measures the difference in skill structure that would result if the share of migrants from the skill group were exactly the same for each and every country of birth in Austria and the EU 13. It thus isolates the impact of different country of birth structures of the foreign born on the differences in skill structure between the EU and Austria. Thus it is referred to as the country structure effect. A positive value of this term indicates that Austria attracts a high share of foreign born from countries with a high share of the respective skill group among all migrants in the EU. A negative value implies that many of the migrants come from countries of birth that have only a low share of the respective skill group among their foreign born in all of the EU.
The overall results of this decomposition analysis for the shares of low, medium and high skilled migrants are reported in the last row of table 2.2. They suggest a dominance of the selection effect in all cases except the share of high skilled migrants. For instance they suggest that if Austria had received the same share of low skilled migrants as the EU 13 average from each and every sending country, the share of the low skilled migrants would actually be by 0.8 percentage points higher in Austria than in the EU, although the share of low skilled migrants residing in Austria is actually by 6.2 percentage points lower than in the EU 13. Thus the lower than average share of low skilled foreign born is solely due to the selection effect. This effect suggests that if the country structure of migration were the same in Austria and the EU, the
share of low skilled among the foreign born would be by 3.4 percentage points lower than in the EU 13.
Table 2.2: Results of a shift share analysis of the skill structure of migration to Austria
Total Effect Country Structure
Effect Selection Effect Educational attainment level
low medium high low medium high low medium high
EU 15 –4.5 1.5 0.2 –1.5 –1.1 –0.3 –3.0 2.5 0.5
EU 12 0.0 5.9 1.7 1.7 3.9 2.1 –1.7 2.0 –0.4
Other Europe 12.1 13.8 1.1 11.3 11.5 4.2 0.8 2.3 –3.1
Turkey 8.5 2.5 0.3 7.4 3.3 0.7 1.2 –0.7 –0.4
Africa –11.3 –6.6 –4.3 –10.7 –7.0 –4.5 –0.6 0.3 0.3
Americas, Austrailia & Oceania –5.2 –6.3 –3.4 –5.1 –6.2 –3.6 –0.1 –0.1 0.2 South & Southeast Asia –1.7 –2.1 –1.3 –1.9 –2.0 –1.2 0.2 –0.1 –0.1
Other Asia –0.5 –0.2 –0.3 –0.3 –0.4 –0.3 –0.2 0.2 0.0
Established 2.7 11.3 –3.3 4.8 6.7 –0.9 –2.1 4.5 –2.4
Recent –5.3 –2.7 –2.7 –4.0 –4.6 –2.1 –1.3 1.9 –0.6
Total –2.6 8.5 –5.9 0.8 2.1 –2.9 –3.4 6.4 –3.0
Source: EU-LFS. – Notes: Base population aged 15-64, excluding Germany and Ireland, excluding unkown highest completed education and unknown country of birth and unknown duration of stay (differences to figure 2.2 due to exclusion of foreign born with unknown duration of stay and rounding errors).
Similarly the by 8.5 percentage points higher share of medium skilled migrants in Austria in its majority can be attributed to the selection effect. Here if Austria had exactly the same education structure among its migrants from each and every sending country as the EU 13, the share of medium skilled migrants would be only by 2.1 percentage points higher in Austria than in the EU. Thus 6.4 percentage points of the total difference can be accounted for by the fact that within sending countries Austria attracts a disproportionally large share of medium skilled migrants. Thus here too the selection effect accounts for the majority of the differences.
The only exception to this is the difference in the share of highly skilled foreign born in Austria. Here the country structure effect suggest that even if Austria received the same share of high skilled migrants from each country as the EU the share of high skilled would still be by 2.9 percentage points lower than in the EU. Thus this effect explains almost half of the total 5.9 percentage points lower share of high skilled migrants than in the EU. The remaining 3.0 percentage points, however, are due to the selection effect. Thus the foreign born in Austria from a particular sending country are also in average less often drawn from the high skilled.
In sum thus these results suggest that the marked differences in the education structure of foreign born living in Austria are to a large degree due to selection and that only with respect to the share of high skilled migrants does the country structure play a significant role in the explanation of these differences.
While we are unable to distinguish whether this strong selection is due to the particular structure of labour demand in Austria or the impact of Austrian migration policy, the findings with respect to the contribution of individual groups of foreign born to the total selection effect do provide some indication as to among which foreign born selectivity is most relevant. In particular these results suggest that a large part of the selection effect is explained by more established migrants that reside in Austria for more that 10 years and that – relative to the EU 13 – a particularly low share of the high skilled in Austria are born in other European countries, while the positive selection among medium skilled seems to by primarily due to a disproportionately high share of medium skilled foreign born from the EU 15, NMS 12 and other European countries. The share of low skilled by contrast is substantially higher than in the EU 13 average among the foreign born from Turkey.
2.6 Summary
In sum the results of this chapter suggest that in comparison to the EU 13 the skill structure of foreign born in Austria is characterized by a high share of medium skilled migrants and a low share of highly skilled migrants. At the same time the share of low skilled foreign born is slightly lower in Austria than in other EU-countries, but high relative to the education structure of natives. This thus points to rather unfavourable position of Austria with respect to the skill structure of the foreign born both relative to other EU-countries, that in their vast majority manage to attract more high skilled foreign born, as well as relative to the skill structure of natives, that substatially more often have a medium skill level than the foreign born.
In addition the descriptive evidence collected in this chapter also suggests that these particularities of the education structure of foreign born in Austria are closely associated with the particularities of labour demand (in particular with respect to the high share of medium education levels among the foreign born) as well as more low skilled migrants from third countries and more established migrant groups that reside in Austria for more than 10 years. These findings are also confirmed by a shift share analysis of the skill structure of migrants. This analysis, however, also indicates that the larger part of these differences in skill structure between Austria and the EU is due to the selection of migrants within country of birth groups rather than to an unfavourable country of birth structure of the foreign born. The only exception to this is the low share of high skilled migrants, which arises almost to equal parts from an unfavourable country structure as well as from a negative selection of the highly skilled foreign born within country of birth groups. Furthermore our results also suggest that more established migrants contribute more strongly to these patterns of selection than recent migrants and thus suggest some change in the selection of migrants in recent years in Austria.
From a policy perspective this underlines the importance of not only focusing on changing the country structure of migration but also changing the mechanism of selection of migrants by skills if a more highly skilled structure of the foreign born is sought for. Unfortunately with the data at our hands, however, we are unable to identify, whether the causes for this strong selection of mostly low and medium skilled migrants and can thus not determine whether they are rooted in the effects of migration policy, other elements of economic policy (such as for instance tax and income policies) or in the structure of labour demand and can thus not draw firm policy conclusions as to which factors contribute most to selectivity.
3.
Determinants of the location choice of migrants in the EU 13
3.1 Introduction
The theoretical literature on migration suggests that a number of factors may impact on the skill structure of migrants. For instance, as highlighted by the so-called welfare magnet hypothesis (see, e.g., Borjas, 1999a, Levine – Zimmermann, 1999), differences in social security systems as well as the taxation system can affect the locational choices of migrants with different skill levels. Low-skill migrants who face a higher probability of becoming unemployed may prefer countries with more generous social insurance systems, while high skilled migrants, who are more likely to earn high incomes, may shun countries with high progressivity of the tax system. Similarly, migration laws clearly may also impact on the skill structure of migrants, depending on the selectivity of this migration regime.
One aspect that has, however, gone largely unnoticed in this literature is that aside from these factors ethnic networks also can play an important role in determining the skill structure of migration. While a by now relatively large literature starting with Bartel (1989) documents that the choice of target country of a migrant is positively influenced by the presence of migrants of the same nationality in the same region (i.e. migrant networks) and a number of contributions suggest that the importance of networks varies with the migrant's level of education (for instance if low-skill migrants prefer regions with large ethnic networks, while high-skill migrants avoid such regions to escape statistical discrimination (Stark, 1994)), only few papers have so far empirically analyzed the role of networks in shaping the skill structure of migration. This is somewhat of a shortcoming in terms of migration policy because as pointed out in the migration literature, networks may cause a "lock-in” effect that may reduce the effectiveness of policy instruments to influence the structure of migration.
This chapter thus analyses the locational choice of migrants to the EU 15 with a special emphasis on differences in the determinants of locational choice by skills. In particular we use the data set described in the last chapter to analyse the choice of target region within countries. Our primary aim is to determine the relative importance of ethnic networks and variables indicating economic and social conditions in the target countries as well as a number of policy variables (such as social security and tax systems as well as migration laws) in determining the skill structure of migrants by linking variables measured both at the national and regional (NUTS-2) level to estimate an empirical model of the location choice of migrants.
The remainder of this chapter is organized as follows: the next section provides an overview of the empirical and theoretical literature on factors determining the location choice of migrants. Section 3.3 focuses on the predictions of this literature for the differences in the location choice of workers of different skill levels. Section 3.4 describes the data used and develops the empirical method applied in section 3.5. Section 3.6 concludes.
3.2 Overview of the literature on location choice of migrants
To determine the variables of interest for our analysis we draw heavily on various strands of the migration literature. This literature at the most basic level suggests that differences in economic opportunities (e.g., probability of finding a job or income opportunities) can be assumed to influence the location choice of migrants. According to the standard neoclassical model of migration individuals will move to countries where they expect to earn a higher income (given differences in costs of living) and/or where they expect to find employment. Given an expected income and an expected probability of finding employment, individuals will furthermore – ceteris paribus – prefer countries closer to their country of origin if costs of migration increase with distance.
Network migration
Aside from these factors, however, a range of other factors have been shown to be important for the country choice of migrants. One of these factors is ethnic networks. Since a seminal study on migrant concentration in the U.S. by Bartel (1989) there is a long list of empirical results supporting the network migration hypothesis, most of which, however, focus on the U.S. while there are only few studies covering European countries or the European Union.20 In addition several hypotheses have been developed to explain the phenomenon
that migrants tend to settle where other migrants from the same country of origin migrated before, resulting in a geographic concentration of migrants with similar ethnicity in specific locations. One of the most frequently cited theories is that migrant networks, which produce externalities for members of the same ethnic group because the costs of migration decrease with the number of previous migrants. This leads to "self-perpetuating” migration (Massy et al., 1993; Carrington – Detragiache – Vishwanath, 1996) from a specific source country. Above reducing migration costs, networks can also provide help with the settlement process, decrease the perceived alienation in the host country (Bauer – Epstein – Gang, 2000) or provide financial assistance (Munshi, 2003).
It is also often argued that networks can provide their members with ethnic goods like food, clothing, social organizations, religious services, media (like radio, newspapers, etc.) or marriage markets (Chiswick – Miller, 2005), which will make migrants more willing to move to a certain region. Since the provision of ethnic goods is likely to increase with the stock of migrants with similar ethnic background in a region, this will create incentives for other
20 Among the exceptions Pedersen – Pytlikova – Smith (2008) estimate the determinants for migration flows to 22
OECD countries and find a robust and sizeable effect of ethnic networks on the volume of migration flows. Furthermore, in a country study on Denmark; Damm (2009) shows that the relocation hazard of refugees randomly assigned to a municipality during the Danish spatial dispersal policy is lower for those assigned to a municipality with a higher percentage of co-nationals. Åslund (2005) found similar effects for immigrants to Sweden subject to the "Whole of Sweden Strategy" as well as a preference of migrants for regions with larger ethnic networks before the implementation of the strategy. Geis – Uebelmesser – Werding (2008) found networks to have a positive (but decreasing) effect on migrant's choice between four OECD countries (France, Germany, United Kingdom, and the U.S.).
immigrants to settle in regions where they can enjoy a larger supply of ethnic goods. Thus according to this theory the concentration of migrants will be the more pronounced the higher the share of ethnic goods in the migrants’ consumption basket and the more dissimilar the host and target cultures. In addition if there are economies of scale in the production of ethnic goods (as can be expected for instance for religious services or media), this geographic concentration will be more efficient than a distribution over various regions, because the lower price of ethnic goods reduces the costs of living (especially if ethnic goods make up a large part of the consumption basket), which attracts more immigrants to move into this region even if they could earn a higher wage somewhere else (Chiswick – Miller, 2005).
Furthermore, migration networks can also have a positive effect on labor market prospects. By being in contact with previous migrants, new arrivals can benefit from a better availability of information and increased labor market opportunities (Gross – Schmitt, 2003) or benefit from job referrals by more established members of the network (Munshi, 2003).21
Finally, recently Epstein (2002) and Bauer – Epstein – Gang (2005) have argued that herd behavior can constitute another explanation for the clustering of migrants in specific regions and can thus help explain the location choices of migrants. According to the authors, this occurs if there is imperfect information as to which among alternative target locations provides the highest utility. If a potential migrant observes only the outcome of previous migrants’ destination choices, but not the "signal” that determined their choice, she might discount her private information about alternative target regions and follow the flow of previous migrants in the belief that they must have had information which is not available to her.22
21 This hypothesis also finds some support in the empirical literature. For instance, Edin – Fredriksson – Åslund (2001)
find evidence for a statistically significant positive effect of ethnic concentration on migrant earnings and Munshi (2003) provides evidence that networks not only increase the probability of employment, but also help to channel network members into higher paying occupations. Other studies, however, showed that clustering negatively influences the economic success of migrants (Bartel, 1989, p. 388). One explanation for this is that migrant concentration may impact negatively on incentives for migrants to acquire host country specific skills (such as language skills). Lazear (1999 ) shows that native language fluency is negatively correlated with geographic concentration of migrants, Bauer – Epstein – Gang (2005) present evidence that ethnic enclaves lead to "language traps”, attracting migrants with poor or no knowledge of the host country’s native language and sustaining the migrants’ poor language abilities and Blom (1999) shows that this separation can have a negative effect on earnings and tends to increase with the cultural distance between the immigration group and the native population
(Blom, 1999). Although some authors such as Damm (2009a) concludes that the positive effects of ethnic networks
more than outweigh the negative effects, so that the overall effect of living in a region with a larger ethnic network has a positive effect on wages for workers of all skill levels, we would thus argue that the question of whether ethnic concentration is good or bad remains an open issue in the economic literature.
22 As with chain migration herd behavior can also lead to inefficiencies if previous migrants also discounted their
private information in favor of the belief that those who went there before them had information they do not have, while they could have gained a higher utility by following their private information (which must, however, not be the location with the objectively best conditions either). Herd behavior and network effects are – although conceptually different – not mutually exclusive: both effects can exist simultaneously and determine the location decisions of migrants. The presence of network externalities in this context can even increase the probability that herd behavior will be observed (Epstein, 2002).
Welfare magnets
Another factor that may impact on the location choice of migrants are differences in welfare provision. As the so-called "welfare magnet” hypothesis predicts, generous welfare systems can attract immigrants, especially those with the highest risk of becoming unemployed. Generous welfare systems might even attract migrants who would not have migrated otherwise or can keep migrants already living in generous welfare states from returning to their home countries (see Borjas, 1999a). Income-maximizing migrants should thus be clustered in countries or states with more generous welfare systems, while welfare-receiving natives are (more or less) randomly distributed across countries.23
Empirical evidence on the welfare magnet hypothesis can be found in Borjas (1999a), who concludes that welfare-receiving immigrants in the U.S. show a higher degree of clustering. Furthermore, the author shows that the "benefit elasticity" – the rate with which the welfare participation increases as a response to changes in welfare benefits – is larger for migrants than for natives. Levine – Zimmerman (1999), on the other hand, find no support for the welfare magnet hypothesis in their analysis of moves within the U.S. This result may, however, be related to the fact that the costs associated with moving to another state are larger than the gains in terms of higher welfare payments for those already living in the U.S. and does thus not contradict the findings of Borjas (1999a) for migrants to the U.S., for which the costs of moving to one state or another are virtually zero once the costs of moving to the U.S. are borne.
Again, most of the empirical literature focuses on migration to or within the U.S., while there are only few studies for the EU or single European countries. In their analysis of migration flows to 22 OECD countries, Pedersen – Pytlikova – Smith (2008) find only weak and results for their welfare generosity proxies (public social expenditure as a percentage of GDP) which are even negative in some regressions. On the other hand, results by Åslund (2005) or Damm
(2009) point to welfare seeking behavior by immigrants to Sweden and Denmark, respectively. The variables used to measure local welfare generosity are, however, debatable. Åslund (2005) uses the take-up rate for social assistance, while Damm (2009) uses the percentage of right-wing votes at the latest local election. One problem in this context is that the generosity of the welfare system hardly varies within European countries in contrast to the U.S., where welfare entitlement and level are determined at the state level. Effects are therefore hard to identify in single-country studies because of a low variation in the explanatory variable. Geis – Uebelmesser – Werding (2008) find mixed effects for their proxies for welfare generosity. On the one hand, they estimate a negative effect of pension
23 The reason for the latter is that mobility is costly, and most natives thus prefer to stay in their home countries even
though other countries or states offer higher benefits because the increase in benefits does not exceed the costs of moving. Migrants to a country, on the other hand, have already incurred the costs of moving abroad, and the marginal costs of choosing a specific destination country over another (at least within a defined geographical area) are rather small (Borjas, 1999a). Welfare recipients (or those most likely to depend on welfare payments, e.g., low-skilled workers) among new immigrants should therefore be clustered in those countries that offer the most generous welfare benefits.