Supporting Information
Viscous Microemulsions of Aqueous Film Forming Foam (AFFF) and Jet Fuel A Inhibit Infiltration and Subsurface Transport
Konstantinos Kostarelos,1,* Pushpesh Sharma,1 Emerson Christie,2 Thomas Wanzek,3 Jennifer Field2 1UH Energy, University of Houston, Houston, TX
2Department of Environmental and Molecular Toxicology, Oregon State University, Corvallis, OR 3Department of Crop and Soil Science, Oregon State University, Corvallis, OR
INTRODUCTION
Type 3 and Type 6 AFFFs are diluted to 3% and 6% prior to application but result in the same final concentrations when applied to fires. The Type 3 and Type 6 AFFFs listed on the MilSpec Qualified Products List (QPL) dating from 2015 to present8 are commonly referred to as ‘C6
AFFFs’ although their composition and chain length of PFAS are not yet publicly reported. MATERIALS AND METHODS
Critical Micelle Concentration of AFFF-1. The CMC of AFFF-1 was measured to be 60 mg/L using the pendant drop method (DataPhysics OCA 15EC). When AFFF-1 was diluted to the prescribed 3 % v/v dilution (3 parts per hundred or approximately 30 g/L) with synthetic tap water, AFFF-1 was well above its CMC.
Chemical characterization. AFFF and column effluent samples were diluted 1:1,000 or 1:50,000 to bring individual PFAS onto scale and then spiked with 33 stable isotope labelled standards as described in Schwichtenberg et al.39 Target and suspect PFAS in Peterson were quantified by the
approach described in Nickerson et al.40 Diluted samples were analyzed by liquid chromatography
tandem mass spectrometry as described by Barzen-Hanson et al. with minor modification.41 The
instrumental limits of quantification for target analytes ranged from 10 to 250 ng/L (Schwichtenberg et al.). The concentration of 15 anionic PFAS were quantified and the data used to compute the percent mass retained and to produce the concentration history in Figure 4. A more detailed chemical analysis including the PFAS, hydrocarbon surfactants, and butyl carbitol is forthcoming, but beyond the scope of the current study.
Materials. AFFF-1 was collected from actual AFFF dispensing equipment on an Air Force Base military base and used as a model AFFF for both phase behavior and flow experiments. AFFF-1 was chemically characterized and found to contain 11.5 g/L PFOS and other PFAS produced by electro-fluorination chemistry, which is consistent with a Type 3 (3M) AFFF (see Table S1). In addition to AFFF-1, five additional AFFFs were evaluated including three older AFFFs with known PFAS content (1989 and 2001 3M Lightwater and fluorotelomer-based Chemguard 2010), and the newer 2018 Chemguard AFFF, which is on the current MilSpec Qualified Products List.29
The 2018 Chemguard was not characterized for its PFAS content but was manufactured to meet the 2017 MilSpec that limited the PFOS and PFOA (C8) content and is likely is comprised of fluorotelomer-based PFAS.4 The fifth AFFF (Solberg RF-6 Re-Healing) was included since there
is great interest in fluorine-free AFFF but was not chemically characterized. Table S2 presents the results of chemical characterization for several of the AFFFs used in this work.
Synthetic tap water was used in experiments since potable water is used on bases for fire-fighting training and to fill emergency trucks. Jet A was purchased from Houston Executive Airport, Houston TX. All other chemicals used in this study were purchased as laboratory grade from VWR (Table S3). The sand used in flow experiments was OK-75 sand (US Silica, 99.8 wt.% quartz). Synthetic tap was created with the concentrations as listed in Table S4. The pH of the solution was maintained between 7.6 to 7.8 by adding minimal quantity of a 1% v/v HCl solution. Each batch of synthetic tap water was stored for only 1 week and, if not utilized within 1-week, a new batch was prepared.
Phase Behavior Tests
Salinity Scans with AFFF-1. Synthetic tap water was combined with a stock solution of NaCl to yield a desired NaCl concentration. In the phase behavior testing, when synthetic tap water was used, it was labelled as 0% NaCl from the perspective that no additional salt(s) were added to the tap water. Aqueous phases (synthetic tap water or NaCl solutions) are first added to 5-mL pipettes (VWR-brand 5-ml borosilicate; 4.6 mm inner diameter) to achieve a target salinity between 0 to 4 wt.% NaCl while the AFFF-1 concentration was fixed at 3 % v/v.40 A volume of AFFF-1 and Jet
A was added to the pipettes to achieve water-oil ratios of 1:1, 3:1, and 9:1. Pipettes were heat-sealed at the bottom (tip) prior to filling with any fluid, and were then heat-heat-sealed from the top once filled and shaken by hand vigorously for 30 s before being allowed to equilibrate at 20˚C and constant pressure for weeks and examined daily. The presence of micelles was determined by shining a laser light through each of the resulting phases.31-33 Note that microemulsion requires
surfactant at concentrations above the CMC in order to form. Nonetheless, Jet A and synthetic tap water were also observed in order to ensure that microemulsion formation does not occur absent of AFFF-1. No significant heat transfer to the Jet A and AFFF-1 solution was confirmed by an infrared thermometer, which indicated that ambient temperature (20°C ± 2°C) was maintained during the heat-sealing process.
Salinity scans are typically conducted using large gradations in salinity to observe formation of either Winsor Type I (typically at low salinity), Type III, or Type II (high salinity). Using the AFFF-1, 9 pipettes were prepared at 3 water-oil ratio for a total of 27. Once the broad scan was completed, the scans were repeated using 3 lower AFFF-1 concentrations (above CMC) and 6 salinities for a total of 18 and repetition is achieved in that all 45 combinations of AFFF-1 and Jet A formed a Type II microemulsion.
A second set of salinity scans was performed, using the procedures described above, with AFFF-1 at concentrations of AFFF-1.5, 0.75, to 0.375 vol.%, (representative of an improperly diluted formulation) over a salinity range from 0 to 1 wt.% NaCl, but the water-oil ratio was fixed at 1:1. No foamed AFFF-1 was used in these tests.
Table S1. Military specifications for Type 3 and Type 6 AFFF.
specification value
viscosity (cSt)a 2-10
spreading coefficient 3
foam expansion, min 5
foam 25% drainage timeb (min) 2.5
aminimum at 25 oC -max at 5 oC; bminimum
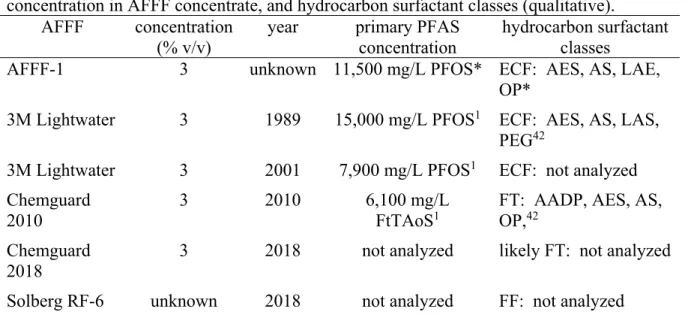
Table S2. AFFF manufacturer, year of manufacture, primary PFAS ‘active ingredient’ concentration in AFFF concentrate, and hydrocarbon surfactant classes (qualitative).
AFFF concentration
(% v/v) year primary PFAS concentration hydrocarbon surfactant classes AFFF-1 3 unknown 11,500 mg/L PFOS* ECF: AES, AS, LAE,
OP*
3M Lightwater 3 1989 15,000 mg/L PFOS1 ECF: AES, AS, LAS,
PEG42
3M Lightwater 3 2001 7,900 mg/L PFOS1 ECF: not analyzed
Chemguard
2010 3 2010 6,100 mg/L FtTAoS1 FT: AADP, AES, AS, OP,42
Chemguard
2018 3 2018 not analyzed likely FT: not analyzed
Solberg RF-6 unknown 2018 not analyzed FF: not analyzed * unpublished data
ECF=Electrofluorination PFAS; FT = fluorotelomer PFAS; FF = fluorine free
AADP = alkyl amido dipropionates; AES= alkyl ether sulfates; AS = alkyl sulfates; FtTAoS = fluorotelomer thioamidosulfonate; LAE =linear alcohol ethoxylates; LAS = linear alkyl benzene sulfonates; OP= octylphenol polyethoxylates; PEG= polyethylene glycol
Table S3. Chemicals (all purchased from Sigma Aldrich) and their purity used in the study. chemical purity (%) sodium bicarbonate 100 dipotassium phosphate 98 monopotassium phosphate 100 ammonium sulfate 99 sodium chloride 100
sodium nitrate 100
calcium sulfate 95
1-octanol 99
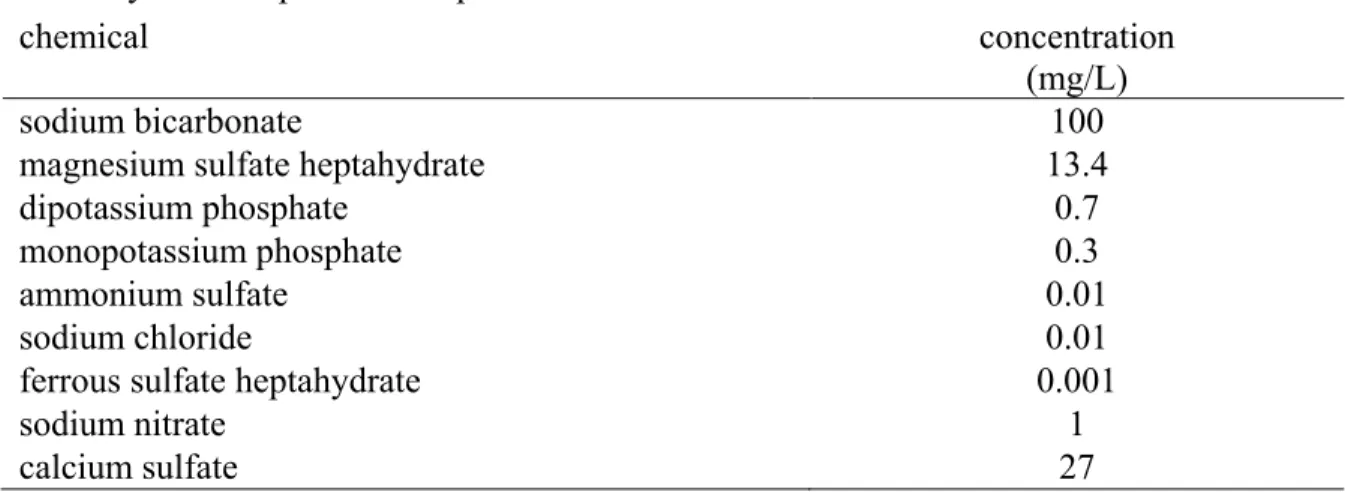
hydrochloric acid solution 1 magnesium sulfate heptahydrate 100 Table S4. Synthetic tap water composition.41
chemical concentration
(mg/L)
sodium bicarbonate 100
magnesium sulfate heptahydrate 13.4
dipotassium phosphate 0.7
monopotassium phosphate 0.3
ammonium sulfate 0.01
sodium chloride 0.01
ferrous sulfate heptahydrate 0.001
sodium nitrate 1
calcium sulfate 27
Limited phase behavior tests with 5 Additional AFFFs. These tests included variations of the procedures, namely: a) no mixing (replicating conditions at ground surface), b) vigorous mixing, c) foaming the AFFF prior to Jet A addition, and d) changing the order of AFFF and Jet A addition. In addition, all tests and variations (a) - (d) were repeated for these five AFFFs using larger 15-mL tubes.
While there is no data currently available to identify a representative ratio found at training facilities and/or emergency response locations, 1:1 water-oil-ratio yields the lowest amount of surfactant micelles within the Jet A and would be considered the conservative selection that was used to verify the visual observations of a viscous microemulsion. Three sets of 5-mL pipettes were prepared with the five additional AFFF solutions and Jet A using the procedures described above (1:1 water-oil ratio, 0% NaCl), where 1] one set was shaken by hand for 30 s, the second was not shaken (replicating conditions at ground surface, i.e., no mixing), and where the AFFF was foamed by shaking vigorously within the pipette followed by the addition of Jet A and then shaken by hand for 30 s. All three sets of pipettes, or 15 in total, were allowed to equilibrate for at least 4 hr and were then observed daily. In addition, all three sets of pipettes were repeated (15 additional samples), except that Jet A was added first followed by AFFF addition to determine if the initial resident fluid played a role in phase behavior.
A complementary set of tests were conducted using 15-mL plastic centrifuge tubes (Fisher Scientific; 14 mm ID) to study the effect of larger cross-sectional area on the phase behavior of the fluids. The 15-mL tubes had a cross–sectional area that is 9 times greater than that of the thinner, 5-mL pipettes and thus add less energy to the solutions when mixed. As described above for the 5-mL pipettes, these tubes were 1] shaken, 2] not shaken, and 3] foamed AFFF, and these three sets were repeated where the order in which the fluids were added to the tubes was reversed so that a total of 30 samples were prepared using 15-mL tubes.
Foam Stability. A custom polyacrylamide column (0.95 cm inner diameter by 30.5 cm) based on Singh42 was built to determine bulk foam height decay with time. A 10-µm aluminum sparging
frit at the bottom of the column helped distribute the gas phase during tests. A 10-mL volume of AFFF-1 was loaded into the apparatus then air was injected at 0.034 mPa for 30 s. Foam height decay with time was determined by reading the upper height level ℎ𝑢𝑢 and the lower height level ℎ𝑙𝑙 after each time step to calculate the foam height ℎ𝑛𝑛 at the nth time step of the test using the expression ℎ𝑛𝑛=ℎ𝑢𝑢−ℎ𝑙𝑙. Foam heights were normalized by dividing all values with the initial height ℎo. AFFF-1 foam stability was also tested with the presence of Jet A using the same method to
study its effect on the foam stability, where 10 ml of AFFF-1 and 1 ml of Jet A were added before foaming. Foam stability tests lasted several weeks and were not repeated, but were conducted under two conditions for comparison.
Rheological measurements. Rheological measurements were performed using TA Instruments DHR-2, double-gap concentric cylinder cup at 20˚C. Since viscosity can be a function of shear rate, the shear rate was varied from 0.1 s-1 to 100 s-1 so that 21 measurements were made for each
fluid. The viscosity of 3% AFFF-1, JetA, and a microemulsion generated by mixing AFFF-1 and Jet A at a 1:1 water-oil ratio, were measured by placing each fluid in a cylindrical cup suspended in a liquid reservoir and measuring the torsion required to rotate the cup.34 The viscosity of the
microemulsion was measured after equilibrating for only 10 min and after equilibrating for several weeks. The longer equilibration time was examined to determine if the rheology of the microemulsion remained constant as it infiltrates into the subsurface.
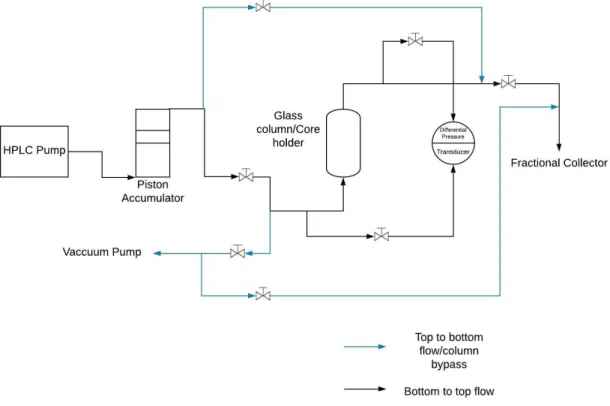
Column (1D flow) experiments. Two flow schemes were employed: 1) constant flow rate, where mixing energy is constant, and 2) constant pressure, where mixing energy varies directly with the resulting flow rate. The experimental set-up used for the dynamic flow experiments is shown in Figure S1 and consists of a glass chromatography column (Kimble-Kontes Chromoflex, Fisher Scientific) with 2.5-cm diameter and 15-cm length packed with clean sand. An HPLC pump was used to deliver fluid to the column with capability to pump at constant pressure or constant rate as desired. Multiple floating piston accumulators were used to contain fluids (3% AFFF-1, Jet A, synthetic tap water). A water circulator (Thermo Scientific ISOTEMP 6200) was used to maintain 20 ˚C. The properties of the porous media used for the two flow experiments are listed in Table S5. The porosity of the porous media is measured gravimetrically comparing mass before and after saturation, and accounting for the dead volume of associated tubing and fittings. The porosity is checked by volumetric measurements. The pore volume was computed using the same measurements and a conservative tracer (NaCl) was used to confirm the pore volume. Pressure transducers (Omega PX-26) were used to measure the pressure drop between the inlet and outlet of the column. The permeability is computed using Darcy’s Law by measuring the pressure drop corresponding with a minimum of 3 flow rates. The set-up was oriented vertically and designed to have a flow direction either downward or upwards, depending upon the fluid flow, and ensure a gravity-stable displacement. Produced fluid samples were collected using a fraction collector (ISCO Retriever 500) in 15-ml plastic centrifugal tubes.
To prepare the sandpacks with residual Jet A saturation, Jet A was injected into the water–saturated column downward to achieve a gravity–stable displacement of water until residual water saturations were achieved (Table S5). The sandpack was then waterflooded with synthetic tap
water using an upward flow direction to achieve residual Jet A saturation, mimicking the natural occurrence of fuel contamination.
Pressure differences between the inlet and outlet (‘pressure drop’) were recorded during the experiments. For the constant flow experiment, a constant rate of 0.3 m/d (0.032 mL/min) was maintained while monitoring the pressure drop. A high–pressure limit of 0.8 mPa was set on the injection pump to protect the experimental set-up from over pressurization. For the constant pressure experiment, pressure was maintained by a pump setting of 0.5 mPa, while the resulting flow rate was measured. The same preparation was also used for both constant pressure and constant flow experiments.
After characterizing the porous media (porosity, permeability), Jet A was injected into the water– saturated column downward to achieve a gravity–stable displacement of water until residual water saturation was achieved (i.e., tap water was no longer observed at the outlet). The injection flow rate was increased to ensure that all moveable water was produced. The sandpack was then waterflooded with tap water (upwards for gravity-stable displacement) to achieve residual oil saturation. Waterflooding was continued with increased flow rates until no jet fuel was produced to ensure the sandpack was at residual oil phase saturation, mimicking the natural occurrence of contamination. The same setup and preparation was used for both constant pressure and constant flow experiments.
Figure S1. Flow diagram for flow experiments; blue colored arrows highlight the downward flow loop.
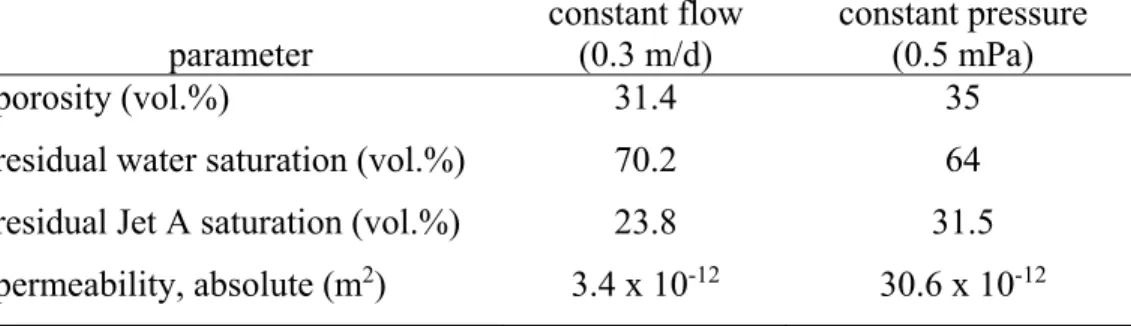
Table S5. Properties of the porous media used for the constant flow and constant pressure column experiments.
parameter constant flow (0.3 m/d) constant pressure (0.5 mPa)
porosity (vol.%) 31.4 35
residual water saturation (vol.%) 70.2 64 residual Jet A saturation (vol.%) 23.8 31.5 permeability, absolute (m2) 3.4 x 10⁻¹² 30.6 x 10⁻¹²
RESULTS AND DISCUSSION
Phase Behavior Experiments. The effects of scale, confinement, and mixing energy were also illustrative: microemulsion formation and the appearance of a viscous phase required adequate mixing energy, and smaller container size, respectively. Agitation of 3 vol.% AFFF solution and Jet A was required to form microemulsions for all AFFF solutions using smaller, 5-mL sealed pipettes. Without agitation of the sealed pipette, microemulsion—and consequently a viscous phase—was not observed using either the 5–mL pipettes, nor was it observed after shaking the 15– mL centrifuge tubes. Similarly, without agitation, neither the liquid nor the pre–foamed AFFF formed a microemulsion using either 5-mL and 15 mL sizes. When shaken, Winsor Type II microemulsions formed in the smaller size 5-mL pipettes as a separate, opaque phase, for all five additional AFFFs tested, which includes older and current AFFF formulations as well as the fluorine free AFFF. Photographs of three surfactant concentrations of AFFF-1 in Figure S2 show the Type II microemulsions formed with Jet A.
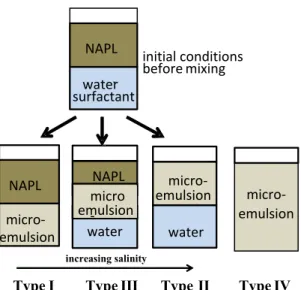
Four types of microemulsion were identified by Winsor (see Figure S3) and there are important distinctions in these microemulsions:
• Type I is an oil-in-water microemulsion where water and surfactant constitute the bulk phase and some oil is solubilized within the micelles and the remaining oil forms an excess phase;
• Type II is a water-in-oil microemulsion where oil and surfactant constitute the bulk phase and some water is solubilized within the micelles and the remaining water forms an excess phase;
• Type III is a bi-continuous oil and water microemulsion where both oil and water are solubilized and the remaining oil and water form separate phases so that three phases form in total, and;
• Type IV is a single-phase bi-continuous microemulsion where only solubilized oil and water exist. Type IV is formed by increasing the surfactant content of a Type III microemulsion. Density–based mixing of liquids was observed when Jet A was added first followed byfoamed AFFF during foam drainage, but the short duration of mixing between the two phases due to a density gradient did not provide sufficient mixing energy to create a visible microemulsion. Other than the minor mixing due to density gradient, the order in which the fluids were added to the pipette did not play a role in formation of a microemulsion. These results indicate that, during application of AFFF foam to a pool of Jet A at the surface, it is unlikely that a viscous phase would be observed above ground. After foam drainage and infiltration of the AFFF liquid, mixing and microemulsion formation likely occurred in the presence of co-discharged or pre-existing Jet A
residing in subsurface pore spaces. The dynamic flow experiments were designed to explore this possibility further.
Table S6. Foam height and duration.
observations 3% AFFF-1 3% AFFF-1
Jet A added no Jet A 1 mL Jet A
foam height (cm) 12.7 9.6
duration stable for 3 weeks stable for more than 3 weeks
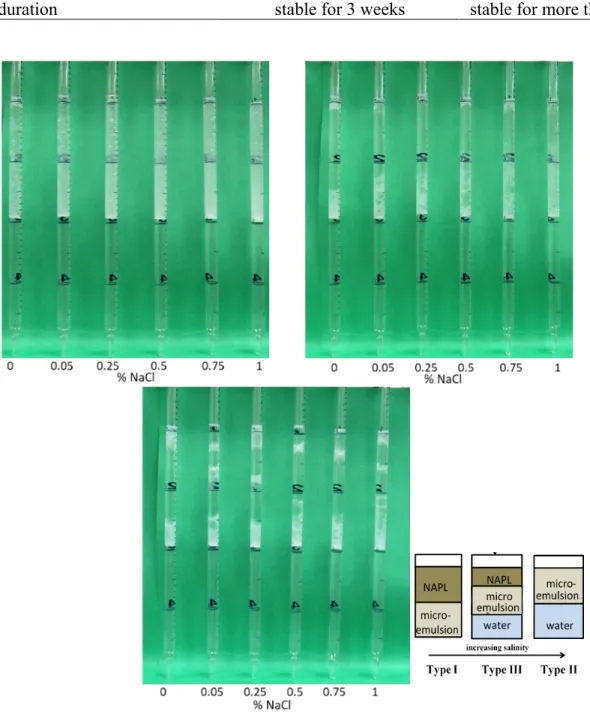
Figure S2: Viscous microemulsion (white upper phase) for Jet A at a water-to-oil ratio of 1 with AFFF-1 concentrations of 1.5 % (top left), 0.75 % (top right), and 0.375 % (bottom). Note that pipettes are intentionally rotated so the clarity can be inferred by observing the gradations (which appear reversed) through the liquids.
Figure S3: Graphical representation of Winsor microemulsion types; Type I, II, and III are most commonly observed, while Type IV is formed by increasing surfactant content of a Type III.
NAPL water -surfactant micro-emulsion water emulsion increasing salinity
Type I TypeIII Type II
NAPL NAPL water emulsion initial conditions beforemixing micro - micro-TypeIV micro-emulsion
REFERENCES
39. Schwichtenberg T; Bogdan D; Carignan C; Reardon P; Rewerts J; Wanzek T; Field J, PFAS and Dissolved Organic Carbon Enrichment in Surface Water Foams on a Northern U.S. Freshwater Lake. Environ Sci Technol, 2020, 54 (22), 14455-14464. DOI:
10.1021/acs.est.0c05697.
40. Nickerson, A.; Maizel, A. C.; Kulkarni, P. R.; Adamson, D. T.; Kornuc, J. J.; Higgins, C. P., Enhanced Extraction of AFFF-Associated PFASs from Source Zone Soils. Environ. Sci. Technol. 2020, 54 (8), 4952-4962.
41. Barzen-Hanson, K. A.; Roberts, S. C.; Choyke, S.; Oetjen, K.; McAlees, A.; Riddell, N.; McCrindle, R.; Ferguson, P. L.; Higgins, C. P.; Field, J. A., Discovery of 40 Classes of Per- and Polyfluoroalkyl Substances in Historical Aqueous Film-Forming Foams (AFFFs) and AFFF-Impacted Groundwater. Environ. Sci. Technol. 2017, 51 (4), 2047-2057. 42. Garcia, R. A.; Chiaia-Hernandez, A. C.; Lara-Martin, P. A.; Loos, M.; Hollender, J.;
Oetjen, K.; Higgins, C. P.; Field, J. A., Suspect Screening of Hydrocarbon Surfactants in AFFFs and AFFF-Contaminated Groundwater by High-Resolution Mass Spectrometry. Environ Sci Technol 2019, 53 (14), 8068-8077.
43. Kostarelos, K.; Lenschow, S. R.; Stylianou, M. A.; de Blanc, P. C.; Mygind, M. M.;
Christensen, A. G., Jet A fuel recovery using micellar flooding: Design and implementation. Sci. Total Environ. 2016, 563, 890-898.
44. LeChevalier, M. Preparation of Synthetic Tap Water for the Joint Service Agent Water Monitor Program (JSAWM) 2019.
https://studylib.net/doc/7577859/preparation-of-synthetic-tapwater-for-the-jsawm-program1) (Accessed 1 February 2019).
45. Singh, R. Multifunctional Foams and Emulsions for Subsurface Applications. University of Texas at Austin., 2017.