Since 1999, Technology Insight Corporation (TIC) has provided companies with result-oriented solutions to effectively manage every aspect of the Purchase-to-Payment data cycle. By combining revolutionary software technologies with practical root-cause analysis, TIC brings an unprecedented level of value to its clients. TIC understands that millions of dollars are at stake for its clients and is committed to a distinct end result: To reduce, recover, and redeploy
lost profits.
The foundation of TIC is built upon an innovative approach to Recovery Audit Services. Instead of the one-dimensional services that many other companies provide, TIC dissects each component of the cycle; from spend metrics to vendor master
file analysis, in order to produce tangible results. This comprehensive methodology is powered by ground breaking software which allows extremely large volumes of data from multiple sources to be processed in record time. This level of efficiency means that clients begin to see recovery in as little as 30 days.
With a reputation built on results, TIC has assembled a team of experts that embody the company’s core values of professionalism, respect, and integrity. These values dictate its conduct with every client and bring a new degree of service to the recovery audit industry. Uniting TIC’s people power with its process power creates the kind of sustainable solutions that today’s organizations demand.
TECHNOLOGY INSIGHT CORP.
INTRODUCTION
The higher education market presents a variety of unique and niche issues, each of which require a solution that is tailor-made to suit. While some of the solutions that exist in retail and manufacturing do not apply to the higher education market, there are some facets of those technology solutions which could positively impact this market by streamlining invoicing and recovering lost profits for their organizations.Like many industries, the higher education market is constantly transforming, on a never ending journey to find the right solution to the problems they face on a day-to-day basis. While some changes may be small, others are more involved, requiring intensive investments of manpower and money. For those who are venturing into more In today’s difficult economic environment,
Accounts Payable departments across all industries are working diligently on a daily basis to find innovative ways to better manage their increasing workflow. With an eye towards efficiency, accuracy and cost - savings, A/P managers are desperate for technology solutions that can address all of these issues.
In the higher education sector, these same concerns loom, compounded by the demands of transparency which trustees rely upon to make critical decisions affecting the future of their schools, especially in public universities and colleges where the use of state tax dollars is relentlessly scrutinized for value, the demand for such is at a premium.
involved projects with significant investments, it is imperative that they formulate the most effective plan. With surveys such as these and web access to an infinite manner of case studies and industry information, the higher education community is better equipped than ever to make the best decision possible from the very beginning.
When TIC partnered with Greylock Research in 2012 to endeavor on this survey project, it was with the desire to find clarity in the needs of higher education accounting departments.
To discover what is working and what isn’t working for them, lighting the way to the best solutions in the marketplace. What we discovered reinforced
INTRODUCTION
our assumptions in some cases and destroyed them in others. We were pleased to find that there is ample room for improvement and discovery for A/P departments in this sector and numerous ways in which technology can improve their processes immensely.Karl Andersson Founder & CEO
• Automated Solutions (imaging, workflow, data capture) are the largest untapped area for higher education accounts payable departments.
• Third Party Solutions, including software and recovery audits remain underutilized by the higher education sector.
• Many higher education accounts payable departments are unaware of existing technologies on the market today which could greatly improve their accuracy and efficiency rates.
• Approximately 30% of colleges are planning on implementing some type of technology tools within the next 24 – 36 months.
• Many colleges and universities are unable to implement significant technology upgrades due to economic constraints.
EXECUTIVE SUMMARY
Key Findings of the Study:
The Technology Trends in Accounts Payable Survey was conducted in 2012 by Greylock Research. A hyperlink to an online questionnaire was sent via e-mail to colleges and universities across the United States. The survey was made up of 11 multiple choice questions. Respondents of these colleges and universities were given multiple days to complete the survey. A total of 269 responses were submitted with 269 respondents completing the entire survey. The data in this report is a reflection of the responses that were submitted in this survey.
SURVEY QUESTIONNAIRE
1. How many invoices does your Accounts Payable department process monthly? 2. What kind of Accounting/ERP System
does your school use to process invoices?
3. Does your school have major system implementation plans in the future? 4. What automated invoice processing
solutions does your school utilize? 5. Does your school use an Imaging
Solution for your invoices?
6. Does your school utilize any Automated
Workflow Solutions?
7. Which payment methods does your school currently use?
8. Does your school utilize any kind of Third-Party software to identify potential duplicate payments?
9. Does your school engage a Third-Party Recovery Audit Firm?
10. Do you allow your suppliers to access a web portal where they may perform a look-up on the status of their invoices? 11. Does your school utilize the IRS TIN
Matching Program to validate supplier
Taxpayer Identification Numbers?
Figure 1: Geographic Distribution of respondents
All of the survey respondents represented Colleges and Universities in the United States. These included both private and public institutions. Of the schools surveyed, more than half were from the North States (59%), followed by the South (23%), then the East (10%). The smallest number of respondents was from the West (8%).
Although a large number of survey respondents were based in the Northern States, the survey still represented a wide range of areas across the United States, providing ample data to draw conclusions from. Additionally, we did not find any significant data skews which trended specifically across locations.
8%
59% 23%
10%
North South East West
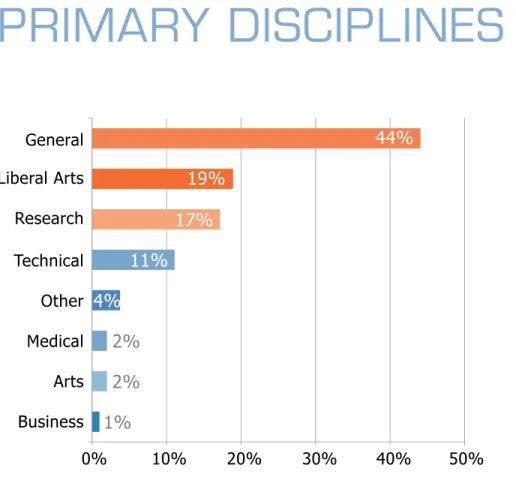
PRIMARY DISCIPLINES
Figure 2: Primary Discipline or Area of Focus of schools surveyed
Close to half of the survey respondents (44%) were from multi-disciplinary schools with no dominant focus of study. These were identified as General-type Colleges and Universities. These were followed by schools with primarily Liberal Arts-based curriculum at 19%. 4% 2% 2% 1% 19% 17% 11% 44% General Liberal Arts Research Technical Other Medical Arts Business 30% 20% 10% 0% 40% 50%
Research based universities (heavily focused on those with well-known medical and science programs) responded at 17%. Technical universities (which include trade-based programs such as drafting, paralegal, mechanical repair) reported at 11%. The remaining 9% of respondents included Arts colleges, Medical-only schools, Business schools and those who responded as ‘Other’.
In the United States, higher education schools are heavily based in those which offer a ‘General Studies’ format. While many schools eventually become known for certain disciplines, those same schools may still typically identify as taking a generalized approach to course and major offerings. While the primary disciplines offered did not create significant data skew, there was a minor escalation in the desire for greater technology solutions among Technical and Research based schools.
ANNUAL REVENUES
Primarily, schools surveyed were less than $50 million in annual revenues (46%). Almost one-quarter of respondents have $100 - $500 million in annual revenues (26%). Next were schools generating $50 - $100 million in annual revenues (20%). Schools with significantly larger annual revenues represented the smallest portion of respondents ($500 million - $1 billion at 5% and $1 billion+ at 3%).
While it is generally assumed that those schools with greater annual revenues might also have implemented A/P technology solutions (or plans to do so), the survey results did not indicate this across the board. Most results did not trend across annual revenue lines, indicating that when schools choose to implement technology solutions, the decision is driven less by the revenue generated for spending and more by a need or desire to streamline process for greater overall efficiency.
Figure 3: Estimated Revenue Level at schools surveyed 3% 5% 26% 20% 46%
Less than $50 Million $50 Million to $100 Million $100 Million to $500 Million $500 Million to $1 Billion More than $1 Billion
INVOICE VOLUMES
The overwhelming majority of schools surveyed reported that their Accounts Payable department processed fewer than 5,000 invoices each month (74%). This was followed by schools reporting that they processed 5,000 - 25,000 invoices per month (13%). Trending consistently with the annual revenue and size factors reported earlier, only a small amount of respondents indicated they processed significantly larger volumes of invoices each month (25,000 - 100,000 per month at 2% and greater than 100,000 per month at 1%). 10% of the respondents were unable to quantify the number of invoices their Accounts Payable department processed in a month.
The invoice volumes reported were consistent with the annual revenue volumes and the size of the schools surveyed. Regardless of the volume of processed invoices, the survey indicated that any number of invoices processed benefited from the use of technology-based workflow solutions available.
Question 1: How many invoices does your Accounts Payable department process monthly? 1 %2% 10% 13% 66% Fewer than 5,000 5,000 - 25,000 25,000 - 100,000 Greater than 100,000 Not Sure
ACCOUNTING ERP SYSTEMS
The single most prominent technology solution in the higher education market is the use of ERP (Enterprise Resource Planning) systems. While these software solutions were once the latest and greatest things in the market, they are now as common as any other computer software.
Every respondent to the survey indicated that their school does use some ERP system and
Question 2: What kind of Accounting/ ERP System does your school use to process invoices? 1% 5% 3% 13% 7% 15% 3% 5% 7% 33% 8% 15% 10% 5% 0% 20% 25% 30% 35% Sunguard Ellucian Great Plains SAP Jenzabar Homegrown Oracle Datatel PeopleSoft Other Banner
those responses were heavily based in Ellucian (which includes DataTel, SunGuard and Banner) at 50% of the market. Next, the Oracle-family of products (Oracle and the newly acquired PeopleSoft) encompassed approximately 20% of those surveyed. A number of other solutions make up the remaining 30%, including Microsoft Dynamics, Jenzabar, SAP and proprietary ‘homegrown’ technology.
ACCOUNTING ERP SYSTEMS
In an industry driven by consolidation, the list of prominent names in the ERP system world grows smaller and smaller. In just the last couple of years, Ellucian acquired Data Tel and Sungard; Oracle acquired PeopleSoft and Microsoft acquisitions evolved in to what is known now as Dynamics. For the customer, this consolidation may offer less choice in the marketplace but may also provide a significantly stronger product overall with greater ease of use plus enhanced data capture and reporting. As each consolidation occurs, a new facet emerges in the industry, providing better options for the higher education market to streamline their systems. Both now and on the horizon, there are solutions available to the higher-education market which can and will change how their workflow processing is handled.
ELLUCIAN (WHICH
INCLUDES DATATEL,
SUNGUARD AND
BANNER) HAS 50%
OF THE MARkET.
”
“
FUTURE SYSTEM IMPLEMENTATIONS
Question 3: Does your school have major system implementation plans in the future?
When surveyed about their plans for the future as it relates to major system implementations, a strong majority of respondents indicated that their school has no plans to implement any major system changes in the next 24 months (67%). In addition, 15% of those reported that they did not know either way if any plans were on the horizon.
67% 15% 6% 5% 4% 3% 30% 20% 10% 0% 40% 50% 60% 70% No. We have no plans that I am aware
of a major system implementation within the next 24 months. I don’t know. Yes. We are upgrading our existing
system within the next year. Yes. We are upgrading our existing system within the next 12-24 months. Yes. We are implementing a new system within the next 12-24 months. Yes. We are implementing a new system
within the next year.
Yet, almost 11% of respondents were endeavoring on upgrades to their existing systems within the next year to two years. Those who were aware of entirely new system implementations in the next year to two years represented the smallest number at 7%.
Concurrent with the assessment that most organizations are currently satisfied with their existing ERP system, the survey shows that upgrades are far more prominent than new
system implementations. Because new system implementations are incredibly time, resource and investment heavy, many schools hesitate to change them, relying instead on their existing ERP provider to offer upgrades and enhancements which schools can take advantage of with less disruption.
Yet, those upgrading and those implementing new systems, still represent a strong 18%, which is consistent with the figure across all industries, indicating that while the higher education sector may have some unique needs, they remain as committed to new technology as any other areas of the marketplace.
18% OF SCHOOLS
SURVEYED ARE
INVESTING IN
ERP SOLUTIONS.
”
“
INVOICE PROCESSING
Question 4: What automated invoice processing solutions does your school utilize?
At 61%, most schools reported that they did not use any currently available technologies to process automated invoices. While some did use the simple solutions such as Spreadsheet and Text file uploads (14%), only 9% utilized the more reliable EDI feed system. Even smaller numbers reported using Supplier Portals (4%) or Two-Way Match technology (6%).
Invoice processing appears to be an area from which the higher education sector could easily benefit from the reliable and market-tested
options available. Since a significant number of those surveyed have indicated that they do not use any of those items which so many industries use heavily and with great results in overall accuracy and efficiency, bringing these to the higher education market is critical to providing overall value to these organizations.
6% 6% 15% 9% 61% 30% 20% 10% 0% 40% 50% 60% 70% Other
Two Way Match Transactions (i.e. ERS or PFR) Supplier Portal -Enter their own invoices
Spreadsheet/Text file uploads EDI We don’t process automated invoices. 5%
IMAGING SOLUTIONS
Question 5: Does your school use an Imaging Solution for your invoices?Again, with the time-tested advantages of numerous imaging solutions currently available, the relatively unremarkable number of those higher education organizations using them is surprising. As imaging solution technology continues to improve, those schools who implement some form of imaging solution are bound to benefit significantly.
While many schools report the use of imaging solutions for their invoices (13% scan upon receipt and 29% scan after entry), a surprising number of those surveyed do not currently use any invoicing technology in their current system (58%). Even more surprising, half of that 58% have no plans in the next two years to implement an imaging solution. The remaining half (28%) have some plan to implement an imaging solution in the next 6 to 24 months.
16% 9% 4% 28% 30% 13% 35% 15% 10% 5% 0% 20% 25% 30% No. But we plan on implementing a
solution in the next 12-24 months. No. But we plan on implementing a solution in the next 6-12 months. No. But we plan on implementing a solution in the next 6 months. No. We don’t do imaging and have
no intention of implementing a solution in the next 24 months. Yes. We scan all our invoices AFTER
they have been entered. Yes. We scan all our invoices
AUTOMATED WORkFLOW
SOLUTIONS
Question 6: Does your school utilize any
Automated Workflow Solutions?
While Automated Workflow Solutions are not yet a commonplace technology in many higher education Accounts Payable departments, the tide is turning to include its many formats in their future plans. Just over one-third of respondents (33%) indicated current use of an ERP system
Another 18% of those surveyed stated that implementation of automated workflow solutions within the next 1-2 years. Despite this, nearly half indicated that their organization had no plans to implement a solution (34%) or did not know what an automated workflow solution was (15%). Automated Workflow appears to be yet another untapped resource for the higher education
34% 10% 8% 15% 8% 25%
No. And we have no plans on implementing a solution in the next 24 months. No. But we plan on implementing a solution in the next 12-24 months.
Yes. We use a third party workflow system.
I don’t know what a workflow system is.
No. But we plan on implementing a solution in the next 12 months.
Yes. We use the workflow that is part of A/P system. 35% 15% 10% 5% 0% 20% 25% 30%
of automated workflow trends with the size of the organization and the average number of invoices processed annually, as the perceived value of such technology increases as these variables increase. While larger schools may recognize a return on investment in Automated Workflow Solutions in a lesser time frame, studies indicate that small organizations’ ROI timeframe does not increase radically compared to their larger counterparts. In larger schools the ROI ties in greatly to reduced staffing needs, while small schools realize greater value in accuracy and reduced impact on existing staff resources.
AUTOMATED WORkFLOW
SOLUTIONS
...STUDIES INDICATE
THAT SMALL
ORGANIzATIONS’
ROI TIMEFRAME
DOES NOT
INCREASE
RADICALLY
COMPARED
TO THEIR LARGER
COUNTERPARTS.
”
“
PAYMENT METHODS
Question 7: Which payment methods does your school currently use?
Technology changes in payment methods continue to improve with time, yet this remains an area of Accounts Payable where some basic, tried and true methods still dominate. The conventional paper check remains the dominant method of payment, with 98% of those surveyed reporting use of them. Next, at nearly 70% is the use of credit cards or procurement cards, followed by ACH transactions at 65%. Wire transfers were the least prevalent, presumably due to the increased
70% 50% 65% 97% 50% 25% 0% 75% 100% Credit Card / Procurement Card Wire Transfer ACH Check
Payment methodology is considered by many to be the final frontier in the Accounts Payable sector, as each currently utilized technology has its pros and cons. Forward-thinking organizations are continually on the lookout for a better solution, one which reduces the expense of paper checks.
Question 8: Does your school utilize any kind of Third-Party software to identify potential duplicate payments?
Duplicate payments remain a risk for every A/P department. Despite this, a remarkable number of schools do not use any third-party software to detect potential duplicate payments. Only 17% of those surveyed currently use this kind of software technology and even less have any plans in the next 12-24 months to implement anything (8%). Three-quarters report no plans to utilize any duplicate payment detection solutions
While the higher education sector trends along overall statistics when it comes to Accounts Payable accuracy rates at nearly 99.9%, the remaining one-tenth of a percent translates into significant dollars lost. As the number of invoices processed annually increases, the potential bottom-line loss due to duplicate payments also increases exponentially. While some ERP systems have a basic integrated duplicate payment detection option, many do not, requiring the use of third-party software to detect, recover and eliminate these errors which a significant number of schools could benefit from.
DUPLICATE PAYMENT
DETECTION
4% 17% 75% 4%No and we have no plans on implementing anything within the next 24 months. No, but we are planning on implementing something in the next 12 months. No, but we are planning on implementing something in the next 12-24 months. Yes. 70% 80% 40% 20% 10% 0% 30% 50% 60%
Question 9: Does your school engage a Third-Party Recovery Audit Firm?
The perception of a Recovery Audit is fraught with ideas of pricey and unproductive results as well as significant resource requirements, pushing most to avoid them at all costs. This is reflected in those surveyed, as nearly 45% report no previous audits or plans in the future for one. A small number (18%) indicate a Recovery Audit in the past and an even smaller number (8%) have plans in the next 1-2 years for a future Recovery Audit. Nearly one-third did not know what a Recovery Audit is (29%).
Recovery Audit Firms can provide schools with the best opportunity to objectively identify weak business processes and recover lost profits due to duplicate payments, fraud and data corruption. While many worry that the invasiveness of such an audit will be cumbersome, the end result for most organizations is greater transparency and the ability to drive stronger processes into their schools. While Recovery Audits are not commonplace in the higher education industry, they would benefit similarly as those in other segments.
RECOVERY AUDIT FIRMS
29% 2% 16% 7% 1% 45% 35% 45% 15% 10% 5% 0% 20% 25% 30% 40% 50% I don’t know what a recovery
audit firm is.
Yes, but it was over 3 years ago. Yes and it was in the past 3 years. We plan on having an audit performed in the next 12 months. We plan on having an audit performed in the next 12-24 months. We have no plans on having an audit done in the next 24 months.
The use of web portals for vendors and suppliers to access the status of their invoices is virtually non-existent in the higher education market as reflected by an overwhelming 85% of those surveyed indicating they do not use and have no plans to use this kind of technology in the future. Just 5% of those responding currently use this kind of technology. The remaining 10% have
Question 10: Do you allow your suppliers to access a web portal where they
may perform a look-up on the status of their invoices?
Web portals continue to increase in popularity as they offer suppliers and vendors greater control, information access and reduce the impact on Accounts Payable staff resources. The reduction in phone calls and emails inquiring about the status of payment remains a strong motivator for higher education A/P departments to consider this system. While there are some requirements to implementing a vendor web portal, in comparison to other technologies, it is relatively simple to put in place.
SUPPLIER ACCESS &
WEB PORTALS
85%
2% 5%
8%
No, and we don’t have any plans on implementing this in the next 24 months. No, but we plan on implementing this in the next 12 months. Yes. No, but we plan on implementing this in the next 12-24 months.
20% 40% 60% 70% 90% 10% 30% 50% 80% 0%
TIN MATCHING
Question 11: Does your school utilize the IRS TIN Matching Program to validate
supplier Taxpayer Identification Numbers?
Taxpayer Identification Numbers (TINs) are a key piece of information to any Accounts Payable department, including those of colleges and universities. Despite this, less than half of those surveyed reported that they are currently utilizing the IRS’ free TIN Matching program which can eliminate the costly errors in 1099’s issued by schools.
Only 8% of respondents indicate they have plans to utilize this program in the next 12-24 months. Unfortunately, 50% of those surveyed either were not aware of the TIN Matching Program or state they have no plans to use it.
In recent years, the IRS has imposed significant fines related to 1099’s and the IRS TIN Matching Program offers a simple way for any organization to reduce or eliminate costly errors at the end of the year. A substantial number of schools would benefit immediately from employment of
15%
35% 3%
5%
42%
I don’t know what the IRS TIN Matching solution is. No. And we have no plan on implementing it as far as I am aware. No. But we are going to implement it
within the next 12-24 months. No. But we are going to implement it within the next 12 months. Yes.
20% 10%
CONCLUSION
While many schools indicate that their technology investments are on hold for the next one to two years, their desire to find streamlined and value-conscious solutions remains strong. Automated data capture, payment processing solutions and lost profit recovery are hot button issues and when economic pressures are relieved, technology providers can expect a significant demand for those products which meet the unique needs of the higher education industry.The pressures on any Accounts Payable department, whether in retail, manufacturing or the higher education industry, continue to increase with each passing year. The demands of transparency and increased profits directly impact the professionals in Accounts Payable and they remain committed to looking for solutions to meet these demands.
Those higher education professionals surveyed indicate that technology solutions remain a top priority for their organizations, yet implementation of these options is impacted by reduced budgets in their colleges and universities. Like other sectors, their staff resources continue to be stretched to the limit and any initiative to take on new technology solutions is always compared to its perceived value in the short and long-term.