PerfScope: Practical Online Server Performance Bug
Inference in Production Cloud Computing Infrastructures
Daniel J. Dean
Hiep Nguyen
Xiaohui Gu
North Carolina State University
{djdean2,hcnguye3}@ncsu.edu, [email protected]
Hui Zhang
Junghwan Rhee
Nipun
Arora
Geoff Jiang
NEC Labs America{huizhang,rhee,nipun,gfj}@nec-labs.com
Abstract
Performance bugs which manifest in a production cloud computing infrastructure are notoriously difficult to diag-nose because of both the difficulty of reproducing those bugs and the lack of debugging information. In this paper, we present PerfScope, apractical online performance bug in-ference tool to help the developer understand how a per-formance bug happened during the production run. PerfS-cope achievesonlinebug inference to obviate the need for offline bug reproduction. PerfScope does not require appli-cation source code or any runtime instrumentation to the production system. PerfScope is application-agnostic, which can support both interpreted and compiled programs running inside a cloud infrastructure.
We have implemented PerfScope and tested it using real performance bugs on seven popular open source server sys-tems (Hadoop, HDFS, Cassandra, Tomcat, Apache, Lighttpd, MySQL). The results show that PerfScope can narrow down the search scope of the bug-related functions to a small per-centage (0.03-2.3%) and rank the real bug-related functions within top five candidates in the majority of cases. PerfS-cope only imposes on average 1.8% runtime overhead to the tested server applications.
Keywords Testing and Debugging, Reliability, Performance
1.
Introduction
It is a notoriously difficult task to diagnose a performance bug [22, 29, 35] that occurred inside a production cloud
com-Permission to make digital or hard copies of all or part of this work for personal or classroom use is granted without fee provided that copies are not made or distributed for profit or commercial advantage and that copies bear this notice and the full citation on the first page. Copyrights for components of this work owned by others than the author(s) must be honored. Abstracting with credit is permitted. To copy otherwise, or republish, to post on servers or to redistribute to lists, requires prior specific permission and/or a fee. Request permissions from [email protected].
SoCC ’14, November 03 - 05 2014, Seattle, WA, USA. Copyright 2014 ACM 978-1-4503-3252-1/14/11. . . $15.00. http://dx.doi.org/10.1145/2670979.2670987
puting infrastructure1. The reasons are multifold. First, it is
difficult, if not totally impossible, to reproduce a production-run performance bug outside the cloud infrastructure be-cause those performance bugs often only manifest under spe-cific conditions (e.g., particular user inputs, certain system configurations, non-deterministic system events). Thus, it is hard to apply existing offline debugging tools such as GDB directly to diagnose those performance bugs that cannot be reproduced outside the production cloud infrastructure. Sec-ond, unlike crash failures, performance bugs often provide little diagnostic information. Many performance bugs even do not produce any error message since they areunexpected by the developer. To exacerbate the problem, it is often im-practical to perform detailed system execution tracing inside the cloud infrastructure due to concerns about prohibitive cost and user privacy. However, a modern server system typ-ically consists of tens of thousands of functions. Searching the buggy functions among tens of thousands of functions without any clue becomes an impossible task in many cases. In this paper, we propose PerfScope, a practical online bug inference tool to help the application developer under-stand why a performance bug occurs in the production cloud computing infrastructure. One big advantage of PerfScope over existing offline debugging tools is that PerfScope does not require production-run bug reproduction by achieving online bug inference. PerfScope also does not require ap-plication source code or any system instrumentation, which makes it practical for production cloud infrastructures. Perf-Scope is application-agnostic, which can be applied to any program (e.g., C/C++, Java, Python, etc.) running inside the cloud system. Our work focuses on diagnosing performance bugs [22] that are defined as software bugs causing perfor-mance anomalies (e.g., software hang, perforperfor-mance slow-down). Performance anomalies caused by other problems (e.g., hardware faults, configuration issues, kernel bugs) are outside the scope of this work.
When a performance anomaly is detected by an existing online anomaly detection tool [16, 37], PerfScope is
trig-1In this paper, we do not distinguish different types of cloud systems (e.g., infrastructure-as-a-service clouds, platform-as-a-service clouds) since we believe that our problem and approach apply to different cloud systems.
public static void copyBytes(…) 76 while (bytesRead >= 0){ 81 bytesRead = in.read(buf); } int doIO(…) 142 return performIO(buf); int performIO(...) 54 return channel.read(buf);
public int read(…)
153 return reader.doIO(...);
Bug related function bytesRead always >= 0
. . .
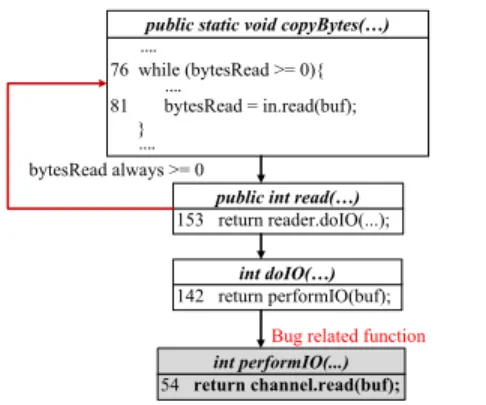
Figure 1. A subset of function call graph for a real HDFS
performance bug. When an input file larger than 2GB is used, the internal variable (int) representing the content length of the input file overflows. This causes the call to
in.read(buf) at line 81 to never return -1 causing an
infinite loop. The bug point is highlighted in bold.
gered to perform online bug inference by analyzing a win-dow (e.g., five minutes) of recent system call traces collected on the faulty server pinpointed by a component-level fault localization tool [14, 30]. The rationale behind our approach is twofold. First, a system call trace can be easily collected via kernel tracing tool2such as Linux Tracing Tool next
gen-eration (LTTng) [18] in production cloud computing infras-tructures with low overhead. Moreover, compared to other low-level tracing tools (e.g., hardware performance counter monitoring tool [34]), the system call tracing tool works in virtualized environments, which makes it suitable for virtu-alized cloud infrastructures. Second, we observe that perfor-mance anomalies are often caused by anomalous interactions between the application and the kernel. Since applications use system calls to interact with the kernel, we can detect anomalous application-kernel interactions by closely moni-toring system calls. For example, Figure 1 shows a real per-formance bug in the HDFS system: an overflow issue causes thewhileloop to never end. This buggy execution produced 1.4 million system calls. As we will show in Section 4, we find that over 90% buggy functions produce system calls by performing static analysis over 228 real performance bugs.
However, it is a challenging task to identify bug-related functions from the massive, noisy raw system call traces. First, we need to develop efficientonlinesystem call trace analysis algorithms that can quickly identify the anomalous system call sequences from millions of system calls. Sec-ond, we need to develop fast and robust algorithms that can accurately map those anomalous system call sequences to specific bug-relatedapplication functions. Since our goal is to support different applications (e.g., both compiled and in-terpreted programs), we cannot rely on the program counter
2Unlike the user level system call tracing tools such as ptrace [3], our experiments show that the kernel-based system call tracing only imposes on average 1.8% overhead to the tested server applications.
information to trace back to the application functions, which does not work for interpreted programs and some compiled programs using certain compilation optimizations.
To address those challenges, PerfScope first uses light-weight unsupervised learning techniques to identify anoma-lous system call sequences. Since the system call trace for a multithreaded server program is often huge, we first segment the raw system call trace into fine-grained units of closely related system calls calledexecution units. We then charac-terize different execution units using various features (e.g., system call appearance vector, system call execution time vector, system call frequency vector). Next, we use a hybrid anomaly detection scheme (i.e., hierarchical clustering plus outlier detection) to identify abnormal execution units.
PerfScope then uses those abnormal execution units as clues to identify the bug-related functions. We propose a signature-driven approach that creates a robust signature for each application function offline outside the production computing environment. Each function signature maps the function into a set ofclosed frequent system call episodes (e.g., sys write, *, sys read). When a production-run performance bug occurs, we extract the closed frequent sys-tem call episodes from those anomalous execution units and map those episodes back to a short list of candidate buggy functions using the function signatures. We also pro-vide a ranking to those identified functions based on the abnormality degree observed in those frequent system call episodes. Note that we do not view PerfScope as the final debugging tool. Instead, PerfScope provides the developer with a small number of candidate buggy functions to exam-ine, which makes production-run performance bug diagnosis much more tractable.
Specifically, this paper makes the following contribu-tions:
•We propose an online performance bug inference tool that works for production cloud computing environments without requiring offline bug reproduction, application source code, or runtime system instrumentation.
•We present a robust application function signature extrac-tion approach that works for different types of applica-tions (e.g., both compiled and interpreted programs) run-ning inside virtualized computing environments.
•We describe a set of online system call trace analysis algorithms that can quickly process millions of system calls to produce a short list of bug-related functions.
•We evaluated PerfScope usingrealperformance bugs in popular open source systems (Hadoop, HDFS, Casandra, Tomcat, Apache, Lighttpd, MySQL). The results show that PerfScope is effective, which can narrow down the search scope for the bug-related functions to a small percentage (0.03-2.3%). The real bug-related functions are ranked within top five candidates in 8 out of 12 cases and are always ranked within top 15. PerfScope only
imposes on average 1.8% runtime overhead to the tested server applications.
Assumptions:We design PerfScope based on the following
assumptions: 1) Performance bugs manifest as time or fre-quency changes in system calls. As mentioned earlier, over 90% of the real performance bugs we studied generate sys-tem calls; 2) We do not have access to application source code or any other application knowledge; and 3) We assume that function signatures can be profiled offline outside the production environments and remain stable under different inputs, workload intensities, and resource allocation settings. Although we cannot assure that this assumption holds on ev-ery system, our experiments with seven popular server sys-tems under different workload conditions show that our ap-proach is applicable to different types of functions without requiring application specific tuning.
The rest of the paper is organized as follows. Section 2 compares our work with related work. Section 3 describes the design of the PerfScope system. Section 4 presents our experimental evaluation. Finally, the paper concludes in Sec-tion 6.
2.
Related Work
Our work is closely related toTriage[39] since both provide onsite production-run failure diagnosis framework. The key idea of Triage is to use checkpoint-replay with input/envi-ronment modification to perform just-in-time problem diag-nosis by comparing normal runs and failure runs. In contrast, PerfScope does not require repeated replays, which makes PerfScope less intrusive to the production computing envi-ronment. Moreover, PerfScope specifically targets the per-formance bugs, which often do not manifest as code block changes between normal and failure runs. By detecting sys-tem call invocation changes and leveraging the robust func-tion signatures, we can identify the buggy funcfunc-tions more effectively for performance bugs.
X-ray [12] provides automatic diagnosis support for per-formance anomalies caused by inputs or misconfiguraitons. It uses binary instrumentation to track the information flow in order to estimate the cost and the likelihood that a block was executed due to each potential root cause (e.g., config-uration option). However, X-ray cannot diagnose the per-formance anomalies caused by software bugs. Similar to Triage, X-ray also requires replay support in order to of-fload the heavyweight binary instrumentation and analysis outside the production system. In contrast, PerfScope does not require any record and replay to identify the buggy func-tions.
Jin et al.[22] present a study of 109 real world perfor-mance bugs in 5 different systems. By manually checking the patches of known problems, they are able to then build an efficiency rule-based checker which was able to identify pre-viously unknown performance problems in deployed soft-ware. However, the white-box approaches are only suitable
for offline debugging due to the source code requirements. Additionally, existing white-box analysis tools mainly focus on detecting possible performance bugs instead of diagnos-ing a specific production-run performance bug. Directly ap-plying existing bug detectors will lead to large false positives and false negatives as demonstrated by previous work [21].
Fay [19] proposes to use kernel drivers or DLLs along with hotpatching to collect and summarize detailed user-level and kernel-user-level traces without modifying the under-lying system. Fay needs to combine user level and kernel level tracing to diagnose performance problems, imparting up to 280% overhead. In contrast, PerfScope only relies on kernel-level system call tracing, imparting on average 1.8% overhead.
Magpie [13] instruments middleware and packet transfer points to record fine-grained system events and correlates these events using an application specific event schema to capture the control flow and resource consumption of each request. DARC [38] identifies functions that are the main contributors to the latency peaks in a OSProf profile. Al-though both systems can be used to diagnose performance problems, they require instrumentations to the application or the middleware, which is difficult to be deployed in the production environment. In contrast, PerfScope does not re-quire any application or middleware instrumentations, which makes it practical for production computing environments.
Fournieret al.[20] proposed to analyze the blocking be-havior using kernel-level system events for diagnosing per-formance problems in multi-core systems. Similar to PerfS-cope, their approach only relies on the kernel level tracing, which imparts little overhead to the application. However, their approach cannot identify bug related application func-tions that can directly help the developer diagnose the per-formance bugs.
Previous work also explored black-box performance de-bugging schemes. Cohenet al.[15] proposed to use machine learning models to correlate the system-level metrics with the performance anomaly states for system metric attribu-tion. Although black-box approaches are often light-weight and non-intrusive, they can only provide coarse-grained diagnosis (e.g., identifying fault related system metrics). PBI [11] used hardware performance counters along with pre-defined predicates to characterize concurrency and se-mantic bugs for compiled programs. In contrast, PerfScope focuses on performance bugs and can identify bug related functions for both compiled and interpreted programs.
Our previous work, PerfCompass [17], focuses on differ-entiating external faults (e.g., interference from co-located applications) from internal faults (e.g., software bugs) for production system performance anomalies. However, Perf-Compass cannot localize buggy functions. Thus, PerfScope is orthogonal to PerfCompass.
3.
System Design and Implementation
In this section, we present the design and implementation of the PerfScope system. We first describe the offline function signature extraction scheme. We then describe the online bug inference algorithms.
3.1 Offline Function Signature Extraction
We combine dynamic binary instrumentation with frequent episode learning techniques to extract the function sig-natures without requiring application source code. Our scheme constructs robust function signatures by learning whatclosed frequent system call episodes3can be generated by each function. Unlike other alternative approaches using low level system metrics (e.g., execution time, CPU usage) that often vary significantly among different platforms, we found closed frequent system call episodes remain stable un-der different workloads and resource allocation settings as shown by our experiments. Thus, we can perform function signatureoffline outside the production environment with-out requiring the exactly same workload or environment that trigger the production-run performance bug.
3.1.1 Binary-based Function Signature Profiling
To learn what system calls are produced by each function, we correlate thefunction execution listprovided by the dy-namic binary instrumentation tool and the system call trace provided by LTTng based on the timestamp information4.
The function execution list records all the function en-try points and exit points from an executing application. Each entry in a function execution list is in the form{time stamp,enter function fi,thread ID}or{time stamp,
exit function fi, thread ID}. For C/C++ programs,
we use the Pin tool [26] to insert the logging code into the binary to record when a function is called and when it re-turns with a timestamp. For Java programs, we insert hooks into the Java Virtual Machine (JVM) to intercept function invocations as they are being executed, logging when each function is called and when it returns with a timestamp.
Each system call entry consists of a pair of logs: 1)
[timestamp entry]system call name:{procname,ppid,
process ID,thread ID,cpu ID}and 2)[timestamp exit]
sys exit: {procname ppid, process ID, thread ID,
cpu ID}. We can derive the system call execution time by computing the difference between timestamp exit and times-tamp entry.
We then create a dynamic stack of active functions for each running thread to determine which function was active when each system call was generated. When a function is called, we push the function onto the corresponding active
3Closed frequent episodes mean that we only consider the maximum
fre-quent episodes, not any sub-sequence of those frefre-quent closed episodes. 4Although we can also use the dynamic binary instrumentation tool (e.g., the PIN tool) to collect the system call trace directly, those tools do not provide the function origin of each system call by themselves.
S1 sys_write S2 sys_read S2 sys_read S1 sys_write Minimum support = 10 Count: 15 Count: 8 L ev el 2 S1 sys_write S2 sys_read S1 sys_write S1 sys_write S1 sys_write S2 sys_read Count: 3 Count: 4 S1 sys_write S2 sys_read S2 sys_read S2 sys_read S1 sys_write S2 sys_read Count: 3 Count: 5 L ev el 3 S1 sys_write sys_read Count: 20 Count: 25 S3 sys_poll Count: 5 S2 L ev el 1
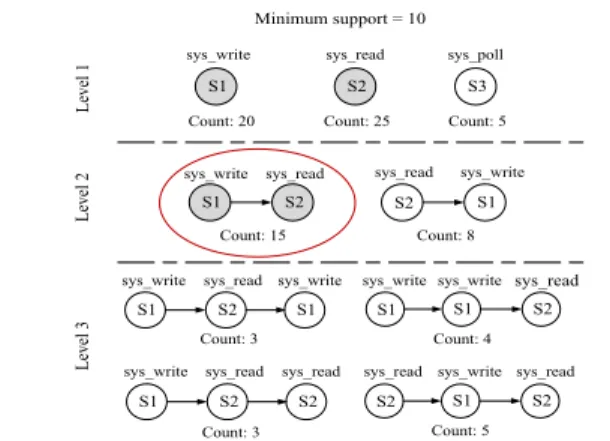
Figure 2. Frequent closed system call episodes discovery.
All the frequent system call episodes (counter >10) are highlighted in gray color. The frequent closed episode is highlighted within a circle.
function stack based on the thread ID associated with the function. When a function returns, we pop the function off the active function stack. Given a system callsiwith a thread
ID tid =k, we compare its exit timestamp Tsi with the timestampTtopof the top function fi on the active function
stack for the same thread tid =k. We also compare Tsi with the timestamp Tnext of the next function fi+1 in the
function execution list. If the system callsioccurs after the
application enters fi but before enters fi+1 (i.e.,Tsi ≥Ttop andTsi<Tnext), we knowsimust have been generated byfi. If we find the exit timestamp of the current system callsiis
larger than or equal to the timestamp of the next function in the function execution list (i.e.,Tsi≥Tnext), we push the next function fi+1onto the stack and label that the system callsi
is produced by fi+1. This process continues until either we
have no more functions to process or no more system calls in the system call trace.
After the annotations for all the system calls are done, we group all the system calls produced by the same func-tion together and sort them based on their timestamps into time ordered sequences. For example, if the system callsys writeannotated with function fi is followed by
sys readannotated with the same function, we add the se-quence{sys write,sys read}into the function profiling result forfi. If a function consists of any branch statements,
the profile of the function may consist of a set of system call sequences (e.g.,{{sys write,sys read},{sys poll, sys futex}}) when different branch paths are executed.
3.1.2 Frequent System Call Episode as Robust
Function Signature
Although we could use the set of the rawsystem call se-quences to represent the signature of the function, we found that those raw system call sequences are sensitive to execu-tion environment changes. Since our goal is to find a robust function signature that is stable under different execution en-vironments, we extractclosed frequent system call episodes
from those raw system call sequences, which can better char-acterize the key distinct behaviors of different applications. During our experiments, we observe that those frequent sys-tem call episodes are quite stable under different execution environments.
We extract closed frequent system call episodes from the raw system call sequences for each function using a common frequent episode mining algorithm called the A-priorimethod [6, 33]. The basic idea of the A-priori method is to start at the basic event type (e.g., a single system call) and then build up more complex sequences by taking all possible permutations using all the frequent episodes at all lower levels (i.e., frequent episodes of smaller size), shown by Figure 2.
The frequent episodes search iterates until a maximum level is reached where no frequent episode can be found. We perform pruning to reduce the number of items to be processed at each level. The intuition behind our pruning scheme is that a frequent episode at a higher level must be a frequent episode at a lower level. So it is only necessary to generate the permutations of the episodes we marked as frequent in the previous level. A minimum support value (L) is usually used to define the frequency lower bound for generating frequent episodes.
Figure 2 illustrates the frequent closed system call se-quence discovery algorithm using a minimum support value L=10. We start from three single system call episodes. We then dropsys pollsince its count does not meet the min-imum support. At the level 2, we search all the permuta-tions of the frequent episodes in the level 1 and identify (sys write,sys read) as a frequent episode. Moving up the level 3, we consider the permutations of all the frequent episodes found in the level 1 and 2. We found four possi-ble permutations and none of them meets the minimum sup-port. We stop the frequent episode search and outputs the (sys write,sys read) as the frequent closed episode.
We implement frequent closed episode frequency count-ing uscount-ing finite state machine (FSM) based matchcount-ing al-gorithm. During the candidate generation phase, we build a FSM for each candidate episode. Each state in the FSM represents a system call type. Given an input system call sequence, we match this sequence with all the candidates’ FSMs simultaneously. When the input system call matches the current state in the FSM, we move the match pointer to the next state in the FSM. If the input system call does not match, we reset the match pointer to the start state. When all the states in the FSM are matched, we increase the frequency counter of the candidate episode represented by this FSM by 1 and reset the match pointer to the start state of the FSM.
In our experiments, we found that if we only consider contiguous frequent episodes, we often only discover trivial system call sequences that cannot help us distinguish differ-ent functions. Thus, we modified our algorithm to discover non-contiguousfrequent episodes such as (sys write,∗,
sys read), where∗represents arbitrary system calls or zero system call. To discover non-contiguous frequent episodes, we only need to make a minor change to the above matching algorithm: if the input system call does not match the cur-rent state in the FSM, we do not reset the match pointer to the start state and wait until the next match occurs.
How to set a proper minimum support value (L) is a tricky issue. We calculate the minimum support value using the standard way of multiplying the number of items (i.e., sys-tem calls included in the execution unitNsys call) with a
cer-tain percentagep [40], that isL=Nsys call×p. In our
ex-periments, we usep=1%. We also conduct the sensitivity study on other possible values ofpto evaluate its impact to our system. The general principle behind the minimum sup-port value selection is that we should not use an overly high minimum support value, which prevents us from finding any frequent episodes; we should also avoid using a trivial mini-mum support value (e.g.,L=1) as this causes us to find too many frequent episodes (e.g., tens of thousands). So we set L=max(min(Nsys call×p,10),2)to cap the minimum
sup-port value at 10 and avoid the trivial minimum supsup-port value. We found our calculation scheme works well for all different systems we tested.
It can be time-consuming to perform the signature extrac-tion for a complex server program consisting of tens of thou-sands of functions. We observe that the function signature extraction for different functions are independent from each other and can run in parallel. So we implement a distributed function signature extraction system to speed up the profil-ing process. Moreover, the function signature extraction is done offline, which will not affect our online bug inference time.
Note that PerfScope also does not require to profile all different function call paths but just individual functions. The function call path of the buggy run is inferred from the system call trace of the production-run directly, which will be explained in Section 3.2. We can also selectively profile a subset of user defined functions and exclude those uninteresting functions such as system libraries. For exam-ple, for C/C++ programs, we can use indexing tools such as cTags [1] to generate the list of profiled functions. For Java programs, we can use package names (e.g., Hadoop, catalina) to select the functions to be profiled.
3.2 Online Bug Inference
Our online bug inference scheme consists of three major steps: 1) extracting different execution units from the raw system call trace; 2) identifying anomalous execution units; 3) mapping anomalous execution units into a rank list of bug related functions. We will describe each step in detail in this section.
3.2.1 Execution Unit Extraction
The system call trace collected by LTTng is a massive stream of mixed system calls produced by different
pro-cesses, threads, and functions. To identify bug-related func-tions, we first need to segment the raw system call trace into a set of execution units. Ideally, each execution unit should consist of a set of semantically related system calls which are produced by the same function, thread, and process. Since the system call trace collected by LTTng provides process ID and thread ID, it is easy to segment the trace into dif-ferent threads/processes. However, during experiments, we found that the thread-based segmentation is sometimes in-sufficient. First, we observe that some server systems (e.g., Apache web server) use a pre-allocated thread pool in order to avoid the overhead of constantly creating new threads. The threads in the thread pool are reused for different tasks, which can cause the behavior of those threads to vary signif-icantly over time. Second, some long running threads often execute multiple different functions. To address this issue, we propose to use thetime gapto split those threads. The intuition is that a large time gap between two consecutive system calls in a thread implies a thread recycling or func-tion switching. Therefore, we compute the intervals between each pair of contiguous system calls in the trace and use the mean+2×standard deviation as the segmentation thresh-old to split the per-thread trace. We found this segmenta-tion threshold works well for all the tested systems and also conducted sensitivity study on this threshold value in the experiments.
During dynamic application runtime, we need to address one issue with the time gap based segmentation. We observe that the context switch between different threads caused by CPU scheduler sometimes creates a time gap between two semantically related system calls. Thus, we need to ignore those time gaps caused by the context switch. Luckily, it is easy to detect context switches in the LTTng collected system call trace. For example, when we detect either a thread ID change or a CPU ID change, we know a context switch has happened.
3.2.2 Abnormal Execution Unit (AEU) Identification
We use light-weight unsupervised learning methods to iden-tify abnormal execution units. We chose unsupervised learn-ing approach because it does not require any labelled train-ing data which are hard to obtain the production environ-ment. Specifically, we use a hybrid anomaly detection algo-rithm that combines hierarchical clustering and outlier de-tection.
We first apply a top-down hierarchical clustering [23] to group those execution units that perform similar operations together. This grouping is important, which can not only in-crease our accuracy but also reduce the processing time as the outlier detection step is more costly. For this purpose, we extract a system call appearance vectorfor each exe-cution unit. The length of the system call appearance vec-tor is equal to the number of unique system call types (e.g., sys write,sys poll) seen across all the execution units. Each system call type is assigned a position in the vector.
The value is set to 1 if that type of system call is present in the execution unit, or 0 if it is not. For example, consider two execution units,{sys write,sys read}and{sys poll, sys read}. In this case, system call appearance vector fol-lows the format of[sys write,sys read,sys poll]. The system call appearance vector for the two execution units would be [1,1,0] and [0,1,1], respectively. We chose the system call appearance vector as the clustering feature vec-tor to achieve robust grouping since two similar execution units might produce different numbers of the same system call type due to dynamic runtime environments.
Next, we perform outlier detection within each cluster to identify abnormal execution units. We observe that the ab-normal behaviors of the affected execution units may man-ifest in both system call frequencies or execution time. For example, a loop bug may cause certain system calls to be ex-ecuted more frequently whereas a synchronization bug may cause the lock acquiring system calls to take longer to com-plete their execution. Therefore we build a system call exe-cution time vector (consisting of average exeexe-cution time for each system call type) and a system call frequency vector (consisting of the count for each system call type) as two features for each execution unit. We use the nearest neigh-bor algorithm [36] to perform the outlier detection. Specif-ically, we compare the Euclidean distance from each exe-cution unit to its nearest neighbor within the cluster using either the execution time vector or the frequency vector. If the nearest neighbor distance of an execution unit is larger than the mean nearest neighbor distance of the whole cluster plus two times the standard deviation, we say this execu-tion unit is abnormal. We observe that some execuexecu-tion units might form a small cluster (e.g., size of the cluster<4) by themselves. It is not meaningful to perform outlier detection within those small clusters. All the execution units in those small clusters are considered to be abnormal.
3.2.3 Bug Related Function List Generation
We now describe how we map those abnormal execution units to bug-related application functions and rank them based on an abnormality degree metric.
For each abnormal execution unitAEUi, we extract a set
of frequent closed system call episodes using the same fre-quent episode mining algorithm described in Section 3.1.2. Let FEAEUi denote the set of the frequent closed system call episode set produced by AEUi. Similarly, our offline
function signature profiling process produces a set of fre-quent closed system call episodeFEfi for each function fi. If any frequent episode inFEAEUimatches with any frequent episode inFEfi, we infer thatAEUimust execute part of the functionfiand output fias one candidate function.
For each candidate function fi, we compute a total count
of all the matching frequent episodes for fi and its
corre-sponding abnormal execution unitAEUi, respectively. If the
total frequent episode count ofAEUiis greater than or equal
System name Num of bugs studied % of bugs generating system calls % of slowdown bugs % of hang bugs Hadoop 40 83% 10% 90% HDFS 32 100% 38% 62% Cassandra 47 85% 28% 72% Tomcat 22 95% 18% 82% Apache 17 100% 41% 59% Lighttpd 10 90% 30% 70% MySQL 60 90% 38% 62%
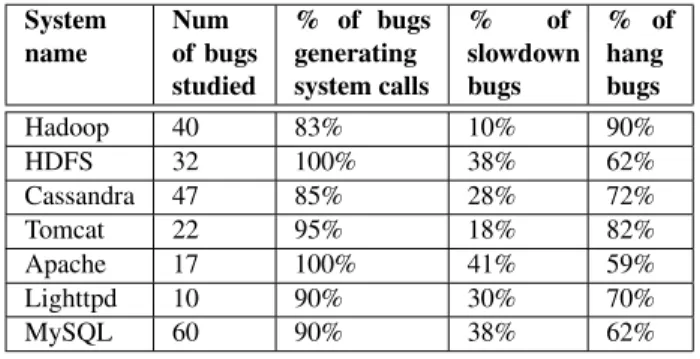
Table 1. Statistics on the real performance bugs we
examined.
fiincorrectly (e.g., an incorrect loop) when the bug is
trig-gered. We then output fias one identified function.
We then calculate a rank score for each identified func-tion using a maximum percentage increase metric (i.e., the largest count increase percentage among all the matched fre-quent episodes between AEUi and fi) to quantify the
ab-normality degree of different functions during the buggy run. We sort all the identified functions using increasing rank scores. We break the tie between two functions with the same rank score using the percentage of matching fre-quent episodes between the function and its corresponding AEU because a higher matching percentage means we are more certain the function was executed by the correspond-ing AEU.
In addition, PerfScope can also infer possible call paths from the system call trace collected during buggy run. For each identified function, we examine the earliest and latest system call timestamps in all matching frequent episodes be-tween the function and its corresponding AEU. Using those timestamps, we can infer the time when each function was active during the buggy run and use that information to cre-ate a time-based ordering among the identified functions. This information can be helpful for developers to further un-derstand how the bug is triggered and propagates in the pro-gram. The developer can also refer to the function call graph that can be extracted via static code analysis to improve the precision of our function call path inference, which however is beyond the scope of this paper.
4.
Experimental Evaluation
We tested PerfScope using seven popular open source server systems: 1) Hadoop [9]: a map-reduce framework; 2) HDFS [9]: a distributed file system; 3) Cassandra [8]: a distributed rela-tional database system; 4) Tomcat [10]: a multi-threaded ap-plication server; 5) Apache web server [7]: a multi-threaded web server; 6) Lighttpd [24]: a light-weight web server; and 7) MySQL [27]: a relational database system. In this section, we first describe our static bug analysis result and the bug samples we could reproduce and use in our experiments. We then present our experiment setup followed by the bug
in-ference results. We then discuss our sensitivity study results followed by the overhead evaluation.
4.1 Real Performance Bug Samples
We searched the bug repositories of each system we tested using performance terms (e.g., hangs, slowdown, etc.) and developer provided performance tags when available. We only examined those bugs which were confirmed by de-velopers and subsequently fixed. Table 1 shows the results of our study. We manually examined each bug, along with any provided patch, to determine what kind of problem the bug caused (e.g., hang, slowdown) and whether the buggy function generated system calls. We found that over 90% bugs generate system calls. We found more hang bugs than slowdown bugs in each system.
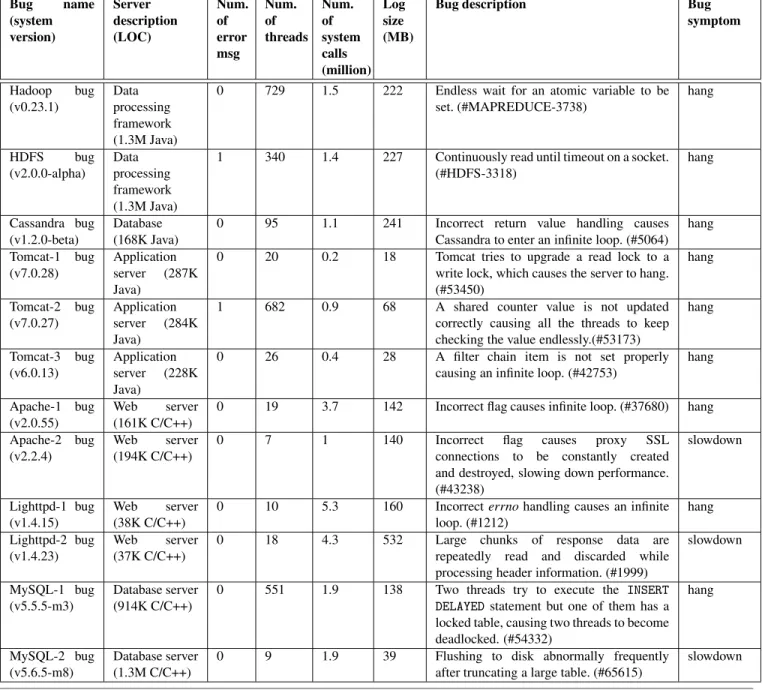
We then try to reproduce each bug by following the instructions in the report and checking that the expected performance anomaly symptoms appeared (e.g., increased response time, 100% CPU usage, system is unresponsive). The bug reproduction is extremely time-consuming and tricky due to limited and often ambiguous information, which sometimes takes a month for us to reproduce one bug. Table 2 lists the 12 performance bugs we could reproduce given our time limit.
Although we only reproduced 12 out of the 228 bugs due to time constraints, the characteristics of the bugs we repro-duced are similar to the other bugs we studied. Specifically, we found most of the bugs we examined involve some kind of loop problem, which is consistent with the observations of previous work [22, 31]. However, the bug points do not always reside in those loops. As we will show later, Perf-Scope can identify those bug-related functions that either include the bug points or are close to the functions that in-clude the bug points. We found that several system hangs were the result of an application component waiting for a response which will never arrive or executing a blocking command without an appropriate timeout value. These types of problems can be difficult to track down. We also found the fix to these types of hang bugs was typically simple (e.g., adding timeout value). Lastly, we found I/O (e.g., file write) and locking operations were the most common system call generating operations. Based on our study, we believe the majority of the system call generating bugs we examined can be correctly handled by PerfScope.
4.2 Experiment Setup
The Hadoop, HDFS, Tomcat, and Cassandra systems were tested on a virtualized cloud test bed where each host is equipped with a quad-core Xeon 2.53Ghz CPU along with 8GB memory and runs 64bit CentOS 5.3 with KVM 0.12.1.2. The Apache, Lighttpd, and MySQL systems were tested on the virtual computing lab (VCL) [5], a production cloud infrastructure where each host has a dual-core Xeon 3.0GHz CPU and 4GB memory, and runs 64bit CentOS 5.2 with Xen 3.0.3. In both cases, each system call trace was
Bug name (system version) Server description (LOC) Num. of error msg Num. of threads Num. of system calls (million) Log size (MB)
Bug description Bug
symptom Hadoop bug (v0.23.1) Data processing framework (1.3M Java)
0 729 1.5 222 Endless wait for an atomic variable to be set. (#MAPREDUCE-3738) hang HDFS bug (v2.0.0-alpha) Data processing framework (1.3M Java)
1 340 1.4 227 Continuously read until timeout on a socket. (#HDFS-3318) hang Cassandra bug (v1.2.0-beta) Database (168K Java)
0 95 1.1 241 Incorrect return value handling causes Cassandra to enter an infinite loop. (#5064)
hang Tomcat-1 bug (v7.0.28) Application server (287K Java)
0 20 0.2 18 Tomcat tries to upgrade a read lock to a write lock, which causes the server to hang. (#53450) hang Tomcat-2 bug (v7.0.27) Application server (284K Java)
1 682 0.9 68 A shared counter value is not updated correctly causing all the threads to keep checking the value endlessly.(#53173)
hang Tomcat-3 bug (v6.0.13) Application server (228K Java)
0 26 0.4 28 A filter chain item is not set properly causing an infinite loop. (#42753)
hang
Apache-1 bug (v2.0.55)
Web server (161K C/C++)
0 19 3.7 142 Incorrect flag causes infinite loop. (#37680) hang Apache-2 bug
(v2.2.4)
Web server (194K C/C++)
0 7 1 140 Incorrect flag causes proxy SSL connections to be constantly created and destroyed, slowing down performance. (#43238) slowdown Lighttpd-1 bug (v1.4.15) Web server (38K C/C++)
0 10 5.3 160 Incorrecterrnohandling causes an infinite loop. (#1212) hang Lighttpd-2 bug (v1.4.23) Web server (37K C/C++)
0 18 4.3 532 Large chunks of response data are repeatedly read and discarded while processing header information. (#1999)
slowdown
MySQL-1 bug (v5.5.5-m3)
Database server (914K C/C++)
0 551 1.9 138 Two threads try to execute the INSERT
DELAYED statement but one of them has a
locked table, causing two threads to become deadlocked. (#54332) hang MySQL-2 bug (v5.6.5-m8) Database server (1.3M C/C++)
0 9 1.9 39 Flushing to disk abnormally frequently after truncating a large table. (#65615)
slowdown
Table 2. Reproduced real performance bugs that are used in our experiments.
collected in a virtual machine using LTTng 2.0.1 running 32-bit Ubuntu 12.04 kernel version 3.2.0.
We use PIN version 2.12 [26] to generate the function sig-nature profiles for Apache, MySQL, and Lighttpd written in C/C++. For Hadoop, HDFS, Tomcat, and Cassandra, we in-strumented the openJDK6 JVM [32] to perform the function signature profiling. The function signature extraction were done under the following workload conditions: 1) Hadoop: we use the Pi calculation application with 16 map and 16 reduce tasks; 2) HDFS: we transferred a 200MB file using hftp; 3) Cassandra: we use a simple workload which creates a table and inserts various entries into the table; 4) Tomcat: we randomly request different example servlets and JSPs
in-cluded with Tomcat following a workload intensity observed in a NASA web server trace [2]; 5) Apache: we use httperf to request various pages from the Apache server; 6) Lighttpd: we use the same workload as Apache and configure Lighttpd to run in multi-process mode; 7) MySQL: we use a open source MySQL benchmark tool called Sysbench [4] and did theoltptest incomplexmode. Note that the workloads we used for profiling are different from the bug-triggering work-loads. We also intentionally vary the resource allocation set-ting for the profiling environment to test the robustness of our function signatures. We found that the workload and resource allocation changes did not significantly affect the frequent episodes generated. For example, varying the
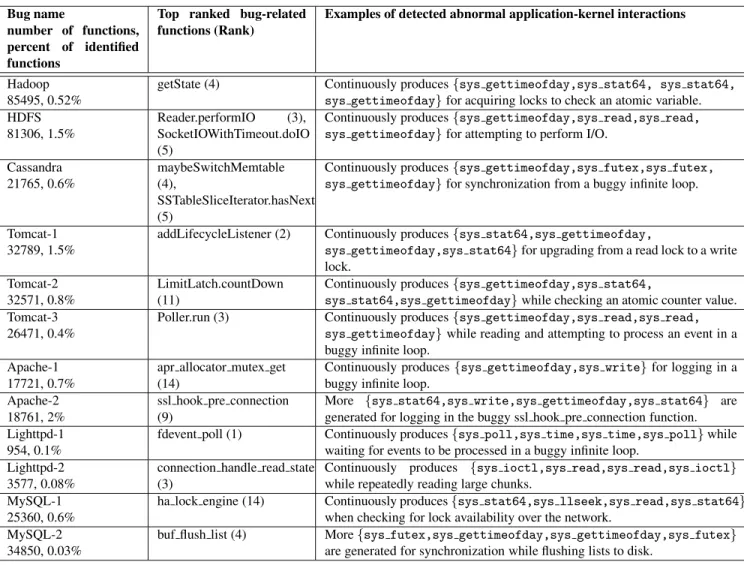
work-Bug name
number of functions, percent of identified functions
Top ranked bug-related functions (Rank)
Examples of detected abnormal application-kernel interactions
Hadoop 85495, 0.52%
getState (4) Continuously produces{sys gettimeofday,sys stat64, sys stat64,
sys gettimeofday}for acquiring locks to check an atomic variable.
HDFS 81306, 1.5%
Reader.performIO (3), SocketIOWithTimeout.doIO (5)
Continuously produces{sys gettimeofday,sys read,sys read,
sys gettimeofday}for attempting to perform I/O.
Cassandra 21765, 0.6% maybeSwitchMemtable (4), SSTableSliceIterator.hasNext (5)
Continuously produces{sys gettimeofday,sys futex,sys futex,
sys gettimeofday}for synchronization from a buggy infinite loop.
Tomcat-1 32789, 1.5%
addLifecycleListener (2) Continuously produces{sys stat64,sys gettimeofday,
sys gettimeofday,sys stat64}for upgrading from a read lock to a write
lock. Tomcat-2
32571, 0.8%
LimitLatch.countDown (11)
Continuously produces{sys gettimeofday,sys stat64,
sys stat64,sys gettimeofday}while checking an atomic counter value.
Tomcat-3 26471, 0.4%
Poller.run (3) Continuously produces{sys gettimeofday,sys read,sys read,
sys gettimeofday}while reading and attempting to process an event in a
buggy infinite loop. Apache-1
17721, 0.7%
apr allocator mutex get (14)
Continuously produces{sys gettimeofday,sys write}for logging in a buggy infinite loop.
Apache-2 18761, 2%
ssl hook pre connection (9)
More {sys stat64,sys write,sys gettimeofday,sys stat64} are
generated for logging in the buggy ssl hook pre connection function. Lighttpd-1
954, 0.1%
fdevent poll (1) Continuously produces{sys poll,sys time,sys time,sys poll}while waiting for events to be processed in a buggy infinite loop.
Lighttpd-2 3577, 0.08%
connection handle read state (3)
Continuously produces {sys ioctl,sys read,sys read,sys ioctl}
while repeatedly reading large chunks. MySQL-1
25360, 0.6%
ha lock engine (14) Continuously produces{sys stat64,sys llseek,sys read,sys stat64}
when checking for lock availability over the network. MySQL-2
34850, 0.03%
buf flush list (4) More{sys futex,sys gettimeofday,sys gettimeofday,sys futex}
are generated for synchronization while flushing lists to disk.
Table 3. Online bug inference result summary.
load intensity from 50 static page requests per second to 125 static page requests per second while building an Apache profile only caused 4% of the generated frequent episodes to change.
During each buggy run, PerfScope is triggered when the performance anomaly is detected by an external detector that checks for reported performance anomaly symptoms such as zero progress score or abnormal response time. Once triggered, PerfScope was run using the recent 1.5 minutes of system call traces for analysis. We can retrieve longer system call trace from an NFS server if needed. However, our experiments show that 1.5 minutes system call trace is sufficient for all the bugs we tested.
4.3 Bug Inference Result Summary
Table 3 shows a summary of our bug inference results for alltested bugs. We can see most server systems we tested consist of tens of thousands of functions. As shown in Table 2, most performance bugs do not produce any error mes-sage and some buggy runs also involve a large number of
threads, it is a daunting task for the developer to figure out why the performance bugs occurred. Profiling by itself can help reduce the search scope as we only profile the functions called the system configuration described in the bug report, which was 0.7% to 10% of the total functions. However, this still equates to thousands of functions to search. The results show that PerfScope can identify a short list of bug-related functions for all tested bugs, which can greatly reduce the search scope to only 0.03-2.3% of total functions. We be-lieve that this search scope reduction can significant expedite the debugging process.
To further validate the effectiveness of our bug infer-ence results, we manually examined the source code of each tested server system to determine whether each of our short lists indeed includes the bug-related functions which can help the developer to locate the bug. We list the top ranked bug-related functions identified by PerfScope in Table 3. We found that the short list of identified functions indeed cover the bug-related functions in all the bugs we tested. We rank the bug-related function within the top five candidates in 8
out of the 12 bugs. In the worst case, we rank the bug-related function at 14. When multiple functions contribute to the problem (e.g., HDFS bug, Cassandra bug), PerfScope can identify them as well. Table 3 also shows one example of abnormal frequent system call episodes detected by PerfS-cope for each bug.
As shown in our results, PerfScope can handle both per-formance degradation bugs and hang bugs. PerfScope works best for detecting those bugs involving a buggy loop (e.g., an infinite loop or a loop iterates more times than usual). Previous work [22] along with our own study have shown most performance bugs do exhibit these characteristics.
We also investigated the cases where PerfScope fails to rank the bug-related function within top 5 and identified two main reasons causing this. First, we found there are some frequent system call episodes which are common to several functions. When the abnormal frequent system call episodes also appear in a function called less frequently than the bug-related function during profiling, this can cause us to rank that function higher than the bug-related function. However, we found most of those mistakenly high-ranking functions (e.g., initialization functions) can be easily filtered out by the developer. Second, we sometimes give high rank to common utility functions (e.g., custom fast comparison function) used throughout the application. When those utility functions are called several times in the buggy function, this can cause the utility function to have a higher rank score than the buggy function. We are currently exploring ways of filtering out those common utility functions.
4.4 Bug Inference Case Studies
To further understand how the output of our bug inference tool can be used for debugging, we now discuss three of our bug inference results in detail. Due to the space limitation, we cannot describe the inference results for all the bugs in detail. We hope that these three case studies can show the usefulness of PerfScope for helping the developer diagnose the production-run performance bugs.
Cassandra bug:This Cassandra performance bug is
re-lated to amemtablemishandling problem. Figure 3 shows a subgraph of the bug’s call graph. The root cause of this bug is theifstatement at line 650 of themaybeSwitchMemtable function. The code block (lines 651 and 652) within the if statement should be executed at least once for every memtable object in order to add the memtable object into the memtable list. However, if a memtable is clean, the check at line 650 will be false, causing the memtable not to be added to the list. As the memtable has not been processed, the check at line 172 in thereloadfunction never becomes true, causing the program never breaks out of the while loop. No error message is produced for this bug.
PerfScope analysis produced 1229 execution units, which were clustered into 49 clusters. Our outlier detection results identified 19 time based outlier units and 33 frequency based outlier units. PerfScope successfully identifies the root cause
public void reload() 168 while(true){
172 if(Memtable.initialComparitor==comparitor) 173 break;
174 Future future = maybeSwitchMemtable(...); }
public Future<?> maybeSwitchMemtable(…) 649 Memtable mt = cfs.getMemtableThreadSafe(); 650 if (!mt.isClean() && !mt.isFrozen()){ 651 mt.freeze();
652 icc.add(cfs); //should be executed at least once } . . . . . initialCompararitor
!= comparitor Bug related function
.
Figure 3. A subset of the call graph for the Cassandra bug.
The bug causes a clean memtable not to be added to the list of memtables, resulting in an infinite loop in thereload function. The bug point is highlighted in bold. PerfScope identifies the root cause functionmaybeSwitchMemtable as the 4th top ranked bug-related function, which is respon-sible for adding all the memtables.
functionmaybeSwitchMemtablefunction as the fourth top ranked function. We found this function produced a set of 30 frequent episodes during profiling. We also found that this function is only called in a limited number of loca-tions. Thus, identifying this function can help the devel-oper quickly localize the problem. The fix to this bug is to force the code block within theifstatement at line 650 of
themaybeSwitchMemtablefunction to be executed at least
once.
HDFS bug: The second bug we discuss in detail is a
HDFS bug mentioned in the introduction, which is caused by an overflow of an internal variable. Figure 1 shows the subgraph of the bug’s call graph. When copying a file using
thedistcpcommand, thecopyBytesfunction is called to
read 4096 bytes from the source stream and write those bytes to the destination stream. This causes theread,doIO, and
performIOfunctions to be called in turn. TheperformIO
function then makes a low level socket call and returns the number of bytes read back. This process is repeated until -1 is returned, signaling the end of the input stream has been reached. When this command is called with a file larger than 2GB in size, however, an internal variable (int) representing the length of the source stream overflows and the end of stream signal (i.e., −1) is never sent. This causes while loop at line 76 of thecopyBytesfunction to never end until the operation times out several minutes later. The only error message generated throughout this process is a message saying the operation timed out. Additionally, as HDFS uses many different interfaces and abstract classes, it is difficult to identify which implementation subclass causes the problem. PerfScope analysis produced 3817 execution units, which were clustered into 174 clusters. Our outlier detection results
int fdevent_poll(…)
33 return ev->poll(...);
static int fcgi_demux_response(…)
2401 if (ioctl(hctx->fd, FIONREAD, &toread)) { 2441 else {
2442 if (errno == EAGAIN) return 0;
Bug related function
int main (…)
1040 while(!srv_shutdown){
1282 if ((n = fdevent_poll(srv->ev, 1000)) > 0) { 1309 r = (*handler)(srv, context, revents)
.
. .
.
static handler_t fcgi_handle_fdevent(…)
3146 fcgi_demux_response(srv, hctx); . . . . . .
Invoked at line 1282 Invoked at line 1309
Figure 4. A subset of the call graph for the Lighttpd bug.
The errno is handled incorrectly, causing the main function to process the same event again and again. The bug point is highlighted in bold. PerfScope identified thefdevent poll as the bug related function which is responsible for control-ling the event processing to continue as long as the number of events (n) is positive.
identified 92 time based outlier units and 113 frequency based outlier units. The third top ranked function PerfScope identified is theSocketInputStream$Reader.performIO function. We found this function produced a set of 30 fre-quent episodes during profiling. As shown in Figure 1, this is one of the functions directly responsible for read-ing data from the input stream and is directly related to the bug. By telling developers not only the function name, but also telling the developer that the bug is related to the
SocketInputStream$Reader class, debugging time for
this problem can be greatly reduced. Additionally, identify-ing that the problem is caused by an infinite loop could help developers immediately rule out other misleading causes, such as a network issue. The fix in this case is to ensure streams larger than 2GB is processed in chunks of appropri-ate size.
Lighttpd-1 bug: The third bug we want to discuss
is a Lighttpd bug shown by Figure 4. The performance anomaly is caused by the if statement at line 1282 of the main function always stays true, causing the code block within the if statement executes forever. During this buggy run, the fdevents function is first invoked at the if statement at line 1282 of the main function. Next, thefcgi handle dfeventfunction is invoked at line 1309, which then calls the fcgi demux response func-tion. The root cause of this problem is an improper errno handling (i.e., settingerrnoto EAGAIN) at line 2442 of
the fcgi demux response function causes this function
to return 0. When the functionfcgi handle fdevent re-ceives a 0 return value fromfcgi demux response, it does not clean up this event from the event queue. This in turn causesfdevent pollto return a value>0, which causes the system to process this same event again and again. No error message is generated during this process.
PerfScope analysis produced 9380 execution units, which were clustered into 7 clusters. Our outlier detection results identified 33 time based outlier units and 31 frequency based outlier units. PerfScope identifies thefdevent pollas the top ranked bug-related function, which controls the event processing code at line 1282 of themainfunction. We found this function produced a set of 900 frequent episodes during profiling. The large number of frequent episodes produced by this function are a result of the variety of tasks it is in-volved with. By starting debugging at this function, devel-opers could quickly see that the same event was being pro-cessed over and over. This information is especially useful for Lighttpd, which has a complex main function respon-sible for performing many different tasks. Furthermore, the function we identify resides in the sameifstatement code block with the root cause function. This means developers would have significantly fewer areas to explore when trying to debug the problem. The fix for this issue would be to ensureerrnois handled appropriately, ensuring the event is processed.
4.5 Sensitivity Study
We conducted sensitivity study experiments to evaluate how different parameter settings affect our bug inference results. Although we omit the results due to space limitations, we found that the parameter values do not significantly affect our bug inference results. We also examined the ranks of the true bug related functions, which also show little changes.
4.6 PerfScope Overhead
Bug name Online bug
inference
Offline function signature extraction
Hadoop 15.99 min 9.5 min HDFS 29.94 min 38 min Cassandra 3.34 min 12.9 min Tomcat-1 5.14 min 42.7 min Tomcat-2 12.34 min 2.9 hour Tomcat-3 2.32 min 48.7 min Apache-1 2.93 min 15.5 min Apache-2 4.3 min 14.4 min Lighttpd-1 9.91 min 1.02 hour Lighttpd-2 5.87 min 1.15 hour MySQL-1 12.8 min 44.5 min MySQL-2 5.22 min 44.5 min
Table 4. Online and offline computation time for PerfScope.
We now evaluate the overhead of PerfScope to differ-ent server systems. For Hadoop/HDFS we ran the Pi sam-ple application. For Cassandra, we ran a database insertion workload. We used httperf to send a number of requests to Tomcat, Apache, and Lighttpd. We used a request rate of 50 requests per second for Tomcat, 100 requests per second for Apache and Lighttpd. For MySQL, we run a constant workload of 20 select requests per second. Those request
rates are set based on the maximum processing capacity of our host. We ran all overhead experiments 5 times, report-ing the mean. We impart an average of 1.8% runtime over-head to the server system. Specifically, we impart 2.97% to Hadoop/HDFS, 3.33% to Cassandra, 1.4% to Tomcat, 0.8% to Apache, 0.3% to Lighttpd, and 2.2% to MySQL. We found Perfscope imparts between 2-3% CPU load and has a small memory footprint (about 256KB). We also found the storage overhead is reasonable, varying between about 18MB to 530MB.
We also ran an experiment to determine how PerfScope overhead scales under different workload intensity by com-paring the overhead of tracing at 50, 75, 100, and 125 re-quests per second to an Apache web server. We found the log size scales linearly with request rate while the overhead of tracing remained constant. We used least squares linear regression to project log sizes for larger request rates. We found that the one-minute tracing log size will be around 450MB given 900 requests per second. Note that this log size can significantly reduced using standard compression techniques, which will be discussed further in Section 5. The low overhead we observed is consistent with the overhead results of previous projects [25]. Hence, we believe that Perf-Scope is light-weight and practical for online bug inference in production cloud computing infrastructures.
We now present the online and offline computation time of PerfScope shown by Table 4. The results show that Perf-Scope can complete the online bug inference within tens of minutes. The majority of the online inference time was spent on extracting the frequent episodes for different anomalous execution units in order to identify the bug-related functions. This time can be further shortened if we use multiple dis-tributed hosts to perform the frequent episode mining. Our distributed offline function signature extraction time ranged from 9.5 minutes to about 2.9 hours as shown in Table 4. These times were obtained by running our distributed sig-nature extraction algorithm on a 7 node cluster and could be further improved on larger clusters. Additionally, as the function signature profiling is performed offline outside the production environment, its overhead will not be a concern for using PerfScope to perform online bug inference.
5.
Limitation Discussion
Although each individual system call log is relatively small and scales well with workload intensity, the overhead of stor-ing traces for many different applications may be significant. In those cases, system call filtering can be used to reduce the trace log size. Assuming prior application knowledge, it is possible to modify PerfScope to only trace certain system call types or to only trace system calls generated by spe-cific threads. We can also apply log compression to further reduce the trace log size. For example, after applying the standard gzip compression, the HDFS log size goes down from 227MB to 19MB.
In practice it may be necessary to move the collected traces from a storage node to a different node for processing, where the cost is dependent on the network bandwidth. How-ever, as the size of each collected trace is relatively small, ranging from about 40MB to about 530MB, we believe these files can be quickly moved from host to host. Additionally, optimizations and log compression can further reduce the cost of moving these logs.
If two functions have identical frequent episode set, PerfScope will not be able to distinguish between them. However, in our experiments, we found this case never happened. Each function always generated unique frequent episodes. For example, as mentioned in the evaluation, the
SocketInputStream$Reader.performIO produced 29
unique frequent episodes.
Our current evaluation is limited to single node server setup. For performance bugs in distributed systems, we be-lieve that PerfScope can help with those bugs by identify-ing the affected functions on each affected component. In addition, performance bugs in distributed systems can also occur as the result of poor interactions between different system components (e.g., incorrect timeout value). Previous work [28] has shown that those bugs also exhibit anomalous application to kernel interactions on the faulty components in the form of either I/O or locking. How to apply PerfScope to distributed system performance bugs is part of our future work.
6.
Conclusion
In this paper, we have presented PerfScope, an online per-formance bug inference tool for production cloud computing infrastructures. PerfScope can identify bug-related functions for both interpreted and compiled programs using light-weight kernel-level system call tracing and online system call trace analysis. We have implemented PerfScope and conducted experiments using real performance bugs in seven popular open source server systems. The results show that PerfScope can successfully identify true bug-related func-tions out of tens of thousands of application funcfunc-tions for all the tested performance bugs. PerfScope is light-weight, which only imposes 1.8% average runtime overhead to the tested server systems.
Acknowledgment
We thank the anonymous reviewers and our shepherd Haryadi Gunawi for their valuable comments. This work was spon-sored in part by NSF CNS0915567 grant, NSF CNS0915861 grant, NSF CAREER Award CNS1149445, U.S. Army Re-search Office (ARO) under grant W911NF-10-1-0273, IBM Faculty Awards and Google Research Awards. Any opinions expressed in this paper are those of the authors and do not necessarily reflect the views of NSF, ARO, or U.S. Govern-ment.
References
[1] Exuberant Ctags.http://ctags.sourceforge.net/. [2] The IRCache Project.http://www.ircache.net/. [3] Linux process trace (ptrace).
http://linux.die.net/man/2/ptrace.
[4]SysBench: a system performance benchmark.
http://sysbench.sourceforge.net/.
[5] NCSU Virtual Computing Lab.http://vcl.ncsu.edu/. [6] R. Agrawal and R. Srikant. Fast algorithms for mining
asso-ciation rules. InVLDB, 1994.
[7] Apache. Apache HTTP Server Project. http://httpd.
apache.org/.
[8] Apache Cassandra. Apache Cassandra.http://cassandra.
apache.org/.
[9] Apache Hadoop. Apache Hadoop. http://hadoop.
apache.org/.
[10] Apache Tomcat. Apache Tomcat.http://tomcat.apache.
org/.
[11] J. Arulraj, P. Chang, G. Jin, and S. Lu. Production-run soft-ware failure diagnosis via hardsoft-ware performance counters. In ASPLOS, 2013.
[12] M. Attariyan, M. Chow, and J. Flinn. X-ray: Automating root-cause diagnosis of performance anomalies in production software. InOSDI, 2012.
[13] P. Barham, A. Donnelly, R. Isaacs, and R. Mortier. Using magpie for request extraction and workload modelling. In OSDI, 2004.
[14] M. Y. Chen, E. Kiciman, E. Fratkin, A. Fox, and E. Brewer. Pinpoint: Problem determination in large, dynamic internet services. InDSN, 2002.
[15] I. Cohen, M. Goldszmidt, T. Kelly, J. Symons, and J. S. Chase. Correlating instrumentation data to system states: A building block for automated diagnosis and control. InOSDI, 2004. [16] D. Dean, H. Nguyen, and X. Gu. UBL: Unsupervised
behav-ior learning for predicting performance anomalies in virtual-ized cloud systems. InICAC, 2012.
[17] D. J. Dean, H. Nguyen, P. Wang, and X. Gu. Perfcompass: Toward runtime performance anomaly fault localization for infrastructure-as-a-service clouds.
[18] M. Desnoyers and M. R. Dagenais. The lttng tracer: A low impact performance and behavior monitor for gnu/linux. In Linux Symposium, 2006.
[19] U. Erlingsson, M. Peinado, S. Peter, and M. Budiu. Fay: Extensible distributed tracing from kernels to clusters. In SOSP, 2011.
[20] P. Fournier and M. R. Dagenais. Analyzing blocking to debug performance problems on multi-core systems. InSIGOPS, 2010.
[21] G. Jin, A. Thakur, B. Liblit, and S. Lu. Instrumentation and sampling strategies for cooperative concurrency bug isolation.
InOOPSLA, 2010.
[22] G. Jin, L. Song, X. Shi, J. Scherpelz, and S. Lu. Understanding and detecting real-world performance bugs. InPLDI, 2012.
[23] L. Kaufman and P. J. Rousseeuw.Finding groups in data: an introduction to cluster analysis. John Wiley & Sons, 2009. [24] Lighttpd. Lighttpd.http://www.lighttpd.net/. [25] LTTng Success. LTTng Success. https://lttng.org/
success-stories.
[26] C. K. Luk, R. Cohn, R. Muth, H. Patil, A. Klauser, G. Lowney, S. Wallace, V. J. Reddi, and K. Hazelwood. Pin: building customized program analysis tools with dynamic instrumen-tation. InPLDI, 2005.
[27] MySQL. MySQL.http://www.mysql.com/.
[28] K. Nagaraj, C. E. Killian, and J. Neville. Structured compar-ative analysis of systems logs to diagnose performance prob-lems. InNSDI, 2012.
[29] K. Nagaraja, F. Oliveira, R. Bianchini, R. P. Martin, and T. D. Nguyen. Understanding and dealing with operator mistakes in internet services. InOSDI, 2004.
[30] H. Nguyen, Z. Shen, Y. Tan, and X. Gu. Fchain: Toward black-box online fault localization for cloud systems. InICDCS, 2013.
[31] A. Nistor, L. Song, D. Marinov, and S. Lu. Toddler: detecting performance problems via similar memory-access patterns. In ICSE, 2013.
[32] OpenJDK6. OpenJDK6. http://openjdk.java.net/
projects/jdk6/.
[33] D. Patnaik, S. Laxman, B. Chandramouli, and N. Ramakrish-nan. Efficient episode mining of dynamic event streams. In ICDM, 2012.
[34] perf. Performance counters for Linux.http://perf.wiki.
kernel.org/index.php/Main_Page.
[35] X. Song, H. Chen, and B. Zang. Why software hangs and what can be done with it. InDSN, 2010.
[36] P. N. Tan, M. Steinbach, and V. Kumar. Introduction to Data Mining. Addison Wesley, 2005.
[37] Y. Tan, H. Nguyen, Z. Shen, X. Gu, C. Venkatramani, and D. Rajan. Prepare: Predictive performance anomaly preven-tion for virtualized cloud systems. InICDCS, 2012.
[38] A. Traeger, I. Deras, and E. Zadok. DARC: Dynamic analysis of root causes of latency distributions. InSIGMETRICS, 2008. [39] J. Tucek, S. Lu, C. Huang, S. Xanthos, and Y. Zhou. Triage: Diagnosing production run failures at the user’s site. InSOSP, 2007.
[40] M. J. Zaki. Spade: An efficient algorithm for mining frequent sequences.Machine learning, 2001.