Multi-objective clustering algorithm using particle swarm
optimization with crowding distance (MCPSO-CD)
Alwatben Batoul Rashed a,b,1, Hazlina Hamdan b,2,*, Nurfadhlina Mohd Sharef b,3,
Md Nasir Sulaiman b,4, Razali Yaakob b,4, Mansir Abubakar b,5
a Department of Information Technology, Qassim University, Qassim, Sudia Arabia
b Faculty of Computer Science and Information Technology, University Putra Malaysia, Selangor, Malaysia 1 [email protected]; 2[email protected]; 3 [email protected]; 4 [email protected]; 5 [email protected]; 6 [email protected]
* corresponding author
1.
Introduction
Knowledge discovery from the collection of data is aimed at extracting useful information. The process of knowledge discovery is carried out using several techniques and methods, which include classification, clustering, regression, and summarization [1][2]. Data clustering is considered to be a technically powerful task in an area of data mining and knowledge discovery. It involves partitioning the datasets into a chunk of clusters of similar features [3][4]. The clustering problem involves dividing a set of data into different groups according to their features. The data structure is explored and its objects are grouped into clusters, in which each cluster contains similar objects. As such, objects of a given cluster are very similar with small distances between cluster members, while objects of different clusters A R T I C L E I N F O A B S T R A C T
Article history
Received December 28, 2018 Revised May 29, 2019 Accepted March 30, 2020 Available online March 31, 2020
Clustering, an unsupervised method of grouping sets of data, is used as a solution technique in various fields to divide and restructure data to become more significant and transform them into more useful information. Generally, clustering is difficult and complex phenomenon, where the appropriate numbers of clusters are always unknown, comes with a large number of potential solutions, and as well the datasets are unsupervised. These problems can be addressed by the Multi-Objective Particle Swarm Optimization (MOPSO) approach, which is commonly used in addressing optimization problems. However, MOPSO algorithm produces a group of non-dominated solutions which make the selection of an “appropriate” Pareto optimal or non-dominated solution more difficult. According to the literature, crowding distance is one of the most efficient algorithms that was developed based on density measures to treat the problem of selection mechanism for archive updates. In an attempt to address this problem, the clustering-based method that utilizes crowding distance (CD) technique to balance the optimality of the objectives in Pareto optimal solution search is proposed. The approach is based on the dominance concept and crowding distances mechanism to guarantee survival of the best solution. Furthermore, we used the Pareto dominance concept after calculating the value of crowding degree for each solution. The proposed method was evaluated against five clustering approaches that have succeeded in optimization that comprises of K-means Clustering, MCPSO, IMCPSO, Spectral clustering, Birch, and average-link algorithms. The results of the evaluation show that the proposed approach exemplified the state-of-the-art method with significant differences in most of the datasets tested.
This is an open access article under the CC–BY-SA license.
Keywords
Knowledge discovery Data clustering
Particle swarm optimization K-means clustering Swarm Intelligence
are very distinct based on a similarity measure function. Clustering can, therefore, be considered as an optimization problem.
K-means [5] and Hierarchical [6] clustering algorithms are widely used by researchers and practitioners. K-means algorithm partitions the datasets into a set of k groups of similar entities with predefined k value, while the Hierarchical algorithm builds a tree of clusters. In addition to K-means and Hierarchical, there are many clustering algorithms that perform well in clustering the datasets, such as balanced iterative reducing and clustering using hierarchies (BIRCH) and average-link. BIRCH is a scalable clustering algorithm with regards to the number of objects; it displays good quality in clustering datasets [7]. While the average-link is a hierarchical based clustering in which the difference between two given clusters is defined as a mean distance between each point in a cluster to every point in another cluster. All these aforementioned algorithms are based on a single objective optimization approach. However, optimization of objective functions in some real-world problems requires multiple forms of optimization [2]. Furthermore, some of these classical algorithms have issues in initial centroid selection; they have a low rate in convergence [8] and aggrieved in local optimization.
Swarm-based clustering algorithms have been successful in solving clustering issues [9]-[15]. Particle Swarm optimization is developed based on random distribution. It is a simple method for the search of approximate optimal solutions and requires no much effort in parameter configuration. Complex optimization problems are globally explored with PSO. Even though these algorithms demonstrated high performance, they are simply behind single objective optimizations. Hence, the need for a population-based and robust multi-objective optimization approaches to address multi-objective problems. Multi-objective problems consist of more than one objective but usually in conflict with one another. The distinction of multi-objective optimization algorithms and single-objective optimization algorithms is that in the former, multiple objectives are considered for computing the optimal solutions, as the name suggests. While, in the latter, there is always a single optimum solution [16]. The ability of MOPSO when applied in a population is that it makes it possible for the whole Pareto set to be estimated in one particular run. Several multi-objective clustering algorithms are proposed in the literature to solve the clustering problem [6][17]-[21]. However, some loopholes are identified in the recent works, which include curse of data dimensionality that is encountered in a large dataset as a result of the expected clusters, which is usually a combinatorial problem. Likewise, the selection of global leader may be tedious due to the unique feature in the clustering problem on the Pareto set distribution. These major issues are a serious threat to the realization of clustering in MOPSO in terms of practical performance of the algorithm. In an attempt to address these issues, a multi-objective clustering framework that makes use of Particle Swarm Optimization is proposed by Gong et al. [22]. The method was named Improved Multi-Objective Clustering Particle Swarm Optimization (IMCPSO) framework. Even though, the proposed method provides an improvement in the performance as suggested by its name but however demonstrated a setback in clustering distributions solutions that have a negative effect on the performance of leader selection. Thereby making the optimization model falls into local optima rather than the global optima.
One important step in MOPSO algorithm is the selection mechanism for archive update step, which affects the convergence ability of the algorithm as well as the preservation for the extensions of non-dominating solutions. In this research, we adopted a technique used in Gong et al. [22] with some changes in the selection mechanism. The selection mechanism for archive update in [23]-[26] is designed based on both crowding-distance and Pareto dominance.
The drawback in this selection mechanism is that it has to check dominance to delete dominated solution, then apply the crowding-distance to delete most crowding. In this case, the selection mechanism for archive update is filtered, and this usually leads to loss of information. Thus, a selection mechanism is needed to avoid a fall into local optima rather than the global optima and to have a balance between convergence and diversity. Therefore, this study proposes a mechanism to find the best Pareto optimal where the selection mechanism for archive updates will be modified [27]. Based on their crowding value, the best non-dominated solutions are retained while the remaining dominated solutions are eliminated to guarantee the survival of the best solution.
The paper is structured as follows: Section 2 discusses the proposed methodological approach. The results and discussion are presented in Section 3, whilst Section 4 summarizes and concludes.
2.
Method
2.1.MCPSO-CDIn this section, a Multi-Objective Clustering Particle Swarm Optimization with a modified selection mechanism for the archive update (MCPSO-CD) method is proposed. This approach is grounded on a particle swarm optimization model for a multi-objective problem. This technique consists of the optimization level and decision-making level that is designed for clustering purposes. In the optimization level, an optimal solution for a given clustering problem, known as Pareto solutions, is provided. And each of the solutions is grouped with a different sum of clusters in the embedded form. MCPSO-CD uses these solutions to automatically determine the optimal clusters. The best solution among the solutions is selected by a simple decision-based decision-making level, which is also the case in any Pareto solution to be considered optimal. The process of MCPSO-CD is shown in Fig. 1.
Fig. 1. MCPSO-CD Process Flow
The first step generates the initial population with clustering algorithms to be converted into a clustering solution. After that, the next generation is produced. In each generation, a set of particles, where each particle represents a potential solution, is generated. For each particle, a fitness or objective function is evaluated for each potential solution and then finds a personal best solution. After that, a clustering solution and gbest are updated. The best non-dominated solutions from particles by applying the Pareto dominance concept are found. Pareto dominance classifies solutions as dominated, or non-dominated solutions then update archive by inserting the non-non-dominated solutions based on the proposed modified selection mechanism. It first sort all solutions in archive in descending order based on crowding value then check to delete dominated solution in archive.
2.2.Objective functions
Assuming a clustering solution of a data, different measures of estimation occurs, the target is to locate and select the well separated and dense clusters. Two objective functions are used for that target. First is the overall deviation and second is the mean space of inter-clusters, which can be used to evaluate inter and intra-cluster separation between the clustered groups.
1) Overall deviation
This function determines the general deviation in the intra-cluster size of the data used. In reality, the overall deviation must be minimized. The formulation is given as:
𝐷𝑒𝑣(C) = ∑𝐶𝑘∈ 𝐶𝑘𝛿(𝑖, 𝜇𝑘) (1)
where C is a cluster set, i is a data element, μk is a cluster centroid, and Ck, δ (.,.) is a distance function like Euclidean distance.
2) Mean distance between clusters
The mean distance between the clusters is an objective function that determines the inter-cluster variations between clustered groups. It is computed by the minimum space of the neighboring clusters. The neighbor serves as a local model that emulates the relations of two data points. In this study, the Gabriel graph [28] was applied to attain the relationship in the adjacency of all points of a data. The graph is a sub-graph of the “Delaunay Triangulation” that joins the two data Nodes i and j in which no remaining node k is inside the open sphere with a diameter [i j]. Gabriel graph has a merit in that it can acquire all connected graphs with suitable distances. This objective function is given as follows:
Mdc(C) = 1
|C||∑CK∈C(mini∈Ck,j∈Ni,j∉Ck,δ(i, j)) (2)
where, Ni represents the neighbor set of data i in Gabriel graph, Ck is a distance function like Euclidean distance. Mdc must be maximized as an objective function. To reduce the objective as alike as Dev, the objective value may not be considered (-Mdc).
2.3.Update clustering solution steps
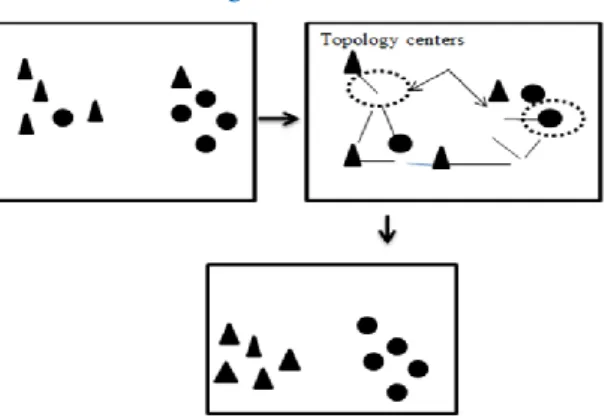
The MOPSO method can easily be affected by the curse of data dimensionality as the datasets increase. Due to this fact, the MOPSO approach can only provide irregular clustering disparity in the process of searching. The MOPSO approach does not consider previous knowledge in the search process. To overcome the challenge, some properties of clustering, as in Gabriel graph and agglomerative clustering, are applied to improve and obtain better solutions as described in the following steps as proposed by Gong et al. [22] and as shown in Fig. 2.
Fig. 2. Particle iteration process
Step 1: The topological centers that are in the partition in Gabriel's graph are determined. It computes a c value of every partition in a clustered solution. Some data with the largest value were
considered to be a topological midpoint. When there was more than the center, it randomly selected the topological center.
Step 2: After selecting the topological midpoint, the agglomerative clustering method applied. It begins with k clusters, where each cluster contained a topology midpoint and other data points required to be reallocated. The succession merged continuously until the entire data points were clustered.
Step 3: The final step optimized clusters are transformed into a new vector particle (update of position and velocity). k is placed in the first vector element, and then group the number corresponding to each data point by dividing it by k and placed them into another N elements.
2.4.The selection mechanism for archive update
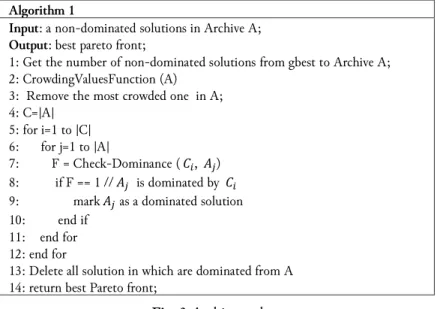
To guarantee the survival of the best solution, we used the Pareto dominance concept after calculating the value of the crowding degree for each solution. The leader selection mechanism will first sort all solutions in an archive in descending order based on crowding value then check to delete dominated solution in the archive as Fig. 3.
Algorithm 1
Input: a non-dominated solutions in Archive A; Output: best pareto front;
1: Get the number of non-dominated solutions from gbest to Archive A; 2: CrowdingValuesFunction (A)
3: Remove the most crowded one in A; 4: C=|A|
5: for i=1 to |C| 6: for j=1 to |A|
7: F = Check-Dominance ( 𝐶𝑖, 𝐴𝑗)
8: if F == 1 // 𝐴𝑗 is dominated by 𝐶𝑖
9: mark 𝐴𝑗 as a dominated solution
10: end if 11: end for 12: end for
13: Delete all solution in which are dominated from A 14: return best Pareto front;
Fig. 3.Archive update
Crowding distance is first sorted in ascending order of the computed objective function values of the set of solutions. A value of crowding distance solution is the average distance between its two neighboring solutions. Infinite crowding distance values were assigned to the boundary solutions that had the lowest and highest values of the objective function such that they are always selected. Across each objective function, this process takes place. The approach then selects a leader for each swarm of a particle according to the leaders’ crowding value. The maximum size of the leaders in the set is set equal to the size of the swarm (or population). After each generation, the set of leaders is updated as the appropriate values for the crowding distance. An illustration of the crowding distance algorithm is given in Fig. 4.
Algorithm 2
Input: a non-dominated solutions in Archive A; Output: Archive A after Crowding ;
1: for m = 1 to M do 2: sort(F, m)
3: F[1]dist = F[N]dist = ∞ 4: for i = 2 to N − 1 do
5: F[i]dist = F[i]dist + (F[i+1].m−F[i−1].m)/ fmax −fmin 6: end for
7: end for
8: return Archive A;
2.5.Decision making
Due to the trade-off among the objective functions, decision making in a residual Pareto set is tedious. However, the sparse coefficient is used to select the particles out of the residue Pareto set. In this study, the sparse coefficient is defined in (3) when entire Pareto solutions are normalized.
sci= (dl.i+ dr,i) 2⁄ (3)
Where, sci is the sparse coefficient of ith Pareto set, and dl.i, dr,i are the Euclidean distances nearer
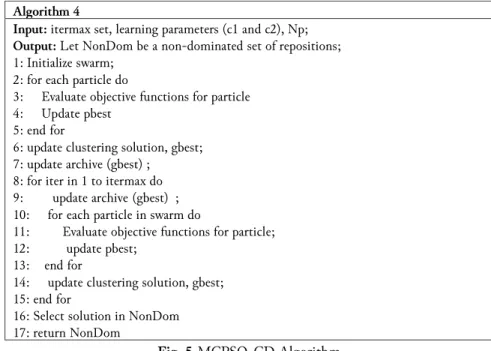
to the right Pareto set and left Pareto solution, respectively. A solution taken is the Pareto solution with a large sparse coefficient. An illustration of the MCPSO-CD algorithm is given in Fig. 5.
Fig. 5.MCPSO-CD Algorithm
3.
Results and Discussion
3.1. Datasets
To obtain an optimum result in the performance analysis of our proposed method, we evaluate the technique with seven datasets. Five datasets are artificially generated datasets as well as two real-world data sets sourced from KEEL (Knowledge Extraction based on Evolutionary Learning) repository, well-known, and being used as benchmark data globally. These datasets have been used in solving particle swarm optimization problems, as presented in many scientific articles [18][29]. Table 1 summarizes the properties of the dataset.
Table 1. Data Set Properties
Dataset D K N Flame 2 2 240 Jain 2 2 373 Path-based 2 3 299 Compound 2 6 399 R15 2 15 600 Glass 9 7 214 House-votes 16 2 232
Note: D = the dimension of the data, K stands as the number of classes presently in the data, and N represents the number of data instances.
Algorithm 4
Input: itermax set, learning parameters (c1 and c2), Np; Output: Let NonDom be a non-dominated set of repositions; 1: Initialize swarm;
2: for each particle do
3: Evaluate objective functions for particle 4: Update pbest
5: end for
6: update clustering solution, gbest; 7: update archive (gbest) ;
8: for iter in 1 to itermax do 9: update archive (gbest) ; 10: for each particle in swarm do
11: Evaluate objective functions for particle; 12: update pbest;
13: end for
14: update clustering solution, gbest; 15: end for
16: Select solution in NonDom 17: return NonDom
3.2. Experimental setup
The parameters of (MCPSO-CD) were configured, and the configuration results of each dataset are recorded and analyzed. Adjusted Rand Index (ARI) [30] was used to measure the accuracy of the clustering since there is a standard label in the dataset. ARI measures the similarity between the generated clusters and true clusters. When the generated clusters and true clusters had a high degree of similarity, the index yielded a high value. The comparison of the experimental is divided into two parts. First, we compare it with the clustering algorithms, K-Means, Spectral, BIRCH, and the Average-Link. These clustering algorithms have been selected as the comparison techniques in Multi-objective clustering with particle swarm optimization problems, as presented in many scientific articles [18][22]. Secondly, we compare it with the state-of-the-art multi-objective clustering algorithms [18][22]. Parameters settings used in MCPSO-CD as in [18] for experimental comparison. The parameter values used in the experiment are: inertia weight (w) = 0.85, learning parameters c1 and c2 are 0.7, number of maximum iterations (itermax) is 500, number of a particle (Np) is 20, and number of maximum clusters (kmax) is15 respectively.
3.3. Comparison with clustering algorithms
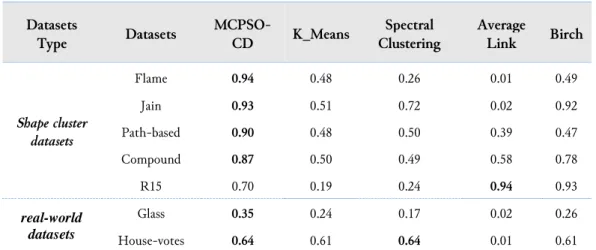
The experimental results of the proposed method, K-means, Birch, and average-link algorithms, were recorded. The performance of the comparison is presented in Table 2. It shows that the method outperformed state-of-the-art techniques in clustering performance. The table shows the clustering algorithms outperformed MCPSO-CD in terms of the ARI index in one dataset (R15) only. Clusters number (R15) was 15, but the kmax of MCPSO-CD was 15, suggesting the reason why MCPSO-CD showed bad performance on (R15) dataset. Furthermore, the performance of MCPSO-CD was better than the baseline clustering methods in one real-world dataset, Glass and remained competitive in the other real-world dataset, House-votes.
Table 2. Results evaluated against other techniques Datasets Type Datasets MCPSO-CD K_Means Spectral Clustering Average Link Birch Shape cluster datasets Flame 0.94 0.48 0.26 0.01 0.49 Jain 0.93 0.51 0.72 0.02 0.92 Path-based 0.90 0.48 0.50 0.39 0.47 Compound 0.87 0.50 0.49 0.58 0.78 R15 0.70 0.19 0.24 0.94 0.93 real-world datasets Glass 0.35 0.24 0.17 0.02 0.26 House-votes 0.64 0.61 0.64 0.01 0.61
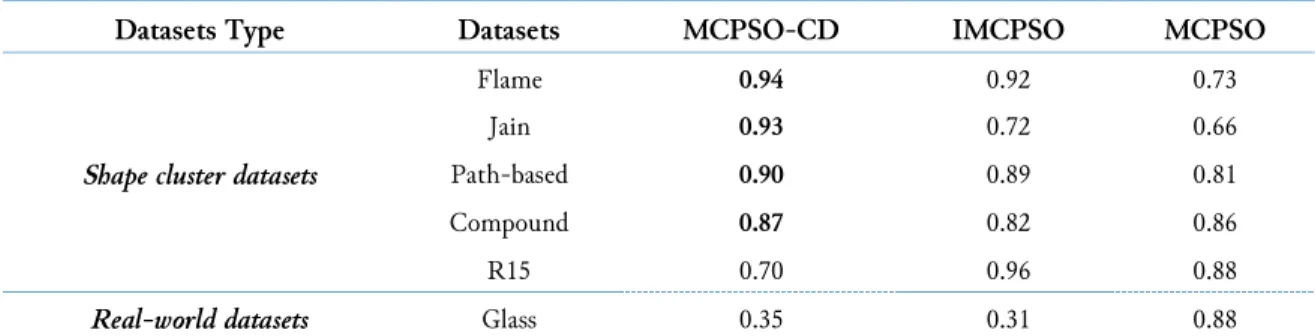
3.4. Comparison with a state-of-the-art multi-objective clustering algorithm
The state-of-the-art multi-objective clustering algorithms were IMCPSO in [22] and MCPSO in
[18]. The comparison made based on ARI, and results are shown in Table 3. The experimental results of the proposed method of MCPSO-CD were recorded.
In a nutshell, MCPSO-CD outperformed other clustering techniques compared in the shape datasets and real-world data by modified selection mechanism for archive update for MOPSO-CD in order to avoid models fall into local optima rather than the global optima. However, as reported in Table 3, the baseline method outperformed the MCPSO-CD in terms of the ARI index in (R15) and (Glass) dataset. It is worth noted that the cluster number of R15 and Glass is the biggest between the other dataset; this is the reason why the MCPSO-CD shows bad performance on these datasets.
Table 3. Results evaluated against other state-of-the-art multi-objective clustering algorithm
Datasets Type Datasets MCPSO-CD IMCPSO MCPSO
Shape cluster datasets
Flame 0.94 0.92 0.73
Jain 0.93 0.72 0.66
Path-based 0.90 0.89 0.81
Compound 0.87 0.82 0.86
R15 0.70 0.96 0.88
Real-world datasets Glass 0.35 0.31 0.88
In summary, the performance of MCPSO-CD outperformed other clustering techniques in the shape datasets and real-world by the improvement of leader selection strategy for MOPSO to avoid models fall into local optima rather than global optima.
4.
Conclusion
Multi-objective PSO is recommended to solve the optimization problem effectively. The present study proposes a possible solution to the clustering problem due to the appropriate number of clusters being unknown. The number of clusters must all be defined to solve the problem, and its objects have to be judiciously assigned. The problems can be addressed by MOPSO with Crowding Distance. Based on the results on crowding distance, it is ideal as a leader selection technique. The results recorded significant improvement compared to the baseline approaches. Although the technique remains competitive in some test cases, it does not signify low performance in the approach since the average accuracy in the method outperformed the average accuracy in the baseline techniques in almost all the affected cases.
Acknowledgment
This work is supported by Universiti Putra Malaysia (Putra Grant No:9569200). References
[1] W. S. B. Alasadi, Suad A., “Review of Data Preprocessing Techniques in Data Mining,” J. Eng. Appl. Sci., vol. 12, no. 16, p. 4102–4107., 2017, available at: Google Scholar.
[2] L. M. Abualigah, A. T. Khader, and E. S. Hanandeh, “A new feature selection method to improve the document clustering using particle swarm optimization algorithm,” J. Comput. Sci., vol. 25, no. September, pp. 456–466, 2017, doi: 10.1016/j.jocs.2017.07.018.
[3] A. Saxena et al., “A Review of Clustering Techniques and Developments,” Neurocomputing, vol. 267, pp. 664–681, 2017, doi: 10.1016/j.neucom.2017.06.053.
[4] M. Bateni and S. Lattanzi, “Affinity Clustering : Hierarchical Clustering at Scale,” Adv. Neural Inf. Process. Syst., p. 6864–6874., 2017, available at: Google Scholar.
[5] G. Gan and M. K. Ng, “k -means clustering with outlier removal,” Pattern Recognit. Lett., vol. 90, pp. 8– 14, 2017, doi: 10.1016/j.patrec.2017.03.008.
[6] B. Reddy, C. K., & Vinzamuri, “A survey of partitional and hierarchical clustering algorithms,” in DATA CLUSTERING Algorithms and Applications, 2018, pp. 87–110, doi: 10.1201/9781315373515-4.
[7] P. Ruppel, A. Küpper, B. Lorbeer, A. Kosareva, B. Deva, and D. Softi, “Variations on the Clustering Algorithm BIRCH,” Big data Res., vol. 11, pp. 44–53, 2018, doi: 10.1016/j.bdr.2017.09.002.
[8] S. Rana, S. Jasola, and R. Kumar, “A review on particle swarm optimization algorithms and their applications to data clustering,” Artif. Intell. Rev., vol. 35, no. 3, pp. 211–222, 2011, doi: 10.1007/s10462-010-9191-9. [9] S. K. Bharne, P. K., Gulhane, V. S., & Yewale, “Data Clustering Algorithms Based On Swarm Intelligence,”
[10] E. Paoli, A., Melgani, F., & Pasolli, “Clustering of hyperspectral images based on multiobjective particle swarm optimization,” IEEE Trans. Geosci. Remote Sens., vol. 47, no. 12, pp. 4175–4188, 2009, doi:
10.1109/TGRS.2009.2023666.
[11] J. Al Moubayed, N, Petrovski, A., & McCall, “Clustering-Based Leaders ’ Selection in Multi-Objective Particle Swarm Optimisation,” Int. Conf. Intell. Data Eng. Autom. Learn., pp. 100–107, 2011, doi:
10.1007/978-3-642-23878-9_13.
[12] M. Alswaitti, M. Albughdadi, N. Ashidi, and M. Isa, “Density-based particle swarm optimization algorithm for data clustering,” Expert Syst. Appl., vol. 91, pp. 170–186, 2018, doi: 10.1016/j.eswa.2017.08.050. [13] P. Santos et al., “Application of PSO-Based Clustering Algorithms on Educational Databases,” IEEE Lat.
Am. Conf. Comput. Intell., pp. 1–6, 2017, doi: 10.1109/LA-CCI.2017.8285690.
[14] Y. Gupta and A. Saini, “A new swarm-based efficient data clustering approach using KHM and fuzzy logic,” Soft Comput., vol. 23, no. 1, pp. 145–162, 2019, doi: 10.1007/s00500-018-3514-1.
[15] J. Wang, Y. Cao, B. Li, H. Kim, and S. Lee, “Particle swarm optimization based clustering algorithm with mobile sink for WSNs,” Futur. Gener. Comput. Syst., vol. 76, pp. 452–457, 2017, doi:
10.1016/j.future.2016.08.004.
[16] R. Azzouz, S. Bechikh, and L. Ben Said, “Dynamic Multi-objective Optimization Using Evolutionary Algorithms : A Survey,” Recent Adv. Evol. multi-objective Optim., vol. 20, pp. 31–70, 2017, doi:
10.1007/978-3-319-42978-6_2.
[17] S. Mirjalili, J. S. Dong, and A. L. Editors, “Multi-verse optimizer: theory, literature review, and application in data clustering,” Nature-Inspired Optim., vol. 811, no. Springer, pp. 123–141, 2020, doi:
10.1007/978-3-030-12127-3_8.
[18] G. Armano and M. R. Farmani, “Multiobjective clustering analysis using particle swarm optimization,” Expert Syst. Appl., vol. 55, pp. 184–193, 2016, doi: 10.1016/j.eswa.2016.02.009.
[19] Z. Liu, B. Xiang, Y. Song, H. Lu, and Q. Liu, “An Improved Unsupervised Image Segmentation Method Based on Multi-Objective Particle Swarm Optimization Clustering Algorithm,” C. Comput, vol. 58, no. 2, pp. 451–461, 2019, doi: 10.32604/cmc.2019.04069.
[20] E. Mezura-montes and N. Cruz-, “Improved multi-objective clustering with automatic determination of the number of clusters,” Neural Comput. Appl., vol. 28, no. 8, pp. 2255–2275, 2017, doi: 10.1007/s00521-016-2191-1.
[21] S. E. L. Khediri, A. Dallali, and A. Kachouri, “Multi Objective Clustering Algorithm for Maximizing Lifetime in Wireless Sensor Networks,” J. Netw. Technol., vol. 8, no. 4, pp. 109–120, 2017, available at:
Google Scholar.
[22] C. Gong, H. Chen, W. He, and Z. Zhang, “Improved multi-objective clustering algorithm using particle swarm optimization,” PloS one, vol. 12, no. 12, pp. 1–19, 2017, doi: 10.1371/journal.pone.0188815. [23] J. Al Moubayed, N, Petrovski, A., & McCall, “D2MOPSO: MOPSO based on Decomposition and
Dominance with Archiving using Crowding Distance in Objective and Solution Spaces,” Evol. Comput., vol. 22, no. 1, pp. 47–77, 2014, doi: 10.1162/EVCO_a_00104.
[24] Q. Zhu, Q. Lin, W. Chen, and K. Wong, “An External Archive-Guided Multiobjective Particle Swarm Optimization Algorithm,” IEEE Trans. Cybern., vol. 47, no. 9, p. 2794–2808., 2017, doi:
10.1109/TCYB.2017.2710133.
[25] E. J. of O. R. Lin, Q., Li, J., Du, Z., Chen, J., & Ming, Z., “A novel multi-objective particle swarm optimization with multiple search strategies.,” Eur. J. Oper. Res., vol. 247, no. 3, pp. 732–744, 2015, doi:
10.1016/j.ejor.2015.06.071.
[26] A. Pan, L. Wang, W. Guo, and Q. Wu, “A diversity enhanced multiobjective particle swarm optimization,” Inf. Sci. (Ny)., vol. 436–437, pp. 441–465, 2018, doi: 10.1016/j.ins.2018.01.038.
[27] A. B. R. A, H. Hamdan, N. Sulaiman, N. M. Sharef, and R. Yaakob, “Multi-Objective PSO-fuzzy Optimization Approach to Improve Interpretability and Accuracy in Medical Data,” Int. J. Eng. Technol., vol. 7, pp. 316–321, 2018, available at: Google Scholar.
[28] S. Kayal and N. Evin, “An adaptive neighbourhood construction algorithm based on density and connectivity,” Pattern Recognit. Lett., vol. 52, pp. 17–24, 2015, doi: 10.1016/j.patrec.2014.09.007.
[29] A. Abubaker and A. Baharum, “Multi-Objective Particle Swarm Optimization and Simulated Annealing in Practice,” Appl. Math. Sci., vol. 10, no. 42, pp. 2087–2103, 2016, doi: 10.12988/ams.2016.64159.
[30] V. Robert and V. Brault, “Comparing high dimensional partitions, with the coclustering adjusted rand index,” arXiv Prepr. arXiv1705.06760, 2017, available at: Google Scholar.