2019 International Conference on Computer and Information Sciences (2019 ICCIS) 978-1-5386-8125-1©2019 IEEE
Concept-based and Fuzzy Adaptive E-learning:
Case Study
M esfer Al Duhayyim Engineering and Informatics School
University of Sussex Brighton, United Kingdom M [email protected]
Abstract— The purpose of this study is to design an efficient adaptive e-learning system that uses a fuzzy logic technique to produce two adaptive mechanisms. A coloured concept map to show the learner's knowledge level for each concept in the topic and a ranked concept list of learning materials to address weaknesses in the learner’s understanding. This system will obtain information on a learner's understanding of concepts by an initial pre-test before the system is used for learning and a post-test after using the learning system. The aim of this research is to show that such a suggested novel adapted e-learning system will improve a learner's knowledge, understanding, motivation and engagement. In addition, this research aims to increase participants' overall learning level and effectiveness by providing a coloured concept map of understanding followed by a ranked concepts list of learning materials. To evaluate the effectiveness of the proposed system a pilot study has been conducted with the Multimedia Design and Applications course at the University of S ussex in Brighton, UK. According to the study results, the proposed system provided positive results for the students who used both adaptive group and non-adaptive control group and validated the system and methodology used.
Keywords— Adaptive E-learning System, coloured concept map, fuzzy logic, ranked concept list.
I. INT RODUCT ION
E-learning is commonly used for web-based instruction to allow learners to access online courses through the internet [1], [2]. The benefits of e-learning systems have been addressed in many previous investigations [3]; however, there are several limitations of existing e-learning systems. Key issues with traditional e-learning are that each learner views the same learning content and is provided with the same learning style; there can be a lack of feedback and tutor interaction in the learning process [4]. The lack of feedback is one of the critical e-learning issues that could limit the user’s learning. In the worst cases, this limitation can make the learners stop using the e-learning system or even drop the course [5]. The lack of tutor interaction is another critical issue in e-learning systems, where the students may have different knowledge levels or preferred learning styles [3].
Various adaptive techniques have been used in adaptive e-learning systems in different forms to provide adaptation services to the e-learning environment. Adaptation e-learning techniques answer three fundamental questions in adaptive e-learning systems: What can they adapt? To what can they adapt? How can they adapt? They have been used in different aspects of e-learning environment to provide adaptivity and personalization. For example, some researchers have used adaptive techniques to determine the knowledge level of an individual student. Others have used an adaptive mechanism to identify the learning styles and preferences of each learner.
Paul Newbury
Engineering and Informatics School University of Sussex Brighton, United Kingdom
Adaptive algorithms have been used to evaluate and adapt the learning content for each student based on his/her performance. Therefore, many adaptive techniques have been employed in the last decade, such as concept maps, fuzzy logic, expert system, Bayesian network, overlay model, stereotypes, big data techniques etc. to provide an effective adaptation system in the learning process [6], [7], [8], [9], [10], [11], [12].
In this paper, concept maps and fuzzy logic are used as adaptive techniques which are applied to an e-learning system to achieve this adaptivity. A concept map is a method of denoting relationships between ideas, images, or words. There are many uses of concept maps, such as stimulating the generation of ideas, brainstorming, communicating comple x ideas [6]. Concept maps are used in the field of education, for instance, in assessing learner knowledge of learning goals, concepts, and the relationship between those concepts. There are two key uses of concept maps. For instance, they are used to show the structure of learning materials in a hierarchal style [13], and they are also used to capture the understanding of the student of those materials.
The concept map has been used in many research projects to help the students learn and motivate them when tackling challenging topics, such as engineering drawing [14]. The findings of this piece of research showed that the concept maps helped the students to understand how to correspond the shapes to the appropriate sides of a Socket Head Screw, they could improve their work by using 3-D animations with immediate step-by-step instructions and apply it to students with both low spatial ability and high spatial-ability. Others have used the concept map to calculate the student’s knowledge about a specific topic automatically [15]. However, they have mentioned that due to the large number of students who have used their system, the system needs improvement, and needs a powerful tool to handle any number of data usage. An adaptive intelligent system called OPCOMITS has been developed based on a concept map model to organise the topic in the hierarchal approach to measure the student’s knowledge about a topic and to animate learning [13]. The experimen t gained positive results for a computer programming course, but it is not clear if it would work for various other kinds of subject matter, such as sciences, humanities, and foreign languages courses. Concept maps work well with programming courses because they present any hierarchical learning material with prerequisite relationships between the concepts e.g. classes, methods, inheritance, etc. in a visual style that can simply be examined and shared. The research mentions improvements to this investigation are needed by using data mining techniques such as Bayesian Networks,
fuzzy logic theory, decision tree, etc. to perform enhancements by identifying the prerequisite relationship between the concepts. By using these adaptive techniques, the experts of the course can add the suitable content based on the student's performance and arrange the concepts and the relationships between them. In this paper, instead of using the weight of relationships between the concepts and question [13], the concept weights itself is used, and the prerequisite concepts are based on the concept impact value after the students take the pre or post-tests during the system usage.
A fuzzy logic system is used in combination with a pre-test to evaluate the student’s knowledge level for each concept in the domain and produce a ranked concept list of learning materials to address weaknesses in the learners understanding. Fuzzy logic was introduced by [16] as a method for computing with words [17]. Fuzzy logic is a design of multi-valued logic that enables intermediate values between regular evaluations such as true/false, yes/no, high/low, and big/small. Ideas such as rather tall or very fast can be declared mathematically and treated by computers to apply a more human-like approach of thinking in computer programming [18, 19]. Fuzzy logic theory labels reasoning in the circumstances of real-life uncertainty. For example, the phrase “only slightly understood” may be represented as a score, e.g., between 65 and 75 as well as the phrase “understood fairly well” could represent the score between 80 and 90 in the field of learning environment [20, 21].
Many researchers have used fuzzy logic to determine and update the student’s knowledge level model for each domain concept [22], [23], [24], [25], and to personalise and recommend a learning path to be followed by the students based on their learning evaluation [7], [26]. In particular, authors in [22] have used fuzzy logic integrated into the student model, and four fuzzy sets for defining student knowledge of a domain concept have been identified as: Unknown (Un): the degree of progress in the domain concept is from 0% to 60%. Unsatisfactory Known (UK): the degree of achievement in the domain concept is from 55% to 75%. Known (K): the degree of success in the domain concept is from 70% to 90%. Learned (L): the degree of success in the domain concept is from 85% to 100%. They did not justify the percentages of the degree of the achievement in the domain concept especially with “Unknown” notation and this seems higher than would normally be expected. Authors in [26] have developed an educational application module fuzzy knowledge state definer (FuzKSD) to implement and evaluate a web-based education that performs individualised instruction on the field of programming languages (C Programmin g language). The system’s evaluation showed that the incorporation of fuzzy sets with overlay and stereotype models significantly provides to the adaptation of the learning process to the learning movement of each learner. FuzKSD supports the students that previously understood the aspects of computer programming to save time and effort through the learning process. Although they have used more than one adaptive technique such as fuzzy logic, overlay model and stereotype in this system to enhance the adaptively and personalised e-learning, they did not give an overview of their system in general so it has hard to be clear of the structure they used.
Authors in [7] Have built a personalised remedial learning system to support learners after taking an online test evaluation. The fuzzy logic theory has been used to construct a proper learning path based on the learner's misunderstandings found in the chosen quiz. Their system will select the most suitable remedial contents for each learner based on the learning path for each learner in each concept regarding the learners' favourites. The learning path idea in this research is based on the student’s misunderstanding about a particular topic, and it is different from [26] research that the learning path of each learner is based on the difficulty level of each concept. They have noticed from their study investigation that their system could be more usable if they develop the features of teaching websites, including the learning styles, and obtained online teaching contents automatically instead of adding the materials manually. This research examines the personal skill abilities and it recommends a set of courses in adaptive curriculum and plans to the learner. However, they could run an experiment to prove their proposed system. A review of the work above leads this research to offer a proposed system that will provide better results using a combination of concept maps and fuzzy logic.
In this paper, section II presents the system overview and its components. In section III, the adaptation mechanism of the system is presented and how these adaptive techniques work and delivered the learning materials based on the students' knowledge levels. In section IV, the methodology of the research is presented, and its assessments used to test the results of the students. Section V presents the outcome of the experiment while section VI presents the discussion of the results.
II. SYST EM OVERVIEW
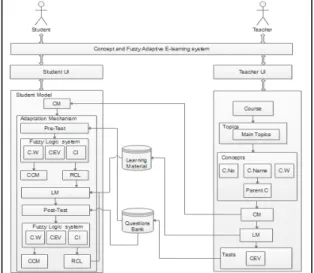
The Concept and Fuzzy Adaptive E-learning system (CaFAE) has been built to enhance learners’ performance and understanding [27]. The structure of the system is shown in Fig. 1. There are three main components in this system; the fuzzy logic system, the coloured concept map (CCM) and the ranked concept list (RCL). Each of these components is explained in this paper in more detail due to its importance in the system to achieve the adaptation. Teachers and students can use this system, and each one has a separate user interface to interact with the system.
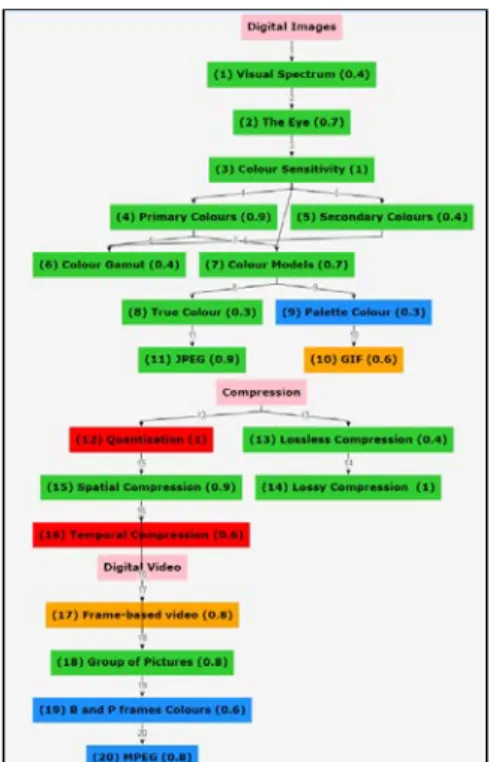
At the beginning of using the system, teachers can login into the system within this interface, and create courses, main topics, related concepts of each topic and add learning materials (LM), and store this in the Learning Material database. To construct a concept map (CM) of the course as shown in Fig. 2, teachers are able to determine the concept number (C.No), concept weight (C.W) which is explained in detail in the fuzzy logic system section, concept name (C.Name) and parent of the concepts (Parent.C) if needed. They can also create pre-and post-tests to evaluate the learner’s understanding level of each concept in the topic and store it in the Questions Bank database. To do so, concept error values (CEV), which is explained in detail in the fuzzy logic system section, must be specified when the teachers create the tests.
At first, learners enroll into two groups; the adaptive group which is the experimental group and the non-adaptive group which is the control group. Then, both groups take an initia l pre-test before learning the materials to evaluate their knowledge levels of each concept in the topic. The non-adaptive group students are given access to all the learning materials with no structure. However, in the adaptive group, a fuzzy logic system is used in the pre-test evaluation to evaluate the learner’s knowledge level for each concept in the domain and construct a coloured concept map (CCM) to show the learners their knowledge levels and produce a ranked concept list (RCL) of learning materials (LM) to address their misconceptions in the learners’ understanding. Learners have to follow their ranked concept list to learn the material in different formats (text, audio and video). After using the system to learn the materials, both groups take a post-test to measure their abilities of understanding the concepts, but in the adaptive group, the concepts are presented with a revised coloured concept to show their understanding levels of each concept. The system mechanism is described in detail in the next section.
Fig. 2. Course concept map for the Multimedia Design and Application course.
III. ADAPT ATION MECHANISM
The purpose of the pre-and post-test is to assess the learners' knowledge level of the concepts for the module. To calculate both tests, two input variables are determined, Concept Weight (C.W) and Concept Error Value (CEV), and one output variable Concept Impact (CI) which are explained in detail in the fuzzy logic system section. The teacher of the course is responsible for giving these two input values in the phases of creating the concepts and tests. The CI variable is used to give output values to be arranged in the ranked concept list (RCL) after submitting the pre-or post-test. The teachers can create an unlimited number of questions with multiple choice question type. Each question is related to one concept in the topic to determine the knowledge level of the students in each concept, and the students are allowed to choose only one choice for each question. Each choice of each question could be one of the knowledge level categories (Learned, Known, Unsatisfied k nown, and Unk nown). Each choice has its own error value determined by the teacher.
After submitting the pre-or post-test, students receive two major components in this system. They can display their coloured concept map to discover their knowledge levels for each concept in the domain as shown in Fig. 3, and they can follow their ranked concept list based on their results of the pre-test. Therefore, the system represents the knowledge level category via a colour representation of the concept map shown in Fig. 3 based on the student’s answers to the pre-test and post-test. Students can follow their own learning level in terms of concepts through this map. Concepts with knowledge levels are indicated as “Learned” with green, “Known” with blue, “Unsatisfied known” with orange, “Unknown” with red.
Fig. 3. Coloured concept map based on the student’s understanding level after taking the pre-test.
Students must follow their ranked concept list based on their pre-or post-test results after completing each test. They will learn the learning material based on the provided ranked list concept by concept until they complete all the concepts in the
topic. After learning all the concepts, they can take a post-test to evaluate their knowledge levels of each concept in the topic.
A. Fuzzy Logic System
In this system, fuzzy logic will be used to assess the learners' knowledge level for each concept in the domain and recommend the suitable learning materials.
To build the fuzzy logic system [28], the problem needs to be specified and the input and output variables and their range determined, fuzzy sets are determined, fuzzy rules are constructed, and fuzzy inference is performed. Based on these tasks, we follow these following steps:
For this system, there are three main linguistic variables: concept weight C.W, concept error value CEV as input variables, and concept impact CI as an output variable.
• Concept Weight (C.W): The concept weight variable C.W is the first input variable, and it is considered the most important factor of the learning process environment because it determines which is the most important concept which must be understood before learning the other related concepts in the topic. In this system, each concept has its own weight which is determined by the teacher of the course, and the range values of the concept weight is between (0.0 and 1.0). Therefore, when the concept weight reaches the value (1.0), the concept becomes the most important amongst related concepts in the topic. On the other hand, when the concept weight has a smaller value than the others, it becomes a less important concept between the related concepts. For this study, in the fuzzy logic system, there are three linguistic values Small, Medium, and Large, and each linguistic value has its range of fuzzy values (0.0 to 0.4), (0.3 to 0.8) and (0.7 to 1.0) respectively to show the importance of learning a specific concept.
• Concept Error Value (CEV): The concept error value CEV is the second input variable, and it is derived from the student’s answer from the pre or post-test in the beginning or at the end of the course. As mentioned previously the CEV has four linguistic values Learned, Known, Unsatisfied Known, and Unk nown, and each linguistic value has its own range of fuzzy values (0 to 25), (20 to 50), (45 to 75) and (70 to 100) respectively to determine the knowledge level of each concept in the domain for each student.
• Concept Impact (CI): The concept impact value is an output variable, and is a result of the input variables C.W and CEV calculation using MATLAB Fuzzy Logic Toolbox from the MathWorks [28]. This value will be obtained from each question. Therefore, we will have 20 concept impact values. All these values will be arranged into the ranked concepts list in different methods. Therefore, we categorise the output values based on MATLAB Fuzzy Logic Toolbox result, and CI has three linguistic values Small, Medium, and Large, and each linguistic value has its range of fuzzy values (0 to 35), (25 to 70) and (60 to 100) respectively to be arranged in the ranked
list from which students can learn the appropriate related concepts in a topic.
A fuzzy set is a set of objects with fuzzy boundaries such as low, medium or high for concept’s level of understanding. To assign a fuzzy set, the proposed system represents it as a function and then maps the elements of the set to their degree of membership. The ideal example in fuzzy sets in the proposed system is an unknown concept. The elements of its fuzzy set “unknown” are all weak or unknown concepts, but their degrees of membership are based on their levels. Standard membership functions applied in fuzzy expert systems are triangles and trapezoids.
After defining the input and output variables with their fuzzy sets, the proposed system addresses the fuzzy rules as in Fig. 4, and the only one who can build the fuzzy rules is the teacher because they already know how the problem can be solved using all the linguistic variables with their terms. Fuzzy rules are used to take personal knowledge. A fuzzy rule is a conditional statement in the form (IF x is A, THEN y is B) where x and y are linguistic variables, and A and B are linguistic values defined by fuzzy sets. Therefore, there are three concept weights and four concept error values which produces 12 possible rules shown in Fig. 4. For example, IF the concept weight is Medium AND the concept error value is Known THEN the impact of the concept is Small.
Fig. 4. Fuzzy rules inference using MATLAB fuzzy Logic Toolbox
B. Rank ed Concepts List
After completing the pre-test, students receive their concept impact values derived from the questions’ answers. To arrange the ranked concepts list (RCL), the priority to be the top of the list to be learned first is the highest concept impact value from all the concept impact values, and then the smaller values until the smallest value to be the last concept to be learned. However, if two or more concept impact values are equal and have the same value, then we compare between the concept weights (C.W) of these equally concept impact values (CIV), and the highest concept weight value (C.W) between these concepts will be the priority to be learned first. However, if two or more concepts have equal concept impact values (CIV) and equal concept weight values (C.W), then we compare between the concept error values (CEV) of these equally concept impact values (CIV) and equal concept weights (C.W), and the highest concept error value (CEV) between these concepts will be the priority to be learned first. Finally, if two or more concepts have equal concept impact values (CIV), equal concept weight values (C.W) and equal concept error values (CEV), then the priority to be learned first is based on the concept number (C.No) in the ranked concepts list (RCL).
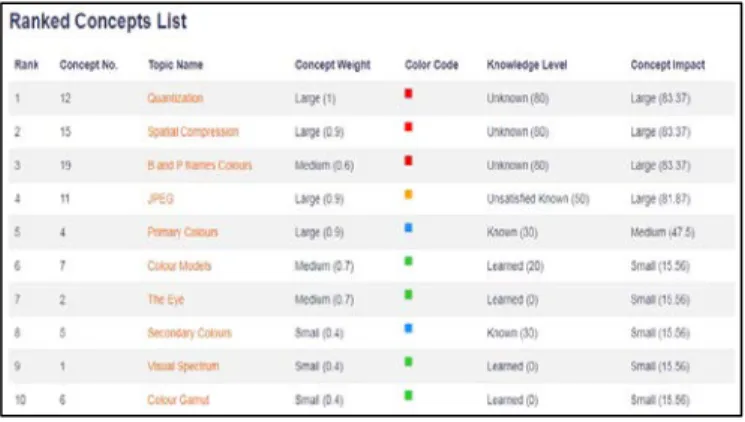
Fig. 5. Ranked Concepts List based on Knowledge level of a student
As shown in Fig. 5, an example of the ranked concepts list process and how it works. By looking at the Concept Impact in the top of the list, the value is 83.37, and because the first three concepts have the same concept impact value (83.37), then the comparison between them to what is the priority to be learned first is the value of the Concept Weight. It is clear that the “Quantization” concept is the first concept in the top according to its high weight value (1.0) while “Spatial Compression” is the second concept (0.9) and then “B and P frames Colours” is the third concept with the value (0.6). However, if there are concepts that have the same Concept Impact and Concept Weight, then the priority to be learned first is based on the Knowledge Level “Concept Error Value” how much value the student got wrong in that concept. For example, “Colour Models” and “The Eye” have the same Concept Impact (15.56) and Concept Weight (0.7), then the “Colour Model” will be learned first because the student has Concept Error Value (20) in this concept while the “The Eye” has (0) Concept Error Value. In case of the three values (CI, C.W and CEV) have the same values, then the concept that should be learn is based on the Concept Number according to the curriculum settled by the teacher of the course.
IV. MET HODOLOGY
A. Research Hypotheses
H1: At pre-test level, there will no significant difference in knowledge level between the adaptive and the non-adaptive groups
H2: Post-test, the adaptive group will significantly out-perform the non-adaptive group in knowledge level
H3: In each of the groups separately and combined, the post-test scores will be significantly higher (better) than the pre-test scores.
H4: Less time will be taken to learn the concepts and answer post-test questions by those using adaptive e-learning than by those using non-adaptive e-learning.
B. Experimental Design:
The CaFAE system (adaptive and non-adaptive platforms) was used to test the hypotheses in the pilot study. Participants were volunteers postgraduate students from the second term and undergraduate third-year students enrolled for Multimedia Design and Application course at the University of Sussex. The location of this experiment was held at the University computer labs. In total, 41 students participated in this experiment, dividing into two groups; 20 students belonged to
the adaptive group, and 21 to the non-adaptive group. The participants had been assigned randomly to the groups.
V. FINDINGS
In hypotheses analysis, we used the Two-Independent Sample Test Mann-Whitney and Two-Related-Sample Test Wilcoxon signed-Rank with different significance levels α =0.05 to obtain 95% confidence levels [29]. The probability of wrongly rejecting a hypothesis (Type 1 error) will then be equal to α, or 5 times out of 100. The results presented in the findings section which were analysed using the ‘SPSS’ statistical analysis software package (V24.0). These two measurement tests provide a statistical test of whether or not the means of two groups are likely to be equal. Both questionnaires and hypothesis results will be analysed and discussed in relation to their contribution to the research findings.
A. Pre-Experiment Questionnaire Findings:
The pre-questionnaire evaluates students’ previous experience with using online learning systems in education and adaptive e-learning systems as well that the students used. The results of this questionnaire provide information about user background in e‐learning in general and their previous experiences with using the adaptive e-learnin g systems. This is important in determining the degree of novelty in the learning experience the system can provide.
T ABLE I. PRE-EXPERIMENT QUEST IONNAIRE CLOSED-END QUEST IONS RESULT S
Questionnaire Item Measure Percentage Preferable learning Method Online lecture
T raditional Other
38.5% 46.2% 15.4% T he use of online learning
environment
Yes No
46.2% 53.8% T ime spent using online
learning
Less than 2 hours Between 2 - 4 hours Between 4 - 8 hours More than 8 hours
26% 21% 15% 38% Online learning compared
to traditional lecture Superior Inferior Similar 64% 28% 8% Online learning improve
understanding Yes No 92% 8% T he use of adaptive e-learning Yes No 8% 92%
As can be seen from the Table I above, the majority of students (46%) preferred to learn with the traditional method. However, (38.5%) of the students preferred to lean using the online learning while 15.4% of them preferred learning using exercises, lab or both method together. Although more than half of the students (54%) haven’t used online learning before for personal study, the majority of the students (92%) agreed that the online learning improves understanding. Table I shows that the majority of the students (92%) haven’t used an adaptive e-learning system before.
B. Hypotheses Testing:
In this section, the hypotheses are tested statistically using Independent Sample Test Mann-Whitney and Two-Related-Sample Test Wilcoxon signed-Rank.
T ABLE II. RESULT OF TWO-INDEPENDENT SAMPLE TEST USING MANN-WHITNEY U FOR DIFFERENCES BET WEEN THE MEAN
PRE-T EST AND POST-TEST SCORES OF T HE T WO GROUPS Variable Group N Mean
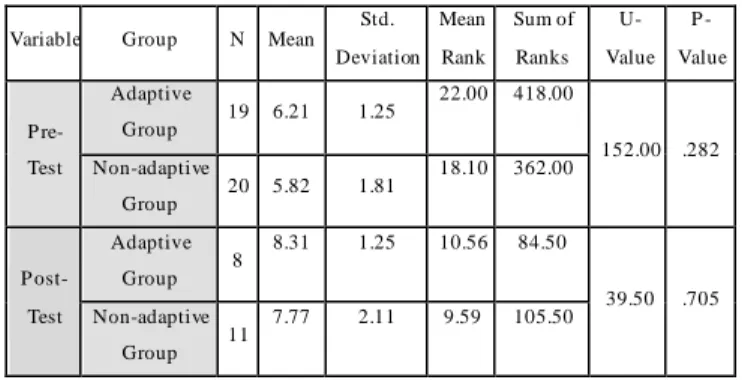
Std. Deviation Mean Rank Sum of Ranks U-Value P -Value P re-Test Adaptive Group 19 6.21 1.25 22.00 418.00 152.00 .282 Non-adaptive Group 20 5.82 1.81 18.10 362.00 P ost-Test Adaptive Group 8 8.31 1.25 10.56 84.50 39.50 .705 Non-adaptive Group 11 7.77 2.11 9.59 105.50
First of all, a Two-Independent Sample Test Mann-Whitney has been used to check whether the two groups had significant differences in the means of their pre-test scores. Table II shows the p-value is 0.282, which is greater than α=0.05. This means that it is confirmed to a 95% confidence level that no statistically significant differences exist between the means of the pre-test scores for the two groups. In that case, this indicates that the first hypothesis is accepted and that the students in each of the two groups are likely to have had the same background knowledge.
Similarly, with the same statistical test, it can be seen in Table II that the p-value is 0.705 which is greater than α=0.05 in the post-test. That means there were not statistically significant differences between the adaptive and non-adaptive groups in the post-test. Although the test was successful as it was able to identify students who have made progress in their studies. However, these results were not very encouraging due to lack of a large sample size of students due to some factors which are discussed in the Discussion section. Therefore, the second hypothesis is rejected.
T ABLE III. RESULT OF T WO-RELATED-SAMPLE T EST USING WILCOXON SIGNED-RANK FOR COMPARISON BET WEEN T HE T WO TESTS MEANS PRE-TEST AND POST-TEST SCORES WIT HIS
T HE SAME GROUP Variable N Mean Std. Deviation Mean Rank Sum of Ranks Z-Value P -Value P re-Test 39 6.01 1.55 15.50 15.50 -3.214** .001 P ost-Test 19 8.00 1.77 9.69 174.50
* P ost-Test < P re-Test, ** P ost-Test > P re-Test, *** P ost-Test = P re-Test,
To test the third hypothesis the ‘Two-Related-Sample Test Wilcoxon signed-Rank’ was performed to find out if there is a statistically significant difference, to a 95% confidence level, between the mean pre-test scores and the mean post-test scores within the same group. The results of this post-test are shown in Table III where it may be seen that the mean post-test score was 8.00 which is greater than the mean pre-post-test score of 6.01. The p-value is 0.001 which is less than α = 0.05. Therefore, it can be concluded that the difference between these two means is statistically significant to a 95% confidence level. Based on the above tests of significance, the third hypothesis is accepted.
As can be seen in Table III, a significant difference can be found in the result of Paired Sample t-test which shows the difference between pre-test and post-test scores of the
adaptive group, non-adaptive group, and both groups (p-value 0.000, P<0.001). According to this finding, the post-test score means (8.15) of the adaptive group, non-adaptive group (6.28), and both groups (7.22) using CaFAE system are higher than pre-test score means (3.80), (3.87), and (3.84) respectively. Therefore, it can be inferred that the difference between these two means (pre-test and post-test) is statistically significant to a 99.9% confidence level. This indicates that the e-learning system (CaFAE) has an important impact on improving the learning progress of students.
T ABLE IV. RESULT OF TWO-INDEPENDENT SAMPLE TEST USING MANN-WHITNEY U FOR DIFFERENCES BET WEEN THE MEANS
T IME SPENT IN ANSWERING T HE PRE-TEST , LEARNING T HE MAT ERIALS, AND T HE POST -TEST OF THE T WO GROUPS Variable Group N Mean SD Mean
Rank Sum of Ranks U-Value P -Value P re-test Answering Time Adaptive Group 19 19.68 9.80 20.42 388.00 182.00 .822 Non-adaptive Group 20 19.25 10.96 19.60 392.00
Learning Time Adaptive Group 8 49.25 23.18 9.88 79.00 21.00 .247 Non-adaptive Group 8 30.12 25.39 7.13 57.00 P ost-test Answering Time Adaptive Group 8 10.37 9.31 9.88 79.00 43.00 .934 Non-adaptive Group 11 21.54 34.13 10.09 111.00
In the fourth hypothesis, the participants who completed the study in a one-time period for both groups were analysed to make sure they were active and manipulate with the learning materials during the experiment. To examine this hypothesis, a Two-Independent Sample Test Mann-Whitney is conducted to find the differences between the mean time spent on learning materials and time spent in answering the pre-test and post-test of the two groups. Results are shown in Table IV where it can be seen that the p-value is 0.247, which is greater than α = 0.05. This indicates, to a 95% confidence level, that there was not a statistically significant difference between the two groups in time spent learning the materials . In addition, results can be seen that the p-value is 0.822 in the pre-test and p-value is 0.934 in the post-test, which are greater than α = 0.05. This indicates, to a 95% confidence level, that there was not a statistically significant difference between the two groups in time spent answering the pre-test and post-test. According to the above tests of significance, the hypothesis H4 is rejected.
The test results suggest that both groups (adaptive and non-adaptive) are likely to have benefited significantly from the learning experience with respect to the case study based on the pre-test and the post-test scores. In comparison between the results of the pre-test in both groups (adaptive and non-adaptive groups) and the results of the post-test of the same
groups, both groups had increased their results in the post-test with more benefits to the adaptive group.
Fig. 6. Percentage Gain from Pre-test to Post-test Scores for both Groups As shown in Fig. 6, the adaptive group had an average increase of 56% in the post-test, whereas the average score of the non-adaptive group increased by 44%. The results revealed that the adaptive group had higher average scores in post-test rather than the non-adaptive group.
According to the findings of the pre-test, post-test scores, and time spent in answering both tests with time spent learning the concepts, first and third hypotheses are accepted while the second and the fourth are rejected. The fourth hypothesis due to an unmanageable time of the experiment because of the server issues encountered in the study. In general, both the adaptive and non-adaptive systems improve the understanding level of students.
C. Post-Experiment Questionnaire Findings:
The students were asked to illustrate many characteristics including their attitude and behaviour towards using the adaptive e-learning systems. Due to the small number of students (9 out of 20 students) who completed the post-experiment questionnaire, the findings were not analysed, but it is worth to present their responses. Most of the students’ responses were positive and satisfied using the system. Responses regarding the Ranked Concept Map:
"The failed ones and the ones I almost got right were presented to me. I wasn't aware there were topics I had "almost" understood, and it was good to see this."
“The rank ing was well made for me and the information was concise enough that it didn't feel dull learning."
Responses regarding to the coloured concept map:
"The Coloured concept map helped me feel far far less hopeless - i.e if I get a low score for a topic, I can see, thanks to the map, that this one topic is not necessarily connected to other topics. This helps me feel far less demoralized." “It showed which areas needed to be work ed on and the required topics on top of them to understand in order to work on them"
From the results above, it is very likely that the students found the system including the coloured concept map and ranked concepts list were very helpful tools in their learning compared to other tools.
VI. DISCUSSION
The experiment ran successfully as it was able to identify students who have made progress in their studies based on their tests’ results and their feedback and comments in the post-experiment questionnaire. However, these results are only indicative due to the small sample size of students due to some factors. In fact, many issues influenced the successful implementation of the experiment in a theoretical pattern. One of the main obstacles was that the pilot study took place at the end of the term and the number of participants was small sample size because it was at the same time of course assignments and submission. As a result of this delay, the experiment conducted two months before the final exams in May 2018, so some students mentioned that in person they did not have enough time to use the entire system. This lack of participation certainly affected the results of the experiment as findings haven't been statistically significant in some hypotheses. In addition, industrial action at the same time as the pilot study running lead to a smaller number of participants attending and taking part in the study than expected.
However, the main objective of running the pilot study is to test the system functionalities and to test the hypotheses and this was considered successful. All the hypotheses have been examined statistically. The test results indicate that both groups are likely to have benefited significantly from the learning experience with respect to the case study based on the pre-test and the post-test scores.
Although there was not a statistically significant difference between the two groups in the post-test scores and Hypothesis 2 was rejected, the adaptive group had an average increase of 56% in the post-test, whereas the average score of the non-adaptive group increased by 44%. Fig. 6 demonstrates the percentage of mean gain scores for each group in the post-test. The results reveal that the adaptive group had higher average scores in post-test rather than the non-adaptive group. The results of hypotheses, as explained in the findings section, show the overall change for each group from pre-test to post-test. The adaptive group post-test had the higher significant difference from the pre-test rather than the non-adaptive group post-test which showed a lower significant difference from the pre-test.
VII.CONCLUSION
The paper discussed the proposed adaptive e-learning system (CaFAE) effectiveness. A pilot study has been run to evaluate the system functionalities and how the system is contributing to increasing the student's performance and engagement. Although there were not statistically significant differences in some hypotheses findings, some students revealed their satisfaction with the system and how the system improved their ability and performance in the post-experiment questionnaire.
For the future work, the system will be revised based on the difficulties and obstacles that have been identified in the pilot study. In addition, the students' feedback will be taken into consideration in the next phase of developing the system. 56%
44%
percentage of mean gain scores
Adaptive Group Non-adaptive Group
Indeed, we are planning to run a full study with an expected large number of students to test the system.
REFERENCES
[1] Akscyn, R.M., D.L. McCracken, and E.A. Yoder, KMS: a distributed hyperm edia system for m anaging knowledge in organizations. Communications of the ACM, 1988. 31(7): p. 820-835.
[2] Moore, J.L., C. Dickson-Deane, and K. Galyen, e-Learning, online learning, and distance learning environments: Are they the sam e? The Internet and Higher Education, 2011. 14(2): p. 129-135.
[3] Liaw, S.-S., Investigating students’ perceived satisfaction, behavioral intention, and effectiveness of e-learning: A case study of the Blackboard system. Computers & Education, 2008. 51(2): p. 864-873.
[4] Conlan, O., D. Dagger, and V. Wade. Towards a standards-based approach to e-Learning personalization using reusable learning objects. in Proc. of World Conference on E-Learning, E-Learn. 2002.
[5] Pechenizkiy, M., et al. Mining the student assessm ent data: Lessons drawn from a sm all scale case study. in Educational Data Mining 2008. 2008.
[6] Vanides, J., et al., Concept maps. Science Scope, 2005. 28(8): p. 27-31.
[7] Hsieh, T .-C., M.-C. Lee, and C.-Y. Su, Designing and im plementing a personalized rem edial learning system for enhancing the programming learning. Educational Technology & Society, 2013. 16(4): p. 32-46.
[8] Stansfield, J.L., Wum pus Advisor I. A First Im plementation of a Program That Tutors Logical and Probabilistic Reasoning Skills. AI Mem o 381. 1976.
[9] Rich, E., User m odeling via stereotypes. Cognitive science, 1979. 3(4): p. 329-354.
[10] Liebowitz, J., Expert system s: A short introduction. Engineering Fracture Mechanics, 1995. 50(5): p. 601-607.
[11] Ben‐Gal, I ., Bayesian networks. Encyclopedia of statistics in quality and reliability, 2007.
[12] Birjali, M., A. Beni-Hssane, and M. Erritali, A novel adaptive e-learning m odel based on Big Data by using competence-based knowledge and social learner activities. Applied Soft Computing, 2018. 69: p. 14-32.
[13] Dogan, B. and E. Dikbıyık, OPCOMITS: Developing an adaptive and intelligent web based educational system based on concept m ap m odel. Computer Applications in Engineering Education, 2016. 24(5): p. 676-691.
[14] Violante, M.G. and E. Vezzetti, Design of web-based interactive 3D concept m aps: A prelim inary study for an engineering drawing course. Computer Applications in Engineering Education, 2015. 23(3): p. 403-411.
[15] Awati, M.A.S. and A. Dixit, Automated Evaluation Framework for Student Learning using Concept Maps. 2017.
[16] Zadeh, L.A., Fuzzy sets. Information and control, 1965. 8(3): p. 338-353.
[17] Zadeh, L.A., Fuzzy logic= com puting with words. IEEE transactions on fuzzy systems, 1996. 4(2): p. 103-111. [18] Hájek, P., What is m athematical fuzzy logic. Fuzzy sets and
systems, 2006. 157(5): p. 597-603.
[19] Zadeh, L.A., Making com puters think like people [fuzzy set theory]. IEEE spectrum, 1984. 21(8): p. 26-32.
[20] Yen, J., L. Wang, and C.W. Gillespie, Im proving the interpretability of TSK fuzzy m odels by com bining global learning and local learning. IEEE T ransactions on fuzzy Systems, 1998. 6(4): p. 530-537.
[21] Zimmermann, H.-J., Fuzzy set theory—and its applications. 2011: Springer Science & Business Media.
[22] Chrysafiadi, K. and M. Virvou, Evaluating the integration of fuzzy logic into the student m odel of a web-based learning environment. Expert Systems with Applications, 2012. 39(18): p. 13127-13134.
[23] Chrysafiadi, K. and M. Virvou, A knowledge representation approach using fuzzy cognitive m aps for better navigation support in an adaptive learning system. SpringerPlus, 2013. 2(1): p. 81.
[24] Chrysafiadi, K. and M. Virvou, Fuzzy logic for adaptive instruction in an e-learning environment for com puter programming. IEEE transactions on Fuzzy Systems, 2015. 23(1): p. 164-177.
[25] Jeremić, Z., J. Jovanović, and D. Gašević, Student m odeling and assessm ent in intelligent tutoring of software patterns. Expert Systems with Applications, 2012. 39(1): p. 210-222.
[26] Zafar, A. and I. Albidewi, Evaluation study of eLGuide: A fram ework for adaptive e-learning. Computer Applications in Engineering Education, 2015. 23(4): p. 542-555.
[27] Duhayyim, M.A. and P. Newbury, Concept-based and Fuzzy Adaptive E-learning, in Proceedings of the 2018 The 3rd International Conference on Inform ation and Education Innovations. 2018, ACM: London, United Kingdom. p. 49-56. [28] Negnevitsky, M., Artificial intelligence: a guide to intelligent
system s. 2005: Pearson Education.
[29] Field, A., Discovering statistics using IBM SPSS statistics. 2013: sage.