EXERCISE: Introduction to the D3 JavaScript Library for
Interactive Graphics and Maps
Barend Köbben Version 2.1 July 2, 2015
Contents
1 Introduction 2
2 Three little circles – a first attempt at D3 3
2.1 Selecting Elements for script access to the DOM . . 4 2.2 Binding Data . . . 5 2.3 Entering Elements automatically . . . 6
3 A Bar Chart of Population Data 7
3.1 Using D3 data-dependent scaling . . . 9 3.2 Loading external data . . . 9 3.3 Adding an Axis . . . 12
4 Using D3 for maps 13
5 CHALLENGE: Interactively Linking Map and Chart 16
6 References 18
©ITC—University of Twente, Faculty of Geo–Information Science and Earth Observation. This document may be freely reproduced for educational use. It may not be edited or translated without the consent of the copyright holder.
Key points
In this exercise you will discover the basics of using the JavaScript D3 library to build dynamic web pages. You will learn:
1. the principles of using the D3 library 2. D3 selections for DOM access
3. D3 data binding to change the DOM based on data 4. loading external data
5. using D3 scales and axes 6. using D3 for maps
In many cases during these exercises, you will have to type code
! →
(HTML, Python, JavaScript or MapServer configuration code). It’s very easy to make mistakes in such code. HTML code and MapServer map files are not case–sensitive, but JavaScript is: the variable mySomething is different than the variable MySomeThing! Also take care of thespecial character (→) in the code examples we provide:
→ this character means the line should be typed without in-terruption, the move to the next line in our example is only
because it would not fit otherwise. So do not type areturn or enter in this place!
Typing the code of longer listings is usually not necessary: You can copy the code from the filefragments folder in the exercise data. In this folder you will find all code fragments from the exercises in text files with the same names as the listing. Do not copy from
the PDF exercise description!
There are several software tools that can help you: Use a text– editor that is more intelligent than your basic text editor, e.g. on MacOSX and Linux use TextWrangler or medit, on Windows Notepad++.This will provide you with line numbers, automatic
highlighting of recognised HTML and JavaScript keywords, etcetera. Use a modern web–browser: a recent FireFox, Chrome or Opera, or Internet Explore version 9 or higher. These are HTML5 com-patible and have built-in web developer tools. This provides error messages, code views and a JavaScript console, network traffic mon-itoring, etc. . .
For students that intend to do more work on developing interactive web applications (using HTML5, CSS, Javascript, etcetera) there is an Integrated Development Environment available in the ITC software Manager called Webstorm.
1 Introduction
The javascript library D3.js was created to fill a need for web-accessible, sophisticated data visualisation. Its creator is Mike Bo-stock, who started it as a research project for his PhD work and is now its main developer as well as a Graphics Editor for the New York Times.
Until recently, you couldn’t build high-performance, rich internet applications in the browser unless you built them in Flash or as a Java applet. Flash and Java are still around on the internet, and especially for internal web apps, for this reason. D3.js provides the same performance, but integrated into web standards and the Doc-ument Object Model (DOM) at the core of HTML. D3 provides developers with the ability to create rich interactive and animated content based on data and tie that content to existing web page elements. It gives you the tools to create high-performance data dashboards and sophisticated data visualization, and to dynami-cally update traditional web content.
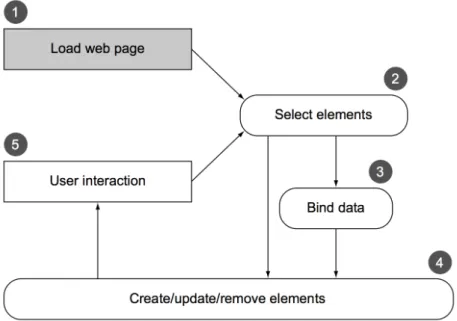
Figure 1: Principle of the use of the D3 library in HTML pages (from Meeks, 2015).
In figure1you see the common use of D3: A page is typically built in such a way that the page loads with styles, data, and content as defined in traditional HTML development [1] with its initial display using D3 selections of HTML elements [2], either with data-binding [3] or without it. The selections and data-binding can be used to modify the structure and appearance of the page [4]. The changes
in structure prompt user interaction [5], which causes new selections with and without data- binding to further alter the page. Step 1 is shown differently because it only happens once (when you load the page), whereas every other step may happen multiple times, depending on user interaction.
Unfortunately, learning D3 is not very easy, because it is not a
charting or mapping library. For example, D3 doesn’t have one single function to create a pie chart. Rather, it has a function that processes your dataset with the necessary angles so that, if you pass the dataset to D3’s arc function, you get the drawing code necessary to represent those angles. And you need to use yet another function to create the paths necessary for that code. It’s a much longer process than using dedicated charting libraries, but the D3 process is also its strength. Although other charting libraries conveniently allow you to make line graphs and pie charts, they quickly break down when you want to make something more than that. D3 allows you to build whatever data-driven graphics and interactivity you can imagine, and that’s why D3 is behind much of the most innovative and exciting information visualization on the web today.
2 Three little circles – a first attempt at D3
Task1: Create an HTML webpage called3LittleCircles.html, and make sure its contents match the code in listing1. As explained in page 1, you can use the text file in thefilefragments folder to avoid having to type it all.
Open the file in a web browser. You will see three circles. We will use these three SVG circles to show you how selectionsand
data-binding in D3 work. • Listing 1: filefragments/3LittleCircles.html <!DOCTYPE html> <html> <head> <script type="text/javascript" src="./lib/d3.v3.min.js"></script> </head> <body>
<svg id="svg" height="100%" width="100%"> <circle cx="40" cy="60" r="10"></circle> <circle cx="80" cy="60" r="10"></circle> <circle cx="120" cy="60" r="10"></circle>
</svg> <script>
// our D3 code goes here... </script>
</body></html>
There are various ways to run D3 code. A very easy way, with immediate results and feedback, is to interactively use the Web browsers’ javascript console (as demonstrated in class). The disad-vantage is that your changes are not saved.
Therefore, in this exercise you will type the code within the (now still empty) script tag in the html file. All the code fragments we show in the coming pages should be entered in there, and then tried out by saving the file and reloading it in the browser. We will
notalways tell you the exact place where to enter the code, this is
for you to figure out. . . !
2.1 Selecting Elements for script access to the DOM
Thed3.selectAllmethod takes a selector string, such as "circle", and returns a selection representing all elements that match the selector:
var circle = d3.selectAll("circle");
The selector string will select all elements in the HTML DOM that match it. There are several types of selector strings, that select:
• by SVGelementname; As in the case above, where we select
all elements of type “circle”: d3.selectAll("div"); • by CSSclass: d3.selectAll(".shaded");
• by HTMLid: d3.selectAll("#myID");
• by combinations, e.g. selecting alldivelements of classshaded: d3.selectAll("div.shaded");
You can useselectAll()to select all elements or simplyselect() to select only the first one encountered. Once we have a selection, we can make various changes to the selected elements. For exam-ple, we might change the fill color using selection.styleand the radius using selection.attr:
circle.style("fill", "steelblue"); circle.attr("r", 30);
If you use the three lines of code shown above, the D3 library sets styles and attributes forallselected elements to the same values. If
you would look at the HTML DOM in its active state (e.g. by using the browser developer tools), you will see the SVG part has been changed to include the style elements (style="fill:steelblue;"). We can also set all values in a selection seperately (on a per-element basis) by usinganonymous functions. Such a function (without
an name, hence the title ’anonymous’) is evaluated once for every selected element. Anonymous functions are used extensively in D3 to compute attribute values. To set each circle’s x-coordinate to a random value,add a line that sets the x-position (cx):
circle.attr("cx", function() { return Math.random() * 500; });
2.2 Binding Data
Of course, changing things at random is not really useful. More commonly, we would want to use existing data to drive the
ap-pearance of our circles. Let’s say we want these circles represent the numbers 500, 150, and 1000. The selection.data method binds the numbers to the circles:
circle.data([500,150,1000]);
Data is specified as an array of values; this mirrors the concept of a selection, which is an array of selected elements. In the code above, the first number (the first datum, 500) is bound to the first circle (the first element, based on the order in which they are defined in the DOM), the second number is bound to the second circle, and so on.
After data is bound, it is accessible as the first argument to the anonymous data functions. By convention, we typically use the namedto refer to bound data. To set the area of the circle accord-ing to the data proportions, use the square root of the data to set the radius:
circle.attr("r", function(d) { return Math.sqrt(d); });
There’s a second optional argument to each function you can also use: the index of the element within its selection. The index is often useful for positioning elements sequentially. Again by convention, this is often referred to asi. For example:
circle.attr("cx", function(d, i) {return i * 100 + 40; });
Task 2 : Now use this mechanism to change the radius and position of the circles based on the data. •
2.3 Entering Elements automatically
What if we had four numbers to display, rather than three? We wouldn’t have enough circles, and we would need to create more el-ements to represent our data. You can append new nodes manually, but a more powerful alternative is theenterselection computed by a data join.
When joining data to elements, D3 puts any leftover data — or equivalently “missing” elements — in the enter selection. With only three circles, a fourth number would be put in the enter se-lection, while the other three numbers are returned directly (in the update selection) byselection.data. By appending to theenter selection, we can create new circles for any missing data.
Taking this to the logical extreme, then, what if we have no existing elements, such as with an empty page? Then we’re joining data to an empty selection, and all data ends up in enter.
This pattern is so common, you’ll often see theselectAll + data + enter + append methods called sequentially, one immediately after the other, chained together using so-calledmethod chaining
(the chaining together of methods by using the . notation): Listing 2: filefragments/4LittleCirclesDatadriven.html.txt <!DOCTYPE html> <html> <head> <script type="text/javascript" src="./lib/d3.v3.min.js"></script> </head> <body>
<svg id="svg" height="100%" width="100%"></svg> <script> var svg = d3.select("svg"); svg.selectAll("circle") .data([500, 150, 1000, 700]) .enter().append("circle") .attr("fill", "steelblue") .attr("cy", 60)
.attr("cx", function(d, i) { return i * 100 + 30; }) .attr("r", function(d) { return Math.sqrt(d); }) ;
</script> </body> </html>
see, we now start with an empty svg and create the circles fully from the data. You now should get four circles! • Note the first line of the script is nowvar svg = d3.select("svg"); and the d3.selectAll was replaced by svg.selectAll. This is done to make sure the newly created circles do not just get ap-pended to the end of the file, but are “attached” to the (until then) empty svg element.
3 A Bar Chart of Population Data
In this section we will make a more elaborate data visualisation: A bar chart of the population of the municipalities of Overijssel province. We will start by looking at some D3 code that creates a simple bar chart from data that is included in the code, in the same way you did in the previous section:
Task 4 : Open the HTML webpage called BarChart.html in a web browser. Study its code carefully (the code is in the html file and also depicted below in listing 3). Try to understand how the code works: How the data is used to set the position of the bars, their width, the text in the bars, and so on. . . Experiment with changing key numbers (such as thexScalevariable) and other parts of the code to see how it influences the visualisation. •
Listing 3: filefragments/BarChart.html <!DOCTYPE html> <meta charset="utf-8"> <html> <head> <style> .chart { background-color: rgb(245,245,245); padding: 5px; } .chart rect { fill: steelblue; } .chart text { fill: white; font: 9px sans-serif; text-anchor: end; } </style> <script src="./lib/d3.v3.min.js"></script>
</head><body> <svg class="chart"></svg> <script> var data = [4, 8, 15, 16, 23, 50]; var svgwidth = 500, barHeight = 20;
svgheight = barHeight * data.length; var xScale = 10;
var chart = d3.select("svg") .attr("width", svgwidth) .attr("height", svgheight) ;
var bar = chart.selectAll("g") .data(data)
.enter().append("g")
.attr("transform", function(d, i) { return "translate→ (0," + i * barHeight + ")"; })
;
bar.append("rect")
.attr("width", function(d) { return xScale * d} ) .attr("height", barHeight - 1)
;
bar.append("text")
.attr("x", function(d) { return xScale * d - 3; }) .attr("y", barHeight / 2) .attr("dy", ".35em") .text(function(d) { return d; }) ; </script> </body> </html>
Some elements we have not seen before are:
• the svggelement (a placeholder to group an arbitrary amount of elements together);
• therectandtextelements, that not surprisingly create rect-angles and texts, respectively;
• the transform attribute. This applies to a (group of) ele-ment(s), the content of the transform string sets the actual transformation: In this case a translate, other possibilities arerotateand scale. In our code, the transform is used to draw each bar at a different position, by translating along the y-axis based on the data index.
• the code at the top (in the <style> tag). This is using the CSS or Cascading Style Sheets language. We will not go much into that in this exercise, it sets the styling of the.chartclass.
3.1 Using D3 data-dependent scaling
A weakness of the code above is the“’magic” number 10 to set the
xScale variable. We use it to scale width of the bars, depending on the data value. This number depends on the domain of the data (the minimum and maximum value, 0 and 50 respectively), and the desired width of the chart (500 = the svg width), but of course these dependencies are only implicit in the value 10, and if the data changes, this numbers should also be changed.
We can make these dependencies explicit and eliminate the magic number by using a linear scale dependent on the actual data. D3’s linear scale specifies a mapping from data space (domain) to display space (range):
var xScale = d3.scale.linear() .domain([0, d3.max(data)]) .range([0, svgwidth]);
Although xScale here looks like an object, it is also a function that returns the scaled display value in the range for a given data value in the domain. For example, an input value of 4 returns 40, and an input value of 16 returns 160. To use the new scale, simply replace the hard-coded multiplication (xScale * d) by calling the scale function in two locations:
bar.append("rect")
.attr("width", function(d) { return xScale(d)} )
bar.append("text")
.attr("x", function(d) { return xScale(d)- 3; })
Task 5 : To understand how this makes scaling flexible, imple-ment the changes imple-mentioned above and experiimple-ment with changing the width of the SVG by changing the number in the line:
var svgwidth = 500,
Notice how the chart adapts to the width available. . . • D3 scales can also be used to interpolate many other types of display-space values, such as paths, color spaces and geometric transforms.
3.2 Loading external data
Another weakness is that the data values are hard-coded in the data array. In real-life use, we often need the data come from
some external source (a downloaded file, or a webservice, or even a sensor device).
To use external data in a web browser, we need to download the file from a web server and then parse it, which converts the text of the file into usable JavaScript objects. Fortunately, D3 has several built-in methods that do both of these things in a single function, for several types of data. Here we will use the d3.csv method. This is used for CSV files, that are plain text files con-taining comma-separated values, tab-separated values or other ar-bitrary delimiter-separated values. These tabular formats are pop-ular with spreadsheet programs such as Microsoft Excel. Each line represents a table row, where each row consists of multiple columns separated by tabs. The first line is the header row and specifies the column names.
Do not open the file from your file–system, but always from the
! →
actual web site, e.g.:
http://win371.ad.utwente.nl/... orhttp://localhost/... This is the only way to properly test your web site! The reason is that browsers are strict on so–called JavaScript cross–domain security, meaning it won’t run JavaScript that is not coming from
the same server as the html. And from the browser viewpoint, a file coming from file:///is from another domain than one from http://win371.ad.utwente.nl/, even if these point to the same file. . . ! Also, the security mechanism usually does not allow loading from harddisk (file:///Z:) anyway. All this is also explained at the D3 site (with some tips on how to install a localhost server): https://github.com/mbostock/d3/wiki#using
Loading data introduces a new complexity: downloads are asyn-chronous. When you call d3.csv, it returns immediately while the file downloads in the background. At some point in the future when the download finishes, your callback function is invoked with the new data, or an error if the download failed. In effect your code is evaluated out of order:
Code here runs 1st, before the download starts. d3.csv("data.csv", function(error, data) {
Code here runs 3rd, after the download finishes. });
Code here runs 2nd, while the file is downloading.
Therefore we need to be sure that all code that needs the data (which in our case is actaully all of the code), is inside the callback function, so that it waits to run until after all data has been loaded. In order to achieve that, let’s “wrap” our existing code inside the
d3.csvfunction:
Task 6 : Create a copy of the HTML webpage BarChart.html you made before, and call itBarChartOverijssel.html.
Replace the line:
var data = [4, 8, 15, 16, 23, 50]; with the lines:
d3.csv("overijssel_population.csv", function(error, data) {
//start of callback function:
And after the last line of the code (just before the</script> state-ment), add the proper closing of the callback function and d3.csv method:
}); //end of callback function •
If you now run the code in your browser, you will get no result, and several error messages in the Javascript console, such as: “In-valid value for <rect> attribute width=’NaN”’. So, what is wrong? Now that our dataset contains more than just a simple array of numbers, each data instance is an objectrather than a number.
The equivalent representation in JavaScript would look not like a simple array, but like this:
var data = [
{gm_code: "GM0141", gm_naam: "Almelo", aant_inw: "72730"}, {gm_code: "GM0180", gm_naam: "Staphorst", aant_inw: "16275"}, ...etc..
];
where gm_codeis the code for the municipality (gemeente),gm_naam is its name andaant_inw is the number of inhabitants.
Thus, if we want to read a data value for number of inhabitants, we must refer to the value as d.aant_inwrather than just d. So, whereas before we could pass the scale xScale(d) to compute the width of the bar, we must now specify the correct data value to the scale: xScale(+d.aant_inw)
Likewise, when computing the maximum value from our dataset in our xScale function, we must pass an anonymous function to d3.max that tells it which data variable to use to determine the maximum:
var xScale = d3.scale.linear()
return +d.aant_inw; } ) ] )
.range( [0, svgwidth] ) ;
In the code examples above, note the use ofxScale(+d.aant_inw),
! →
instead of just xScale(d.aant_inw). This a way to overcome the problem that Javascript has no stricttyping. Thus, if the variable
d.aant_inw is read, we can not be sure it is treated as a number, or maybe as a string. To enforce the treatment of the variable as a number, we “add it to nothing” (by prefixing it with the plus sign). Task 7 : Repair the use of the d value to match the data-structure, as explained above. Test again to see if you now get the correct bar chart for all Overijssel municipalities. •
3.3 Adding an Axis
Task8: The next task is to create a D3 axis. Below we mention the building blocks needed, you should figure out yourself where these should be placed, and test the results in your browser. The final axis should look like the figure below. . . •
D3 has a powerful mechanism to add axes to graphs, charts and maps. We define an axis by binding it to our existing scales and declaring one of the four orientations. If your axis should appear below the bars, you use the "bottom"orientation.
var theAxis = d3.svg.axis() .scale(xScale)
.orient("bottom");
The resulting object (here named theAxis) can be used to ren-der multiple axes by repeated application using selection.call. Think of it as a rubber stamp which can print out axes wherever
they are needed. The axis elements are positioned relative to a local origin, so to transform into the desired position we set the "transform" attribute on a containing g element.
chart.append("g")
.attr("class", "axis")
.attr("transform", "translate(x, y)" .call(theAxis);
The axis container should also have a class name so that we can apply styles. The name "axis" is arbitrary; call it whatever you like. The axis component consists of a path element which displays the domain, and multiple g ".tick" elements for each tick mark. A tick in turn contains a text label and a line mark. Most of D3’s examples therefore use the following minimalist style in CSS: .axis text { font: 9px sans-serif; fill: black; } .axis path, .axis line { fill: none; stroke: black; }
You will also need to make room for the axis below the graph. To do that, you’ll have to make thesvg heightbigger then the height needed for the chart bars alone!
4 Using D3 for maps
In many ways, a map is just another data-driven graphic. So, of course D3 can also be used to create maps. We will use ageosjon file to load a map of the same Overijssel municipalities we have used above. The data was created using the export to geojsonoption in QGIS, such possibilities are available in most GIS software, or from web services such as the one athttp://www.mapshaper.org/ Task 9 : Create a webpage using the code in listing 4. Test it, you should see a basic map, of the municipalities of Overijssel province.
Study the code to see how the map was made using techniques very similar to the BarChart examples before. . . •
Listing 4: filefragments/Map.html.txt <!DOCTYPE html>
<meta charset="utf-8">
<html><head><title>The Graphic Web Locations</title> <script src="./lib/d3.v3.min.js"></script> <style> .mapSVG { background-color: rgb(245,245,245); } .municipality { fill: rgb(255,240,214); stroke: rgb(255,159,227); } </style> </head><body> <div id="mapDiv"></div> <script>
var mapWidth = 400, mapHeight = 350; var mapDiv, mapSVG, svgpath;
// select the mapDiv by id: mapDiv = d3.select("#mapDiv"); // create an svg of fixed size: mapSVG = mapDiv.append("svg")
.attr("class", "mapSVG") .attr("width", mapWidth) .attr("height", mapHeight) ;
// Define Mercator proj to center at data (lon-lat): var myProj = d3.geo.mercator()
.center([6.0 , 52.5]) .scale(10000)
.translate([mapWidth / 2, mapHeight / 2]) ;
//Define svg path generator using the projection svgpath = d3.geo.path().projection(myProj); // asynchronously load geojson:
d3.json("overijssel.json", function (error, myGeoJson) { // create new svg paths:
mapSVG.selectAll("path") // bind the data:
.data(myGeoJson.features).enter() // for each d create a path:
.append("path") .attr("class", "municipality") .attr("d", svgpath) ; }); </script> </body></html>
You should have encountered only a few D3 functions and methods that we did not use before. First of all a projection object:
var myProj = d3.geo.mercator() .center([6.0 , 52.5]) .scale(10000)
.translate([mapWidth / 2, mapHeight / 2]) ;
D3 has a lot of functionality to use geographic data, i.e. data that is expressed as coordinate pairs in longitude and latitude. They are gathered in the d3.geoobject.
Here we use the d3.geo.mercator() function that is a so-called
factory to turn lon-lat coordinate pairs into cartesian projected
coordinates, using the Mercator projection. To specify the projec-tion, here we use the .center, .scale and .translate methods of this projection object to zoom into the Overijssel area. There are a multitude of available projections, seehttps://github.com/ mbostock/d3/wiki/Geo-Projections for examples and explana-tion.
The projection factory is used in turn in another very useful method calledd3.geo.path(). This takes real-world coordinates and trans-forms them into an SVG drawingpaththat uses screen coordinates to fit into an SVG object on the webpage:
svgpath = d3.geo.path() .projection(myProj);
This is then used in the statement .attr("d", svgpath)to load, project and draw the coordinates of each municipality from the dataset.
This dataset was loaded in the line
d3.json("overijssel.json", function (error, myGeoJson) { which works exactly as the d3.csvmethod we used earlier, but now for jsondata.
Task 10 : The map does not really fit nicely in the div. Exper-iment with the projection settings to make the map fit better (as
5 CHALLENGE: Interactively Linking Map and Chart
As anoptional challenge, we ask you to create some interactivity
for the bar chart:
Task 11: The optional challenge task is to create the following:
• A webpage that holds both the Overijssel Bar chart and the municipality map;
• If the user moves the mouse over a bar in the graph, the bar colour changes to red, and the corresponding municipality in the map is also highlighted.
Below we show some of the building blocks needed, you should figure the rest out yourself, and test the results in your browser. . .•
In order to place the graph and map next to each other, you can use different lay-out possibilities. The simplest way of doing that is styling the HTML <div> element we use to hold the map. You can change the creation of the mapDiv we used in the map page, from: mapDiv = d3.select("#mapDiv"); to: mapDiv = d3.select("#mapDiv") .style("position", "absolute") .style("left", "300px") .style("top", "200px") ;
The style properties are expressed using CSS (Cascading Style
Sheets), the styling language standardised by the W3C, the World Wide Web Consortium. The meaning of the properties used is: position: this lets you define positioning absolute or relative to other
divs.
left & top: the (absolute) location with respect to the upper left corner of the window
width & height: the size of the element (in pixels)
overflow: if the content is larger than fits the div, it will not be shown
if this is set tohidden. Other settings arevisible(will over-flow),scroll(will make scrollbars) andauto (let browser de-cide).
border: the border look (width, type and colour). You can also set thefill in a similar way.
As an alternative to creating the style using D3 selectors, you can of course also include a CSS stylesheet to style themapDiv class. Interactivity is triggered by an event connected to the appropriate selection. D3 supports interactivity of all its selections, by the use of selection.on. This adds an event listener to each element in the current selection, for the specified type. The type is a string event type name, such as "click", "mouseover", "mouseout", or "submit". Any DOM event type supported by your browser may be used. The specified listener is invoked in the same manner as any other operator functions, being passed the current datum d and index i, with the this context as the current DOM element, in such a way:
selectedObject
.on("mouseover", function(d) { ... code run per data instance ...
... using d, i, and this, if necessary ... ... e.g. to show information ...
... and to change bar colour ... })
;
The interactivity can of course be improved by having the reverse highlighting also working (mouse in map highlights bar), by having the data displayed, etcetera. We will add a working example to your learning platform (Blackboard) towards the end of the exercise. Good luck puzzling. . . !
6 References
For this exercise we used existing materials from various sources: • The book “D3.js in Action” (2015) – Elijah Meeks, Manning
Publication co. (New York). ISBN: 9781617292118;
• The D3 website at http://d3js.org/, with the official API documentation and many D3 Examples and tutorials; • The first section is based on the 3 Little Circles tutorial at
http://bost.ocks.org/mike/circles/.
• A useful reference for the JavaScript Language in general can be found athttp://www.w3schools.com/jsref/default.asp.