Licensed under Creative Common Page 188 http://ijecm.co.uk/
TECHNOLOGY INNOVATION STRATEGY AND FIRM
COMPETITIVENESS: A CASE OF AUTOMATED WEIGHT BASED
SOLUTION ADOPTION IN TEA PROCESSING FIRMS IN KENYA
Jeniffer Chepkemoi KOSGEI
MBA Student, Business School, Kabarak University, Kenya [email protected]
Maina WAIGANJO
Senior Lecturer, Business School, Kabarak University, Kenya
Philip E. RAGAMA
Senior Lecturer, Department of Mathematics and Bioinformatics, Kabarak University, Kenya
Abstract
Innovation plays a very important role in the success of a firm as well as the economy of a
country at large. Firms that invest in innovation are better placed to compete in the global
markets. Despite its importance the relationship between innovation and competition is widely
misunderstood. There is little empirical evidence on the role of adopting innovation on firm
competitiveness especially in the local context such as the tea industry in Kenya. Therefore, the
purpose of this study is to establish the role of technology innovation strategy on the
competitiveness of KTDA tea firms in Kenya. It specifically sought to establish the role of
Automated Weight Based Solution (AWBS), on competitiveness of KTDA tea firms in Kenya.
The study adopted descriptive survey targeting 12 tea firms in the Region 5 under the
management of KTDA. The study population comprised 12 factory unit managers, 24 production
managers, 36 supervisors, 36 store clerks and 96 leaf collection clerks. Stratified random
sampling technique was used to select 130 respondents to participate in the study. Data was
collected using questionnaires and was analyzed using both descriptive and inferential
Licensed under Creative Common Page 189
use of AWBS significantly influenced the competitiveness of the KTDA tea firms (β = 0.383, p <
0.05) and could explain up to 20.8 % of the variations in the competitiveness of KTDA tea firms
in Kenya. The study, therefore, concluded that the use of the AWBS was important to the
competitiveness of the KTDA tea firms. It was recommended that the tea processing firms carry
out more sensitization among farmers on the use of the automated weighing based solution so
as to increase farmer confidence in our organization. It is also recommended that the
government provide incentives to increase the usage of the AWBS so to improve
competitiveness of the tea sector
Keywords: Technology innovation, Competitiveness, Automated Weight Based Solution
INTRODUCTION Background
Firm competitiveness is a capability of a firm to sustainably fulfil its double purpose: meeting customer requirements at profit. This capability is realized through offering on the market goods and services which customers value higher than those offered by competitors. A condition to this competitiveness is for the company, to be able to detect and adapt to changes in the environment and within the company by way of meeting competitive market criteria permanently more favorable than those rivals (Chikan, 2008). Buckley (2016) consider competitiveness to be synonymous with a firm’s long-run profit performance, its ability to compensate employees and generate superior returns for shareholders. Firms that invest in innovation and research are better placed to compete in the global markets. Strategically focused innovation is found to be the most important characteristic associated with success and firms that innovate achieve high growth, gain market share and increased profits than those that do not innovate (Asli et al, 2013). Rajnoba and Lorincova (2015) in their study explained that innovation is an engine to development, economic growth and solely relies on the operations core of a firm. The scholars further argue that innovation increases business process efficiency and thus guarantees strategic growth of a firm. It is therefore important for any firm that wants to remain relevant in the market to identify innovations that drive their business as tool to maintaining their competitiveness (Rajnoba & Lorincova, 2015).
Licensed under Creative Common Page 190 2002 and 2004 experienced a 4.4 per cent average employment growth rate within a period of three years, in contrast to the 2 per cent average growth displayed by non-innovators in the market. The figures rose to 10 per cent when sales growth was considered. Therefore, the links between innovation and growth suggest that supporting innovation is a crucial channel to foster business growth. However, not all technological innovation adoption can lead to growth and as such; technological innovation must be clearly supported by strategic choices if they are to yield the desired results.
According to Fernando, Chang and Tripathy (2015), unless a company has a genuine scientific or technological advantage, preferably one that can be protected by patent, competitors can more often than not match any incremental change in an ever-shortening time-scale. Cost reduction in an operation, may be by use of new tools and techniques in operational management, relocating production to areas of lower labour cost. A combination of both likewise creates advantage that can be sustained only over a relatively short time. As changes in technology occur, the firm’s technology and production levels must be adapted to respond to new requirements. Should this not happen, the company could lose its cost advantage if a rival incorporates these changes instead (Coelli et al., 2005). Neither should the firm’s leaders disregard their products’ possible obsolescence nor clients’ new expectations as clients’ needs are always diverse and evolving (Ahmed et al., 2014). In addition, the strategy’s drawbacks also include the limited validity of the experience curve when a big change occurs in technology or when new entrants are able to learn more swiftly.
In Kenya, tea processing firms affiliated to the Kenya Tea Development Authority (KTDA) have adopted Continuous Fermentation Units, Automated Weight Based Solutions and Inventory Control Systems to increase their competitiveness. However, up until the present study was undertaken, the influence of the adoption of this innovation on competitiveness of the KTDA tea firms was largely unknown.
Adoption of Technological Innovation by the Kenya Tea Development Agency
Licensed under Creative Common Page 191 tea growing regions in the country (KTDA, 2007). Over the years KTDA has been able to transform itself into a smallholder-owned company serving as a case study for the region due to its growth and performance (Deloitte, 2014).
Demand by customers and suppliers have forced KTDA tea firms to improve their operations by adopting international standards in all its operations. Some of the standards attained by the tea firms include the Rainforest Alliance, ISO 22000 and Fair trade certifications which require firms to adapt to new technology and innovation in production as well as aiming at improving the welfare of farmers (Stathers, 2013). The international markets also stipulated that they were to buying tea by the year 2015 from firms that have attained above certifications, hence, forcing KTDA to rethink their strategies (Namu, Kaimba, Muriithi & Nkari, 2014).
The demand for a technology innovation led approach in tea production in the country also stems from local research. For instance, according to the Tea Research Foundation of Kenya, current research efforts are on-going in order to enhance the quality of tea and focus on cost effective and efficient manufacturing methodologies covering leaf withering, maceration, fermentation, and drying (Tea Research Foundation of Kenya strategic plan, 2011).The research carried out by the foundation revealed that more flavour and anti-oxidant rich teas could be produced by varying process conditions and type of raw leaf used. Technologies and innovation for enhanced throughput in tea factories will be of importance for deployment during peak crop season when a lot of farmers’ produce goes to waste (Tea Research Foundation of Kenya Strategic Plan, 2011).
Licensed under Creative Common Page 192
Statement of the Problem
Innovation is one of the principal drivers of competition. Of all the things that can change the rules of competition, innovation is among the most prominent (Porter et al, 2006). Despite its importance, the relationship between innovation and competition is widely misunderstood. Innovation tends to be viewed as valuable for its own sake and any technological innovation a firm can pioneer is believed to be good. In "high-technology" industries, innovation is widely per-ceived as being a ticket to profitability, while other industries that are considered "low-technology" innovation is viewed with disdain (Walsh & Linton, 2011). The recent success of for-eign competition, much of it based on technological innovation, has encouraged companies even more to invest in innovation. However, there is little empirical evidence on the role of adopting innovation on firm competitiveness especially in the local context such as the tea industry in Kenya. For instance, since the introduction of the Automated Weight Based Solution (AWBS), its effect on competitiveness of tea processing firms is yet to be established. Therefore, the present study sought to determine the relationship between technology innovation strategy and firm competitiveness specifically focusing on the adoption of the Automated Weight Based Solution on competitive advantage to firms in the tea industry in Kenya.
Objectives of the Study
To assess the role of Automated Weight Based Solution adoption on competitiveness of the KTDA tea firms.
Hypothesis
HO1: There is no significant relationship between adoption of automated weight based solutions
and competitiveness of KTDA tea firms.
LITERATURE REVIEW
Theory of Diffusion of Innovation
Licensed under Creative Common Page 193 social system. This process relies heavily on human capital. Jenssen and Randoy (2006), explain that innovation must be widely adopted in order to self-sustain. The scholars further argue that within the rate of adoption, there is a point at which an innovation reaches critical mass and manifests itself in different ways in various cultures and fields and is highly subject to the type of adopters and innovation-decision process.
Rogers (2003), point out categories of adopters as follows: early adopters, early majority, late majority, and laggards. Robinson (2009), agrees with Professor Everett that communication is important during diffusion of innovation and further explains that an innovation spreads from early adopters to majority audiences hence face-to face communication therefore becomes more essential for the decision to be adopted. According to Boston (2013), the stages by which a person adopts an innovation and where diffusion is accomplished include awareness of the need for an innovation, decision to adopt or reject the innovation, initial use of the innovation to test it, and continued use of the innovation. In the current study, this theory was used to examine the appreciation of technology by the users in the tea producing firms and areas.
Technological Innovation
Licensed under Creative Common Page 194 Technological innovation in firms comprises of two approaches; process innovation and product innovation.
Technology Innovation Strategy
Innovation strategy facilitates the attainment of a company's vision through alignment of its information technology strategy with its business strategy (Hill & Jones, 2009). Innovation refers to the act of creating new products or services and is classified into two; product and process innovation. Product innovation is the development of products that are new to the world or have superior attributes to those of existing products while process innovation is the development of a new process for producing and delivering them to customers. It is also the application of better solutions that meet new requirements, unarticulated needs, or existing market needs and is accomplished through more effective products, processes, services, technologies, or ideas that are readily available to markets, governments and society (Wong, 2012). All these definitions share a number of key elements that innovation concerns new ideas, exploitation of new possibilities or new processes. As innovation become increasingly a priority for established firms, managers are seeking to emulate the flexibility, creativity and entrepreneurial spirit of technology based startup firms that are consistently successful in innovation and have the ability to design organization processes that capture, direct and exploit individual’s drive for achievement and success and commitment to innovations this is aimed at making their firms competitive in the market (Grant, 2010).
In order to avoid obsolesce and promote innovation, a firm must be aware of technological changes that might influence its industry. Creative technological innovations can suggest possibilities for new products, for improvements in manufacturing or marketing techniques. (Pearce, 2005), argue that a company can use innovation create a competitive advantage by creating barriers that deter entry of rivals, introducing novel products or technology processes that attract new customers, or changing the rules of competition in the industry and that high performing firms match investments in technology with strong managerial and technical skills (Meeta, 2009). Salge (2012) explains that innovation in an organization context may be linked to positive changes in efficiency, productivity, quality, competitiveness, and market share. However, recent research findings highlight the complementary role of organizational culture in enabling organizations to translate innovative activity into tangible performance improvements.
Licensed under Creative Common Page 195 and market demands. Dehoff and Jaruzelki (2008), observed that there is only best innovative strategy for a particular firm and that success of a given innovative strategy will depend on the effort extended to align innovation with strategy and management of the entire process with discipline and transparency. This means therefore that management play a key role in ensuring the success of a given innovation strategy and without their support there is limited chances of success.
Innovation can also help business owners keep costs to a minimum. According to Thomson, Strickland and Gamble (2010), use of automation can assist a small manufacturer reduce its dependence on human beings to perform some of the necessary production processes. As a result, the business can reduce employee expenses such as salary, benefits and turnover and also help to streamline the production process. Pearce (2005), outlines that in order to avoid obsolesce and promote innovation, a firm must be aware of technological changes that might influence its industry. This is because creative technological innovations can suggest possibilities for new products, improvements in manufacturing or marketing techniques. Schacht (2006), argues that innovation has become a double-edged sword because it has enabled opportunities but has also introduced risks. Uses of innovation and technology enable firms to connect and engage with their stakeholders in new and significantly faster and cheaper ways. Meeta (2009), explains that innovation enables firms to have access to important resources without necessarily having to own them through business processes outsourcing However in the process of connecting and engaging the stakeholders, uses of innovation has introduce new interdependencies that if improperly managed can lead to costly and inefficient operations and can ultimately reduce agility and hurt performance of a firm (Priem, 2001).
Automated Weighing Based Solution
Licensed under Creative Common Page 196 The automated weighing based solution comprises of three devices which include a handle held computer commonly known as portable device assistant (PDA), an electronic scale and a small printer (Muruiki & Kimanthi, 2013). When a farmer places tea leaves on the electronic scale, it records weight after stabilizing and then automatically reflects on the PDA. The clerk then presses the “ACCEPT” button in order for the printer to produce a receipt which reflects on farmer’s daily and cumulative eight of the tea deliveries. The transactions are the transmitted automatically to the factory database and also replicated at the KTDA headquarters. While the manual machines only recorded the whole figure and omitted the figure after the decimal, the AWBS records the precise weight, restoring to farmers substantial losses that were being incurred. This ensures that only valid growers can deliver green leaf at buying centers. Growers’ information is stored on the PDA and is loaded every morning to ensure that newly registered or transferred growers are included (TBK, 2012).
A study by Kagjobola (2004), revealed that firms that adopt the use of information communication technology (ICT)has contributed significantly to closing communication gaps as users and suppliers can now communicate more easily and faster. Placing orders or sourcing for raw materials becomes an easy task as well as effective use of time. This argument emphasizes the need for firms to invest in innovation so as to remain competitive in the market and that innovation in an organization context may be linked to positive changes in efficiency, productivity, quality, competitiveness and market share (Salge, 2012).
Conceptual Framework
Figure 1: Conceptual Framework
RESEARCH METHODOLOGY Research Design
This study adopted descriptive survey which determines and reports the way things are and commonly involves assessing attitudes and opinions towards individuals, organization and procedures (Orodho, 2003). The design was suitable for this study because there was need to collect large amount of data over a wide area and that could be generalized.
Automated Weight Based
Solution (AWBS)
Monitoring of green tea data Farmer confidence
User friendliness
Competitiveness of KTDA
Tea Firms
Processing efficiency Labor costs
Licensed under Creative Common Page 197
Target Population
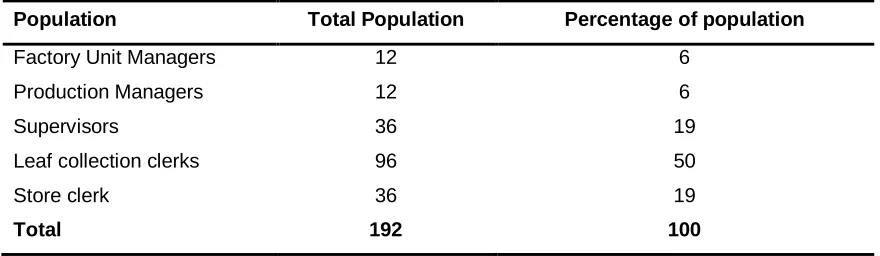
This study was carried out in Region 5 of KTDA management area with particular focus on firms located in Bomet and Kericho counties, Kenya. There are 12 tea firms in the Region 5 under the management of KTDA. Cumulatively, the firms have 12 factory unit managers, 24 production managers, 36 supervisors, 36 store clerks and 96 leaf collection clerks. The study, therefore, targeted the factory unit managers, production managers, supervisors, store clerks and the leaf collection clerks since they were handling the technologies and reports on a day to day basis and were, therefore, in a position to supply the study with the information being sought. The distribution of the target population is shown in Table 1.
Table 1: Target Population
Population Total Population Percentage of population
Factory Unit Managers 12 6
Production Managers 12 6
Supervisors 36 19
Leaf collection clerks 96 50
Store clerk 36 19
Total 192 100
Sampling Design
Sample Size Determination
The overall population under consideration in this study comprised of 192 respondents from KTDA tea firms. This population was large enough to warrant the use of probability sampling techniques. For such sample sizes, the formula below by Yamane (1967) was used in determining the sample size from a definite population suffices under;
Where,
n = sample size, N= population size e = error of sampling. Substituting into the formula;
𝑛 = 192
1 + 192 ∗ 0.052
n = 129.7297
Hence the sample size,
n≈ 130
2
1 Ne
N n
Licensed under Creative Common Page 198
Sampling Technique
Stratified random sampling technique was used to select respondents by placing them into 4 strata in order to maximize survey precision given the sample size. The employees were categorized into five strata according to their levels: Factory Unit Manager (FUM), Production Manager (PM), Supervisor, stores clerks and leaf collection Clerk out of which 130 respondents were selected to participate in the study.
Instrumentation
The study used copies of questionnaires designed by the researcher to gather relevant data for the study. The questionnaire was the structured type containing only closed ended items. The selection of this tool was guided by the nature of data to be collected, time available and the objectives of the study. This enabled the researcher to reduce both researcher and respondent biases.
The study adopted content validity approach to determine whether the test items represented the content that the test was designed to measure (Mugenda & Mugenda, 2003). In order to ensure that all the items used in the questionnaires are consistent and valid, the instruments were subjected to scrutiny and review by the researcher’s supervisors at Kabarak University. The items were rephrased and modified where necessary to avoid ambiguity before being used for data collection.
Pilot Test
This study used questionnaires after pilot testing them for correctness and accuracy on 15 non-participatory respondent samples. Piloting of the questionnaires was done in two tea processing firms in Kisii County which had similar demographic patterns. The purpose of the pilot test was to test face validity of the instrument (Mugenda & Mugenda, 2003). The results of the pilot test were used to assess the usability of the questionnaires for the study purposed.
Licensed under Creative Common Page 199
Data Analysis and Presentation
Data was analyzed using both descriptive and inferential statistical methods. According to Freund (2001), the major objective of any statistical investigation is to establish relationship which makes it possible to predict one or more variables in terms of the other variables. Descriptive data allows the researcher to meaningful describe many scores using a small number of indices using frequency, mode and percentages. Inferential statistics involved the use of bivariate regression to determine the nature of the relationship between the variables. The bivariate regression model was estimated to hold under the relation;
Where;
y = Competitiveness of KTDA Tea Firms
b0 = Regression Constant
X1 = Automated Weight Based Solution
b1 is the coefficient of the variable determined by the model
e = the estimated error of the regression model
The results were then presented in APA tables for ease of understanding of the results
RESULTS AND DISCUSSION Response Rate
The study administered 130 questionnaires and was able to retrieve 105 completed questionnaires representing a 81% instrument response rate. This was acceptable according to the recommendations of Mugenda and Mugenda (2003). The questionnaire response rate resulted from the self-administered method of administration of the instrument. The other questionnaires were either not returned or found to be unusable for the study; hence, the y were excluded for data analysis.
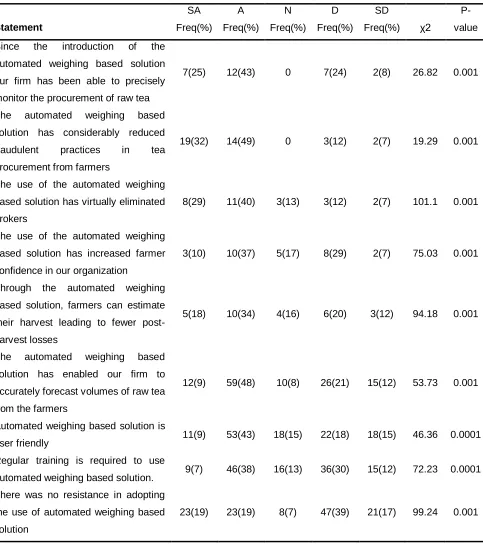
Use of Automated Weight Based Solution and Competitiveness of KTDA Tea Firms
The study also sought to examine the influence of automated weight based solution (AWBS) on the competitiveness of the KTDA tea firms. The empirical findings are presented in the Table 2.
e
x
b
b
Licensed under Creative Common Page 200 Table 2: Automated Weight Based Solution and Competitiveness of KTDA Tea Firms
SA A N D SD P-
Statement Freq(%) Freq(%) Freq(%) Freq(%) Freq(%) χ2 value
Since the introduction of the automated weighing based solution our firm has been able to precisely monitor the procurement of raw tea
7(25) 12(43) 0 7(24) 2(8) 26.82 0.001
The automated weighing based solution has considerably reduced fraudulent practices in tea procurement from farmers
19(32) 14(49) 0 3(12) 2(7) 19.29 0.001
The use of the automated weighing based solution has virtually eliminated brokers
8(29) 11(40) 3(13) 3(12) 2(7) 101.1 0.001
The use of the automated weighing based solution has increased farmer confidence in our organization
3(10) 10(37) 5(17) 8(29) 2(7) 75.03 0.001
Through the automated weighing based solution, farmers can estimate their harvest leading to fewer post-harvest losses
5(18) 10(34) 4(16) 6(20) 3(12) 94.18 0.001
The automated weighing based solution has enabled our firm to accurately forecast volumes of raw tea from the farmers
12(9) 59(48) 10(8) 26(21) 15(12) 53.73 0.001
Automated weighing based solution is
user friendly 11(9) 53(43) 18(15) 22(18) 18(15) 46.36 0.0001 Regular training is required to use
automated weighing based solution. 9(7) 46(38) 16(13) 36(30) 15(12) 72.23 0.0001 There was no resistance in adopting
the use of automated weighing based solution
23(19) 23(19) 8(7) 47(39) 21(17) 99.24 0.001
The findings in Table 2 suggest that most respondents agreed(43%, 26.8, 0.001)
2
P
thatLicensed under Creative Common Page 201 ) 001 . 0 , 3 . 19 %, 49
(
2 that the introduction of the automated weighing based solution hadconsiderably reduced fraudulent practices in tea procurement from farmers. Majority of the
respondents also agreed (40%, 101.1, 0.001)
2
P
that the use of the automated weighingbased solution has virtually eliminated brokers. As a result, the use of the automated weighing based solution has increased farmer confidence in most firms as indicated by majority of the
respondents who agreed(37%, 75.03, 0.001)
2
P
with this statement. Further, mostrespondents agreed(34%, 94.18, 0.001)
2
P
that through the system, farmers could reliablyestimate their harvest leading to fewer post-harvest losses. The respondents also agreed
) 001 . 0 , 7 . 53 %, 48
(
2 that tea processing firms could also accurately forecast volumes ofraw tea from the farmers using the system. Most of the respondents were also of the agreement
) 001 . 0 , 46.36 %, 43
(
2 that automated weighing based solution was user friendly though itstill required regular training(38%, 72.23, 0.001)
2
P
. However, it emerged that there wasconsiderable resistance in adopting the use of automated weighing based solution as indicated
by most respondents who agreed (39%, 99.24, 0.001)
2
P
probably owing to the disruptionof the broker networks and instead creating a vertical integration in the sourcing of the raw material.
Looking at these findings, it is evident that despite the perceived benefits of using the AWBS, there was considerable resistance to the innovation. This suggests that the AWBS could have considerable impact on the competitiveness on the firms as it could give the farmers more confidence to trade with them. This will ensure that there will be constant supply of the raw materials. This finding is in line with the Tidd (2009) who explained that innovation strategy must cope with the external environment which is complex and ever changing. This is because there is considerable amount of uncertainties about current or future developments in terms of technology, competitive threats and market demands.
Competitiveness of KTDA Tea Firms
Licensed under Creative Common Page 202 Table 3: Competitiveness of KTDA Tea Firms
SA A N D SD P-
Statement Freq(%) Freq(%) Freq(%) Freq(%) Freq(%) χ2 value
Spillage of green leaf has reduced 14(16) 27(31) 13(15) 23(26) 11(13) 38.45 0.000 Capacity for tea handling has
increased 18(21) 29(33) 11(13) 18(21) 12(14) 48.71 0.000 Processing time of green leaf has
reduced 22(25) 25(28) 10(11) 20(23) 11(13) 48.12 0.000
Labour cost has reduced 16(18) 28(32) 12(14) 23(26) 9(10) 64.67 0.000 Hygiene has improved during
fermentation process 25(28) 29(33) 11(13) 13(15) 10(11) 84.15 0.000 Tea of high quality is being
produced 21(24) 32(36) 5(6) 17(19) 13(15) 56.24 0.000
Consistency during fermentation
has been enhanced 12(14) 28(32) 15(17) 21(24) 12(14) 111.75 0.000 Loss of green leaf (kgs) has
reduced 17(19) 26(30) 9(10) 20(23) 16(18) 78.77 0.000
We are able to satisfy market
demands in a timely manner 14(16) 30(34) 13(18) 16(18) 15(17) 85.21 0.000 Our firm has been able to cut
procurement losses 19(22) 37(42) 4(5) 19(22) 9(10) 86.36 0.000 Our supply chains are stable due to
increased confidence with our partners
16(18) 27(31) 11(13) 20(23) 14(16) 95.38 0.000
Our tea fetches good prices both
domestically and internationally 18(21) 26(30) 10(11) 22(25) 12(14) 108.42 0.000 Some of the importers have
switched to our tea due to our increased quality and ability to meet demands on short notice
23(19) 47(39) 8(7) 23(19) 21(17) 91.56 0.000
We have also been able to improve our internal efficiencies due to automation
13(12) 52(48) 10(10) 32(30) 0 46.36 0.000
The results in Table 3 indicate that as a result of adopting the technological innovations in the firms, the spillage of green leaf had reduced as indicated by most respondents who agreed
) 001 . 0 , 38.45 %,
31
Licensed under Creative Common Page 203 that the capacity for tea handling has increased. At the same time the processing time of green
leaf had reduced as indicate by most respondents(28%, 48.12, 0.001)
2
and, similarly, thelabor costs has reduced in most of the firms as suggested by most respondents who agreed
) 001 . 0 , 64.67 %, 32
(
2 . The findings also suggest that most of the respondents agreed) 001 . 0 , 84.15 %, 33
(
2 that hygiene has improved and consistency enhanced duringfermentation process (32%, 111.75, 0.001)
2
leading to the production of high quality teaas indicated by most respondents(36%, 56.24, 0.001)
2
. Further, the firms were able tosatisfy the market demand in a timely manner(34%, 78.77, 0.001)
2
. The firms were alsoable to cut procurement losses as indicated by most respondents(42%, 85.21, 0.001)
2
and stabilize their supply chains according to majority of the respondents
) 001 . 0 , 95.38 %, 31
(
2 . According to most respondents(30%,
2 108.42,0.001), the teawas also able to fetch competitive prices both in the domestic and international market. A growing number of importers had also switched to Kenyan tea produced in the KTDA firms owing to their quality and ability to meet the market demands as indicated by majority of the
respondents(39%, 91.56, 0.001)
2
. Majority of the respondents also agreed) 001 . 0 , 46.36 %, 48
(
2 that the firms had also been able to improve their internalefficiencies.
These findings suggest that despite the challenges of adopting the innovative technologies, there was some improvement in terms of competitiveness of the tea processing firms. The findings, further, agree with Ochieng and Ongonga, (2013) who found that innovative strategies adopted by multinational tea firms in Kericho resulted into increased revenues, high productivity levels and reduced costs. According to Riley (2012), constant threat from foreign competition, it is important for firms to strive to improve their competitiveness by incorporating latest technology and innovation into their operations in order to increase their internationa l competitiveness.
Regression Analysis
Licensed under Creative Common Page 204 Table 4: Bivariate linear regression analysis model summary
R R Square Adjusted R Square Std. Error of the Estimate
0.478 0.22848 0.20792 3.5101
a. Predictors: (Constant), Automated weight based solution
Looking at the results in Table 4 show that the model correlation coefficient r = 0.478 was higher than any zero order value in the table. This suggested that the model could improve when more variables were incorporated into it when analyzing the role of the adoption of innovation on the competitiveness of KTDA tea firms in Kenya. The coefficient of determination, that is, the adjusted r square = 0.2079, also indicates that the all the independent variables combined in the model could explain for approximately 20.8% of the variations in the competitiveness of KTDA tea firms in Kenya when technology innovation strategies are considered.
Table 5: Summary of ANOVA results
Sum of Squares Df Mean Square F Sig.
Regression 110.327 1 110.327 20.4681 .000b
Residual 544.41 101 5.3902
Total 654.737 104
a. Dependent Variable: Competitiveness of KTDA Tea Firms b. Predictors: (Constant), Automated Weight Based Solution
The results of ANOVA performed on the independent and dependent variables (Table 5) indicate that there was a significant difference between means of the Automated Weight Based Solution and the competitiveness of KTDA tea firms in Kenya (Fo = 20.4681> Fc = 3.94; α <
0.05; df = 1, 101; p < 0.05). This finding confirms the finding suggested by regression model in Table 4. In order to find out which was the most significant innovation on the competitiveness of KTDA tea firms in Kenya, the beta value was used. The results are given in Table 6.
Table 6: Summary of Multiple Regression Analysis
Unstandardized
Coefficients
Standardized
Coefficients T Sig. VIF
B Std. Error Beta
(Constant) 20.239 4.482 4.516 0.001
Automated Weight Based Solution 0.478 0.199 0.383 2.402 0.001 2.016
Licensed under Creative Common Page 205 Looking at the results in Table 6, it is evident that the Automated Weight Based Solution (β = 0.383, p < 0.05)suggesting that the dependent variable would change by a corresponding number of standard deviations when the independent variable changed by one standard deviation. Therefore, the resulting linear regression model is:
Competitiveness of KTDA Tea Firms = 20.239 +.478Automated Weight Based Solution
The finding shows that there was a moderate relationship between the two variables implying that the competitiveness of the tea processing firms could be further enhanced when more emphasis was put on the adoption of the AWBS. This finding concurs with Salge (2012) who found that innovations such as the AWBS contributed significantly to the firm’s competitive advantage. Specifically, placing orders or sourcing for raw materials becomes an easy task as well as effective use of time.
Hypothesis Testing
Based on these findings the hypotheses of the study can be tested. The hypothesis of the study was:
HO1: there is no significant relationship between the use of Automated Weight Based
Solutions on the Competitiveness of KTDA Tea Firms
According to the results in the multiple regression model in Table 5, Automated Weight Based Solutions significantly influenced the Competitiveness of KTDA Tea Firms (
2
0.127, p <0.05). Consequently, the null hypothesis H02 was rejected. These findings indicate that the use of the AWBS machines resulted in firm competitiveness. These findings are consistent with those of Namu et al., (2014) who observed that the use of the previous manual weighing scale had many limitations and loopholes to exploit and resulted in the manipulation manual weighing scales to defraud farmers. As such, the farmers’ confidence was lowered and this affected their consistency in production. According to CPDA (2008), so rampant had been the practice that a number of growers abandoned tea farming.
CONCLUSIONS
Licensed under Creative Common Page 206 the farmers could now reliably estimate their harvest leading to fewer post-harvest losses. Third, the AWBS had considerably improved the internal processes of the tea processing firms. The firms could now accurately forecast volumes of raw tea from the farmers using the system. However, it emerged that there was considerable resistance in adopting the use of automated weighing based solution probably owing to the disruption of the broker networks and instead creating a vertical integration in the sourcing of the raw material. Additional findings suggested that the use of AWBS significantly influenced the competitiveness of the KTDA tea firms. The study, further, shows how technologies like AWBS can influence the social system - in this case the farmers whose role in the value chain and eventual competitiveness in the tea industry is important and needs to be safeguarded - in line with the Diffusion of Innovations Theory advanced by Rogers (2003). Therefore, the study concludes that the use of the Automated Weight Based Solution was important to the competitiveness of the KTDA tea firms and could not be overlooked.
RECOMMENDATIONS
i. The study, therefore, recommends that there is need for tea processing firms to invest in the Automated Weight Based Solution so as to remain competitive in the market. Other agro-processing firms in the country could also invest in this technology to make them competitive.
ii. The study also recommends that the tea processing firms need to sensitize farmers more on the use of the automated weighing based solution so as to increase farmer confidence in our organization.
iii. The government should also provide incentives to increase the usage of the AWBS so to improve competitiveness of the tea sector which is an important forex earner to the country. The farmers at the lower end of the value chain will also find more incentive to produce tea.
SCOPE FOR FURTHER RESEARCH
Licensed under Creative Common Page 207
REFERENCES
Asli G., Ozalp V. &Nilufer E. (2013). Gaining Competitive Advantage through Innovation Strategies: An Application in Warehouse Management Process. American Journal of Business and Management, 2 (4), 304-321.
Boston University School of Public Health (2013). Diffusion of Innovation Theory, http://www.bu.edu/innovationDiffusion (retrieved on the 9th September 2017).
Buckley, P. J. (2016). The contribution of internalization theory to international business: New realities and unanswered questions. Journal of World Business, 51(1), 74-82.
BurgeSmani, R., Christensen, C., &Wheelwright. (2012). Strategic Management of Technology and Innovation, 5th edition, McGraw Hill International.
Chikan, A. (2008). National and firm competitiveness: a general research model. Competitiveness Review: An International Business Journal, 18(1/2), 20-28.
CPDA. (2008). Christian Partners Development Agency, Nairobi: Kenya Report on the Small-Scale Tea Sector in Kenya.
Deloitte, M. (2014). Beyond the pioneer; getting inclusive industries to scale, Deloitte India
Freund J.E. (2001). Mathematics Statistics: Regression and Correlation, 5th edition. Eastern Economy Edition Grant, R. M. (2010). Contemporary Strategy Analysis, 8th edition. Wiley’s Publishers.
Hill, C. & Jones, G. (2009). Essentials of Strategic Management, 3rd edition. Cengage Learning. http://www2.deloitte.com/.../beyond-the-pioneer.pdf (accessed 20 September 2017).
Jensen B. A. & Randon, T. (2006). Performance Effect of Innovation in Shipping Companies. Maritime Policy Management Journal, 33(44), 327-343.
Kajogbola, D. (2004). The impact of Information technology on the Nigerian economy: a study of Manufacturing and service sectors in the south western and south eastern zones of Nigeria, ATPS (African technology policy studies) WP series no.39.
Kimathi, C.K. & Muriuki, F.M. (2013). A Showcase of Smallholder Agriculture in the EAC: The Case of the Smallholder Tea Sector in Kenya. Paper presented in the International Symposium and Exhibition on Agricultural Development in the East African Community, Kampala, Uganda.
KTDA. (2007). Kenya Tea Development Agency company brochure. KTDA. Nairobi.
Meeta, D. (2009). Technological Innovations and Role of Technology Strategy Towards Development of a Model. Global Conference on Business and Economics.
Mugenda, O.M., & Mugenda, A.G. (2003). Research methods: quantitative and qualitative approaches. Nairobi: Acts Press.
Namu, N., Kaimba, G., Muriithi, D. & Nkari, I (2014). Impact of Cost Reduction Strategies on Performance of Tea Factories in Embu County, Kenya. European Journal of Business an Social Sciences, 3 (9), 24-48.
Narayanan (2007). Technology Strategy; Overview in Managing Technology and Innovation for Competitive Advantage. Strategic Management Journal, 25, 473-485.
Orodho. J. (2003). Essential of Educational and Social Sciences, Research Methods. Masola Publishers.
Pearce, J.A & Robinson, B. (2005). Strategic Management, Formulation, Implementation and Control, 9th edition. Chicago, Irwin Inc.
Porter, M.E., & Kramer, M.R. (2006). Strategy and Society: The Link between Competitive Advantage and Corporate Social Responsibility, Harvard Business Review, December 2006.
Priem, & Barney, J. (2001). Is The Resource-Based Theory a Useful Perspective for Strategic Management Research? Yes. Academy of Management Review, 26,.41–56.
Rajnoba, R., & Lorincova, S.(2015).Strategic management of business performance based on Innovations and information support in specific conditions of Slovakia. Journal of Competitiveness, 7, 3-7.
Robinson, L. (2009). A Summary of Diffusion of Innovations, Changeology; The Book. Rogers, E.M. (2003). Diffusion of Innovation, 5th Edition, New York: Free Press.
Licensed under Creative Common Page 208 Sambu, Z. (2009). KTDA Rolls Out Digital Scales at Collection Centres to Curb Fraud.
Schacht, H.W. (2006). Industrial Competitiveness and Technological Advancement Debate Over Government Policy. Washington, D.C.: Congressional Research Service, Library of Congress.
Stathers, T. (2013). Poverty Impact of Social and Environmental Voluntary Standards Systems in Kenyan Tea, Natural Resources Institute, University of Greenwich
Task force Report. (2007). Ministry of Agriculture report on tea industry in Kenya
Tea Board of Kenya (2012).Surviving The Economic Meltdown. TBK Quarterly publications:
Tea Research Foundation of Kenya (TRFK), (2011).Tea Research Foundation of Kenya 2010 2015 Strategic Plan, 2nd Edition.
Thomson A., Strickland A.& Gamble J.E. (2010). Crafting and Executing Strategy: The Quest for Competitive Advantage, New York
Tidd, J. (2009). Managing Innovation, Integrating Technological Market and Organizational Change, 4th edition. England: John Miley & Sons Ltd.
Wong, S. K. (2012). Environmental Requirements, Knowledge Sharing and Green Innovation: Empirical Evidence from China. Business Strategy and Environment journal.
Yamane, T. (1967). Statistics: An Introductory Analysis. 2nd Edition. New York: Harper & Ro.