adfa, p. 1, 2011.
© Springer-Verlag Berlin Heidelberg 2011
Chapter 12: Game Data Mining
Anders Drachen1, Christian Thurau2, Julian Togelius3, Georgios Yannakakis3, Christian Bauckhage4
1Northeastern University, Game Analytics and Aalborg University, 2Game Analytics
3Center for Computer Games Research, IT University of Cophenhagen 4Fraunhofer IAIS and the University of Bonn
Take Away Points:
1. The data revolution in games – and everywhere else – calls for analysis methods that scale to with dataset size. The solution: game data mining 2. Game data mining deals with the challenges of acquiring actionable
in-sights from game telemetry.
3. Read the chapter for an introduction to game data mining, an overview of methods commonly and not so commonly used, examples, case studies and a substantial amount of practical advice on how to employ game data min-ing effectively.
1
Introduction
During the years of the Information Age, technological advances in the comput-ers, satellites, data transfer, optics, and digital storage has led to the collection of an immense mass of data on everything from business to astronomy, counting on the power of digital computing to sort through the amalgam of information and generate meaning from the data. Initially, in the seventies and eighties of the previous century, data were stored on disparate structures and very rapidly became overwhelming. The initial chaos led to the creation of structured databases and database management systems to assist with the management of large corpuses of data, and notably, the effective and efficient retrieval of information from databases. The rise of the data-base management system increased the already rapid pace of information gathering.
During later years, a virtually exponential increase in the availability of data is emerging in fields across industry and research, such as bio-informatics, social net-work analysis, computer vision and not the least digital games. Today, far more data is available than can be handled directly: business transaction data, scientific data from, e.g., telescopes, satellite pictures, text reports, military intelligence and digital games (Berry and Linoff, 1999; Han et al, 2005; Larose, 2004; Kim et al, 2008; Isbis-ter and Schaffer, 2008; Mellon, 2009; Drachen and Canossa, 2009; Bohannon, 2011).
Modern digital games range from simple applications to incredibly sophisticated information systems, but common for all of them is that need to keep track of the actions of players and calculate a response to them, as is discussed in most chapters in this book. In recent years, the tracking and logging of this information termed teleme-try data in computer science - as well as data on technical performance of the game engines and applications themselves - has become widespread in the digital enter-tainment industry, leading to a wealth of incredibly detailed information about the behavior of – in the case of major commercial titles – millions of players and installed clients (Mellon, 2009; King and Chen, 2009; Drachen & Canossa, 2011).
Applied right, game telemetry can be a very powerful tool for game develop-ment (Kim et al, 2008; Isbister and Schaffer, 2008; King and Chen, 2009). Not only for analyzing and tuning games, QA, testing and monitoring infrastructure (Mellon, 2009), figuring out and correcting problems and generally learning about effective game design, but also to guide marketing, strategic decision making, technical devel-opment, customer support, etc. However, it is generally far from obvious how to em-ploy the analysis (Kim et al, 2008; Mellon, 2009): what data should we record, how can we analyze it, and how should it be presented to facilitate effect transformation of raw data to knowledge that if fully integrated into the organization?
Narrowing the focus to behavioral game telemetry, i.e. telemetry data about how people play games (Chapter 2), there are a wide variety of ways that this kind of game telemetry data can be employed to assist a variety of stakeholders (as discussed in Chapter 3), during and following the development process, e.g., informing game de-signers about the effectiveness of their design via user modeling, behavior analysis, matchmaking and playtesting, something that is evident from the range of publica-tions and presentapublica-tions across academia and industry, including: Kennerly, 2003; Hoobler et al, 2004; Houlette, 2004; Charles and Black, 2004; Thurau et al, 2004; Ducheneaut and Moore, 2004; DeRosa, 2007; Thompson, 2007; Thurau et al, 2007; Kim et al, 2008; Isbister and Schaffer, 2008; Thawonmas and Iizuka, 2008; Thawonmas et al, 2008; Coulton et al, 2008; Drachen et al, 2009a; Missura and Gärt-ner, 2009; Williams et al, 2009, 2008; Thurau and Bauckhage, 2010; Pedersen et al, 2010; Yannakakis and Hallam, 2009; Weber and Mateas, 2009; Mellon, 2009; El-Nasr and Zammitto, 2010; El-El-Nasr et al., 2010; Thurau and Drachen, 2011; Yannaka-kis and Togelius, 2011; Moura et al., 2011; ErfanI and El-Nasr, 2011; Drachen and Canossa, 2011; Drachen et al., 2012; Yannakakis, 2012; Bauckhage et al., 2012; Gagne et al., 2012).
There is a wealth of information hidden in good game telemetry data, but not all of it is readily available, and some very hard to discover without the proper expert knowledge (or even with it). This has led to much game telemetry data being tracked, logged and stored, but not analyzed and employed. The challenge faced by the game industry to take advantage of game telemetry data mirrors the general challenge of working with large-scale data. Simply retrieving information from databases – irre-spective of the field of application - is not enough to guide decision-making. Instead, new methods have emerged to assist analysts and decision makers to obtain the
in-formation they need to make better decisions. These include: automatic summariza-tion of data, the extracsummariza-tion of the essence of the stored informasummariza-tion, and the discovery of patterns in raw data. When datasets become very large (we consider any dataset that does not fit into the memory of a high-end PC as large-scale, i.e. several GB and beyond) and complex, many traditional methodologies and algorithms used on small-er datasets break down. In fact, any algorithm that scales quadratically with the num-ber of samples is not feasible to use on large data. Instead, methods designed for large datasets must be employed. These methods are collectively referred to as data min-ing. Data revolutions call for novel analysis methods that scale to massive data sizes and allow for effective, rapid analysis, as well as results that are intuitively accessible to non-experts (Han et al, 2005; Larose, 2004).
Using data mining methods in the context of game telemetry data – what we will here call game data mining - we can for example:
Find weak spots in a games´ design (Chapter 7; Thompson, 2007; Kim et al, 2008; Drachen and Canossa, 2009; Gagne et al., 2012)
Figure out how to convert nonpaying to paying users (Chapter 4; King and Chen, 2009)
Discover geographical patterns in our player community,
Figure out how players spend their time when playing (Chapter 18 and 19, DeRo-sa, 2007; Moura et al., 2011; Drachen et al., 2012)
Discover gold farmers in an MMORPGs (Thawonmas et al, 2008),
Explore how people play a game (Chapter 14; Drachen and Canossa, 2009), How much time they spend playing (Williams et al, 2009)
Predict when they will stop playing (Mahlman et al., 2010; Bauckhage et al., 2012) Predict what they will do while playing (Weber and Mateas, 2009)
Which assets that are not getting used (Chapter 14)
Develop better AI-controlled opponents or make games that adapt to the player (Charles and Black, 2004; Thurau et al, 2007; Missura and Gärtner, 2009; Pedersen et al., 2010; Yannakakis and Hallam, 2009)
Explore and use of social grouping (Thurau and Bauckhage, 2010) – and much, much more.
This chapter will outline how large-scale data mining can be effectively carried out on game telemetry data (i.e. telemetry from game clients/game servers, which can include data on players), and cover a range of scenarios, from behavior analysis of individual players and how they give rise to patterns, to interpretation of larger scale structures like guilds in massively multiplayer online games. To begin with, we will provide an introduction to data mining in general and game data mining specifically, good data mining practices and methods, as well as notes on tools and challenges to game data mining. This should by no means be viewed as a thorough introduction to data mining – that requires an entire book. Fortunately such books exist, for example Han et al. (2005) is a good starting place for the novice data miner.
Following, the major categories of data mining will be outlined and a number of case studies used to exemplify some of the commonly used game data mining aproaches, covering supervised and unsupervised methods, with examples from, e.g.,
World of Warcraft (Blizzard, 2003), Tomb Raider: Underworld (2008, Eidos Interac-tive) and Heroes of Newerth (2010, S2 Games), as well as case examples obtained from concrete production contexts. As the interpretability of data analysis results is important, we focus on methods that go well beyond descriptive techniques to provide more meaningful, useful and actionable data representations, enabling the analysis of player behavior across millions of individuals.
On a practical note, the first half of this chapter (Sections 1 and 2) is written for the general audience and does not require previous knowledge of data mining. The se-cond half (Sections 3 and 4), which focus on case examples of different data mining methods, use however data mining terminology, includes some use of formulas, and some sub-sections may require knowledge of statistics and dimensionality reduction methods. Section 5 takes a specific look at online games, including Free-to-Play (F2P), as these have received particular attention with respect to data mining.
2
Data Mining in Games background and overview
In this section, data mining is introduced and an overview of the main types of meth-ods presented, leading up to the subsequent sections, which will cover the specific methods employed for analyzing game telemetry data.
2.1 What is data mining?
Data mining is a somewhat nebulous concept, and there is no single definition of what it is (Chen et al, 1996; Fayyad et al, 1996; Han et al, 2005). The name itself – data “mining” – is derived due to the similarity between searching for valuable infor-mation in large databases and mining rocks for valuable ore. Both imply either sifting through large amounts of material randomly or use intelligent methods to pinpoint where the valuable material is. The term is something of a misnomer though, as the goal of mining data is not data, but knowledge (i.e. “knowledge mining”). However, data mining sounded sexier and became the accepted term, overshadowing other terms such as knowledge discovery, knowledge extraction and pattern discovery, which better describe the complete process. According to the Gartner Group (www.thegartnergroup), data mining is: “the process of discovering meaningful new correlations, patterns and trends by sifting through large amounts of data stored in repositories, using pattern recognition technologies as well as statistical and mathe-matical techniques.” Similar to this definition, others usually emphasize the explora-tion and analysis of large quantities of data, in order to discover meaningful patterns. Data mining forms an amalgam of methods and ideas, drawing inspiration from dif-ferent fields of science and business, including machine learning, artificial intelli-gence, pattern recognition, medical science, statistics and database systems – in many ways, data mining has emerged in the space between these fields of research (Berry and Linoff, 1999).
Depending on the definition, data mining is either a step in or the whole of, the process of knowledge discovery in databases (KDD), a concept originating from 1989, referring to the non-trivial extraction of implicit, unknown and potentially use-ful information from data in databases (Berry and Linoff, 1999). It used to be that KDD was viewed as the overall process of discovering useful knowledge from data, while data mining was the application of particular algorithms to extract patterns from data without the additional steps of the KDD process, but the difference is largely academic.
The same is the case for the difference between data mining and statistics. Many data mining methods stem from statistics, and data mining itself largely arose due to the need in statistics to adopt and invent new ways of working with huge masses of data work with huge masses of data. Over the nineties, working with large masses of data became synonymous with data mining, although the methods applied could also be called statistics. At the mathematical level, there are various arguments that can be leveraged, but the main difference again relates to whether data mining and statistics refers to specific methods, or the entire process of working and extracting meaning from data. If statistics is viewed as a set of methods, and data mining the entire pro-cess, they are different – but again, in practice, from the trenches of game analytics, there is not a lot of difference.
Irrespective, there is a very strong human element in data mining. Early defini-tions of data mining emphasized automatic or semi-automatic methods, but it is im-portant to note that the human element is vital when exploring and analyzing large datasets – data mining has become synonymous with automatic techniques, which has led people to believe that it is a product that can be bought. There is a variety of black box software available on the market, which embeds powerful algorithms, making their misuse proportionally more dangerous. As with any other technology, data min-ing is easy to do badly. Analysts may apply inappropriate algorithms to data sets that call for a completely different approach, for example, or models may be derived that are built upon wholly specious assumptions. Therefore, an understanding of the statis-tical and mathemastatis-tical model structures underlying the software is required.
Data mining is a discipline. In our view, humans need to be involved at every phase of the data mining process. In a game development context, at least in some steps, those humans need to be the people who design, code, test and ultimately play, games. There is no quick fix for a game developer wanting to employ data mining on e.g. user telemetry data, however, as noted by Larose (2004), purely explorative methods can be quite powerful in their own right, and require much less training and specialized knowledge than semi-automatic or automatic processes, although a gen-eral understanding of the data is always required.
2.2 The knowledge discovery process in data mining
It can be tempting to approach data mining haphazardly, without an overall strat-egy. Therefore, a cross-industry standard was developed in 1996, which took an in-dustry-, application- and tool-neutral approach to data mining, defining the Cross-Industry Standard Process for Data Mining (CRISP-DM) (www.crisp-dm.org)
(Chapman et al, 2000). CRISP represents a fundamental good approach to data min-ing processes, and various specialized variants exist aimed towards particular indus-tries or problems. It can seem a bit cumbersome to apply the full CRISP process to each and every question that we want answered via game telemetry, and in practice, some of the phases will be very quick to go through, especially if the analysis has already been performed on a previous version of a game or earlier user-behavior da-taset. However, CRISP provides a non-proprietary and freely available standard pro-cess for fitting data mining into the general problem-solving strategy of a business or research organization. It is an iterative process, fitting well into the typical agile and rapid-iterative approaches applied in game development (Mellon, 2009). The phase sequence of CRISP is adaptive – i.e., the next phase in the sequence of six defined phases depends on the outcomes association with the preceding phase. For example, it may be necessary to return to the data preparation phase for refinement before moving on with the modeling phase – it is a typical situation that the solution to a question leads to further questions, not the least when working with player behavior in games. Importantly, lessons learned from past projects should be brought to bear as input into new projects.
In the context of game development, the data in question can originate in game telemetry (data from installed game clients) or any of the traditional sources of busi-ness intelligence, e.g. production and marketing (Romero, 2008; Mellon, 2009; Dra-chen and Canossa, 2011). The CRISP phases are as follows (modified from: www.crisp-dm.org, and Larose (2004)):
1. Business/research understanding
Define the project objectives and requirements
Translate the goals and restrictions into the formulation of a data mining problem definition.
Prepare a preliminary strategy for achieving these objectives. 2. Data understanding
Collect the data (extract the data from a database).
Use exploratory data analysis (EDA) to familiarize yourself with the data and discover initial insights.
Evaluate the quality of the data.
If desired, select interesting subsets that may contain actionable patterns. 3. Data preparation (typically the most time-consuming phase)
Prepare from the initial raw data the final data set that is to be used for all subsequent phases.
Select the cases and variables you want to analyze and that are appropriate for your analysis (this is sometimes performed after transformation and cleaning).
Perform transformations (or consolidation) on certain variables, if needed. Under transformation, the selected data are transformed into the form needed to perform the mining procedure in question, e.g. normalizing values. Cleaning: Clean the raw data (remove noise and irrelevant data) so that it is
ready for analysis. 4. Modeling
Select and apply appropriate data mining technique (modeling, exploration, synthesis etc.). Different techniques may be used for the same problem. If the technique results in a model (most do outside of explorative analysis),
calibrate model settings to optimize results.
The process can be repeated with new selections and transformations of the data, gradually refining the result or integrating new relevant data sources, in order to get different, more appropriate/valuable results.
5. Evaluation
Evaluate the results and/or models delivered for quality and effectiveness. Check that the model in fact achieves the objectives set for it in the first
phase.
Check whether some important facet of the problem has not been accounted for sufficiently.
Come to a decision regarding use of the data mining results. 6. Deployment
The discovered knowledge is presented to the relevant stakeholder (design-ers, produc(design-ers, marketing, management), using a choice of knowledge repre-sentation, e.g. a visualization or report. E.g., a game telemetry analyst devel-ops a heatmap of a multi-player shooter level to present to the designer of that level (see also Chapter 17).
Make sure the presentation is done in such a way that the target stakeholder can understand. Explain the result in a way that helps the target stakeholder to understand, interpret and act upon the data mining results.
The target stakeholder carries out deployment within the organization. 2.3 Database navigation
When dealing with data stored in databases – irrespective of the format – there are three fundamental navigational tasks that the chosen database format must allow: drilling down (vertical), drilling across (horizontal), and controlling time. The latter is the most obvious: we have to be able to select data from only a specific build, a par-ticular user test, or segment of time. We mention these here because basic navigation of game telemetry data is often the first step needed in data mining, and sometimes the only step needed to answer questions.
Drilling (or navigating) is a method for interactively navigating or exploring data horizontally and vertically in the dimensional structure of a database.
Drill-across (or drill-through) navigation occurs across multiple dimensions (used commonly with OLAP, Online Analytical Processing, a class of functions that enable users to dynamically and in real-time analyze and navigate data, e.g. in a data cube), and is used for e.g. comparing different variables for a specific dimension, for example playtime and item purchases for all players from Europe. Similarly, identify-ing the top 10 most profitable players in a free-to-play game from each game server, is an example of a drill-across analysis. Drill-across navigation can operate across dimensions, measures or attributes in OLAP and data warehouses.
Drill-down navigation is a means for exploring data in greater detail (more low-level) than is currently displayed (Kim et al., 2008). The term drill-down is commonly encountered in game data mining contexts. This is because drill-down analysis is a method for in-depth analysis of data, which makes it very useful to espe-cially player behavior analysis, where the root causes of behavioral patterns are often nestled deep within the data – e.g. a specific checkpoint missing, a single mob being too powerful, a pathway between to areas going unnoticed (Kim et al, 2008; Drachen and Canossa, 2011).
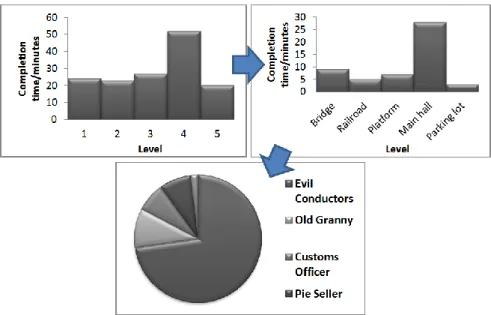
For example, viewing aggregated completion times across 10 levels in a game, and noting that level 5 completion times are very high, drilling down would then be to look at the data for pertaining to level 5 only for each player. This kind of process is commonly used in game analytics to locate the root causes of an observed effect. See e.g. Romero, 2008; Kim et al., 2008; Drachen & Canossa, 2009a and Chapter 14 for examples.
To take an example (Figure 12.1): A game developer considers a simple breakdown of data consisting of a few variables, here the average completion times for the levels of a game (5 levels). At this top level, he notices that a level appears to take longer to complete than others (level 4). This is not intended by the design, and could therefore indicate a problem. In order to explore why, the underlying data need to be exposed, in this case, a breakdown of the completion times for individual com-ponents of the level. In this more detailed view of the data, it may be noticed that a specific sector of the level is where the players spend a lot of time (Main Hall). Drill-ing down further into the metrics data captured from the level, it may be found that the root cause is that players have trouble beating a specific type of enemy and keep dying (Evil Conductors – they stamp your ticket really, really hard), whose difficulty can be adjusted to accommodate. If the cause of the observed pattern is not obvious from looking at the data, it can be useful to consider the actual game environment – e.g. finding that players do not spot the big weapon they needed in the room preced-ing the boss. Drill-down analysis work in this way to identify the root cause of pat-terns that emerge much “higher” in the data. At the lowest level of a drill-down analy-sis are the raw data.
There are a number of other fundamental actions that users should be able to take in a database system, e.g. filtering, sorting, morphing etc., but a full discussion is out of
scope here – the reader is referred to Han et al. (2005) and Larose (2004) for addition-al information.
Six myths about game data mining
1. With game data mining, we can fire our designers as the testers/users will tell us what they want! We will save heaps of money! Wrong: mining game-play telemetry data is incredibly useful for evaluating and testing design, but telemetry data cannot tell you what design is, not how your players feel or if they have a good experience – game data mining is not a replacement for good game design.
2. With game data mining, we do not need user testing! We can fire our testing department and save heaps money! Wrong: Game data mining goes hand in hand with user-oriented testing and -research, but does not replace it. With mining of gameplay metrics data, a powerful supplement to playtesting, usa-bility testing and physiological testing is gained.
3. Game data mining is autonomous, requiring little human oversight! The tools are automated; we just turn them loose on our data and find the answer to our design/business/marketing problem! We can fire our business analysts and save heaps of money! Wrong: There are no automatic tools that will solve your problems – data mining is a process, as highlighted by CRISP. Additionally, data mining requires significant human interactivity at each phase, and also for the subsequent quality monitoring.
4. Game data mining pays for itself quickly! Let us invest in tools, infrastruc-ture and people right away and save heaps of money! Wrong: well, partly wrong. The return rates vary, depending on the specific situation, the game, the size of the developer or publisher, etc. The return will be there in terms of improved knowledge, but careful planning needs to go into deciding on an initial setup and the strategic and practical goals.
5. Game data mining will identify the causes of all our problems! We will make heaps of money integrating game data mining in our business! Wrong: the knowledge discovery process will help identify and uncover patterns of be-havior in the data whether user-derived or business-derived, and these can be highly valuable, but it requires human interpretation to identify the causes of the patterns (with the help of analysis).
6. We need to obtain data on everything! Data equals value, we will make a heap of money! Wrong: you need the right data, to solve the problems you have. Just measuring everything will waste resources. Getting the right data requires as much thought as their analysis.
2.4 Separating gold from rock in data mining results
When running a game data mining analysis, for example a classification analysis of the behavior of players during development of a game, there will typically be more than one result. So how do we know which one to pick?
Data mining allows the discovery of patterns in the data, and there may be quite a lot of them millions if the dataset is big enough and heterogeneous enough. Finding the best, most useful and interesting pattern is not always straight-forward. In order to choose the best pattern (or result), we need to be able to evaluate the patterns based on how “interesting” or useful, they are to the specific situation. There are three ap-proaches that can be employed:
Objective measures: these are based on the war data themselves, e.g., validity of the patterns when tested on new data with some degree of certainty. They are by far the easiest to employ and provide hard numbers to evaluate results.
Subjective measures: these are based on the data and the user of the data. As noted by (Geng and Hamilton, 2006) “to define a subjective measure, access to the users domain or background knowledge about the data is required. This access can be obtained by interacting with the user during the data mining process or by explicit-ly representing the users’ knowledge or expectations.” Novelty or understandability of a result is an example or a subjective measure of interestingness.
Semantic measures: considers the semantics and explanations of the patterns. A good example is “utility” or “actionability” as an evaluation mechanism.
Identifying and measuring the interestingness of patterns is essential for the eval-uation of the mined knowledge and the data mining process in general. Concretely, interestingness measures are useful because they can be used to: 1) prune uninterest-ing patterns duruninterest-ing the minuninterest-ing process so as to narrow the search space and thus im-prove mining efficiency; 2) rank patterns according to the order of their interesting-ness scores; 3) be used during post-processing to select interesting patterns (Larose, 2004). Fortunately, interestingness measures have been the focus of considerable research interest. All of the method groups outlined above have associated sugges-tions of interestingness measures, although most are objective.
2.5 Data formats
An important aspect of working with game telemetry data is how they are stored and accessed. It is one thing having collected behavioral data from 10 million players, another to store these in a way that makes it as easy as possible to apply data mining techniques to them. There are currently a plethora of database formats available, with SQL/MySQL being one of the most commonly used, and used to be the default for new web applications. However, SQL has problems with scaling up to very large datasets, despite recent innovations such as SSD enhancements and 32+ core scalabil-ity, and can be overly complex for many operations (and making changes to large databases can be hard). Therefore, in recent years more “elastic” means of data stor-age, running on cloud computing frameworks with up to 100´s of servers, offering scaling on demand. These new database formats are commonly referred to as
“NoSQL” (and NewSQL) and have become popular in big data contexts due to the need for fast, efficient data access. A full review of different database formats is dra-matically out of scope, but interested readers can find useful information in Chapter 6 and 7 of this book. It is also recommended to look the NoSQL database formats Mon-goDB, Cassandra, Couch and HBase (Hadoop), for information on newer database formats. In general, the Net is a good source for information on database formats. Data mining methods are applicable to any kind of data or media and independent on the specifics of the repository of the data (relational database, unstructured database, multimedia database, time-series database, flat file, object-oriented database, spatial database, etc.). However, algorithms may vary when applied to different types of data, e.g. images vs. behavior measures.
2.6 Tools for game data mining
There are a wide variety of software tools available for data mining. Some are special-ized for particular sectors of industry or research; others are more open and accom-modating to game data mining. However, in our experience, some software vendors have a tendency to market analytical software as being “plug and play” applications that will provide solutions to all kinds of problems without the need for human inter-action. This is blatantly not the case there is a strong need for a human element in data mining, possibly especially in games, where the fundamental goal of providing the user with a good experience is at the forefront; results, therefore, need to be interpret-ed with user experience in mind (Drachen et al, 2009a).
In recent years, several companies have started to offer middleware technologies specifically for game data mining or game analytics (e.g. www.gameanalytics.com, www.playtomic.com, www.honeytracks.com, www.kontagent.com), supplementing the tools and services offered by traditional analytics companies. However, game-specific data mining tools remain in their infancy, and traditional game data mining companies, used to working with, e.g., business analysis or web analytics, do not always have the intimate understanding of game design necessary to fully understand game telemetry data, and deliver relevant and interesting results. This has led to sev-eral major publishers, notably Microsoft Studios Research, to develop their own solu-tions to game analytics (Kim et al, 2008). The barrier of entry for non-experts in game design and data mining remains, therefore, relatively high. However, the current rapid development in game telemetry analysis favors a wider availability of solutions and methods evolving over the next few years.
In the open-source market, there are many freely available tools developed by re-searchers and practitioners that are useful to novices and experts alike, for example tools like Weka (www.cs.waikato.ac.nz/ml/weka/), which is used to supervised learn-ing, RapidMiner, a general data mining tool or Shogun, a library for large scale ma-chine learning (www. shogun-toolbox.org), Pymf, a toolbox for matrix factorization in Python (pymf.googlecode.com), or QGIS for spatial problems (www.qgis.com). There are many of these tools (see e.g. Chapters 7,10,14). At the practical level, the easiest way to locate an open-source toolbox useful to a particular data mining task is
to figure out what type of problem we are dealing with, and then browse the Net for relevant tools.
2.7 Practical issues in game data mining
There are a range of important issues to consider when planning to or performing collection of game telemetry and mining of this type of data. Confidentiality of user data, security of hosting servers, transparency of analysis results, and effective pre-processing approaches are among the most important. In this section, these issues and their implications are briefly introduced, but the interested reader is strongly advised to consult the literature at the end of the chapter for more detail.
Transparency: the patterns discovered by data mining tools are useful only if they are interesting and understandable to the user they are aimed for. Any data min-ing result (model) should be as transparent as possible, i.e. the result should describe a pattern that is intuitively interpretable and which is followed by an explanation, tar-geted at the specific stakeholder or user of the result e.g. decision trees are intuitive and almost self-explanatory in terms of their results, but neural networks are compara-tively opaque to the non-expert (as are non-linear models in general). For example, a game designer may not be a statistics expert and therefore providing the results of a variance analysis in the standard statistical reporting form (a series of values), will not be conducive to the designer understanding the result and being able to act upon it. Transparency is vital to ensure that the various users of game data mining results are able to understand and act upon them. Another issue in visualizations is screen real-estate, information rendering and user-pattern interaction. Interacting with raw data or mining results is important, because it provides the means for users to focus and re-fine the mining tasks. Additionally, it allows users to model the discovered knowledge from different angles or conceptual levels.
Data cleaning: data analysis can only be as good as the data that is being ana-lyzed, and most algorithms assume the data to be noise-free. This is an important assumption. Depending on the technical back end, game telemetry data may be more or less complete or saddled with different types of problems. Data cleaning (or cleans-ing) is the process of detecting and removing inconsistencies from data, towards im-proving and ensuring the quality of the data (Han et al, 2005; Larose, 2004).
Quality problems in raw data come in many forms, e.g. misspellings during data entry, missing information or the presence of invalid data. When multiple sources of data are integrated, for example in a data warehouse, or analysis run across multiple data sources (e.g. telemetry from different games), the requirement for careful data cleaning increases due to the potential for error introduced when datasets are com-bined.
Performing data mining on low-quality data (“dirty data”), with, for example, missing or duplicate information, can compromise the validity and accuracy of the results, or even worse, can lead to outright wrong results, following the “garbage in, garbage out”-principle in data mining. As a consequence, data cleaning and data transformation (commonly referred to as pre-processing) is vital, but is often errone-ously viewed as lost time. As frustrating as data cleaning may be, it is one of the most
important phases of the knowledge discovery process. Data cleaning is a complex topic. Unfortunately, it is not possible to provide simple guidelines to address this topic. There is also a general lack of research in the area despite the importance.
Performance and sampling: many methods for data analysis and interpretation were not originally designed for the very large datasets that exist today. In game de-velopment, telemetry datasets easily reach the terabyte size for online social games or for large commercial games with hundreds of thousands or millions of players. In addition to the size of the data, the dimensionality of the data, i.e. the number of vari-ables in the dataset (e.g. the number of varivari-ables such as completion time, class, level, etc., known for each player in a game), is decisive to the choice of data mining tech-niques. In general, the search space grows exponentially with the number of dimen-sions in a dataset, and its effect is so dramatic that it is currently one of the most im-portant research problems in data mining.
Many techniques have issues with scalability and efficiency at large scales and dimensionalities, especially those that scale quadratically with dataset size, or algo-rithms with exponential or polynomial complexity (Mahlman et al, 2010). Sampling is a possible solution, i.e. mining part of the dataset rather than the whole, and extrapo-lating results from the sample to the whole dataset. Sampling has its own complexities and challenges, for example in relation to ensuring a representative sample that cap-tures the feacap-tures of the entire dataset. Sampling is covered in more detail in Chapter 9. Another approach is parallel programming, where the dataset is subdivided and results for each subset merged later.
Security: is an important issue with any game telemetry data collection, whether intended for low-level work or strategic decision making. Game telemetry data are generally considered confidential in the industry, and should be kept safe, which in-cludes considerations on how to handle data access, transfer of data and transfer of results.
Social and privacy issues: One of the key issues in data mining is the question of individual privacy. The immense collections of data on people, and the many op-portunities for collecting additional information, combined with data mining, makes it possible to analyze, e.g., routine business transactions, and obtain a substantial amount of information about the habits and preferences of individuals or businesses. Additionally, when data is collected for player profiling, behavior, correlations of personal data with other information, and so forth, sensitive and private information about individuals or businesses is collected and stored. This is controversial given the confidential nature of such data, and the potential illegal access to it. Another issue is how the data is being used. Because this type of data is valuable, databases of all kinds are traded. It is, thus, important to be aware of what data and analysis results that are being distributed, e.g. email addresses of players.
Collection strategies: There are two fundamental ways to obtain data from an installed game client or hardware unit (e.g. Xbox 360, PS3, PSP, smartphone), irre-spective of the protocol employed (e.g. restAPI). Choosing the right strategy for cap-turing data from game clients is vital to avoid excessive data cleaning issues and data loss. There are pros and cons to both approaches, as follows (adopted from Mahlman et al (2010)):
Fire and forget: game telemetry data are stored locally in queues. Depending on the memory allocated to telemetry tracking, the size of the queue can vary. The game client will attempt to transmit data to the collection server, but may or may not receive confirmation of receipt from the server. If a queue is full, the oldest stored data are deleted first to make space for new data. This solution ensures a specific memory use and is, thus, useful for mobile platforms or consoles where memory resources are limited; or for high-frequency data (e.g. navigation), where some random losses are unimportant.
Reliable metrics: the game client keeps storing telemetry data until they have been successfully transferred to the collection server, and confirmation of receipt has been received. The solution is resistant to loss and useful in situations, where the data must be collected as completely as possible, e.g., during playtests. In both cases, a key rule is that game execution must not be affected by the collec-tion or transfer of telemetry data to the colleccollec-tion server. The approaches can be combined, e.g., using limited queuing for navigational data and unlimited queu-ing for important variables.
2.8 Data mining approaches
It is difficult to generalize about data mining methods given the many fields of research and business that employ data mining techniques. However, the various methods are usually divided into either the categories descriptive/prescriptive or unsupervised/supervisedlearning. Depending on the person or book being consult-ed, either of these two divisions will be used – they are not; however, completely interchangeable – descriptive data mining is not the same thing as unsupervised learn-ing, for example. To be more precise, predictive/descriptive data mining are concepts, and supervised/unsupervised learning are concrete categories of methods – and not the only ones used for data mining, although the main ones. This means that for ex-ample correlation methods are referred to as descriptive data mining, but not assigned to the unsupervised learning group of data mining methods. Similarly, interpolation is a technique used for predictive data mining, but is not a form of supervised learning. As with so many other things, the difference is good to be aware of, but not vital in practice. In this chapter, we adopt the division of methods into unsupervised and su-pervised categories.
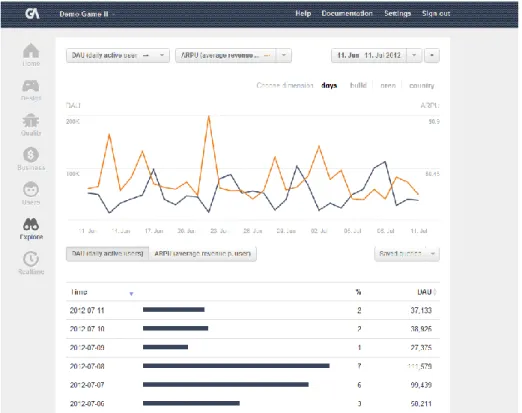
Descriptive data mining is used to describe the general properties of existing data in a concise way. In addition, it presents any interesting characteristics of the data without having a predefined target. For example, exploring the number of daily users and pointing to a sharp increase in active users on a specific day, say Saturdays. Some authors equate descriptive data mining with statistics.
Predictive data mining is used to forecast explicit valued, based on patterns determined from known data. In other words, it is used to attempt to predict some-thing based on inference on the data at hand. For example, predict how many paying users a game will have based on data on previous subscriptions.
Supervised learning originates in machine learning – a branch of artificial intel-ligence science that is concerned with the design and development of algorithms that allow computers to evolve behaviors based on data. A learning algorithm takes ad-vantage of a test dataset, “training data” (observed examples), to capture characteris-tics of interest of the underlying, unknown probability distribution of data and make intelligent decisions based on their properties. In supervised learning, training data is combined with knowledge of desired outputs. The output of the algorithm can be a continuous value (regression) or a prediction of a class label of the input object (clas-sification). The task of the supervised learning algorithm (the “learner”) is to predict the value of the function for any valid input, after seeing a number of training exam-ples (i.e. pair of input and target output). In order to achieve this ability, the algorithm has to generalize from the training data to unknown situations in a way that is reason-able. In the context of digital games, predictive data mining can be used to forecast when a player will stop playing, if a player will convert from a non-paying to a paying user, what types of items players will purchase, classify player behavior, etc.
Unsupervised learning also originates in machine learning, and also focuses on fitting a model to observations. However, unlike supervised learning, there is no a priori output. The input objects are generally treated as random variables, and a densi-ty model built for the dataset. For example, if we want to classify player behavior, we can use unsupervised learning if we not know how the behaviors varied, or if no pre-vious classes had been defined. We can use supervised learning if, for example, we already run a classification on earlier data, and are interested in fitting some new players into these pre-defined classes.
2.9 Data mining methods
The classification of data mining methods beyond descriptive/predictive and super-vised/unsupervised has always been a somewhat sensitive issue in data mining, lead-ing to some confusion when attemptlead-ing to learn about the different methods – a popu-lar class or concept may have dozens of different names (Han et al., 2005). In the context of game data mining, some of the most common methods used are:
Description: is when analysts are simply trying to describe patterns of trends in game data, and is usually accomplished using Explorative Data Analysis (EDA), which is a graphical method for exploring data in search of trends or patterns. For example, plotting class level vs. playtime per level in a bar chart across six classes in a MMORPG, and finding that the “warrior” class progresses more slowly than the other classes. Descriptions of patterns often suggest possible explanations for them. EDA is particularly useful for basic analysis and for obtaining an understanding of the game data prior to the application of advanced algorithms.
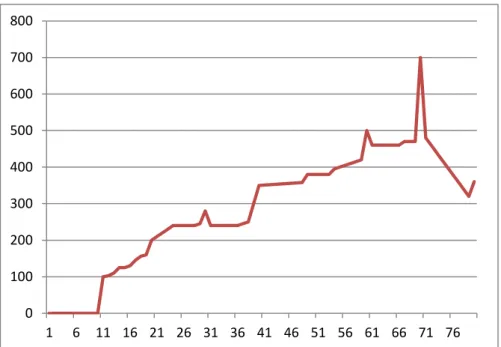
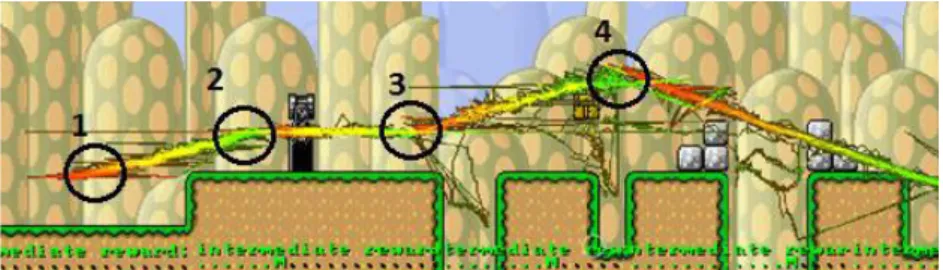
Characterization: is simply the summation of general features of objects in a target class (or sample), producing a characteristic rule. For example, we may want to characterize all players who complete the first 100 quests in a RPG in less than five hours (an example of characterization is shown in Figure 12.2, where telemetry data from the ranges at which weapons were used in a FPS are averaged across the weap-ons).
Discrimination: is when features of objects across two classes (or samples) is compared. For example, comparing the most popular item purchases for players be-tween 10-15 and 16-20 years, or comparing the navigation path of two types of play-ers through a game level (Chapter 7,14,19; Drachen and Canossa, 2011). Discrimina-tion is identical to characterizaDiscrimina-tion except that discriminaDiscrimina-tion results include compara-tive measures.
Classification: is used to organize data into classes, which is hugely useful to game development. For example, classifying players based on their potential to be-come paying users vs. non-paying, or classifying player behavior in a shooter game to test if the players play the game as intended by the games’ design. Classification uses class labels to order objects in a data collection, normally using a training data set where all objects are already associated with known class labels (e.g. playtime per level associated with character class). The classification algorithm used leans from the test data and builds a model that can be applied to other or future data.
Estimation: is similar to classification, but the target variable is numerical, not categorical. In statistics, methods such as regression and correlation are estimation methods. For example, we are interested in knowing a value, not obtain information about how our data groups into distinct classes. For example, estimating how much money a player will spend on in-game items, or how long a player will continue play-ing a specific game. In estimation, models are built usplay-ing trainplay-ing data of complete records, which provide the value of the target variable as well as the predictors (causal variables). For new observations, estimates of the value of the target variable are made, based on the values of the predictors. For example, using simple regression to find the relationship between two variables, such as playtime and money spent on in-game items.
Prediction: is reminiscent of classification and estimation, but with prediction, we want to know about the future. The core idea is to use a large number of known values to predict possible future values. For example, how many players an MMORPG will have three months into the future, or when there will only be 1000 active players left in a social casual game or how many players are needed to reach the critical threshold when player communities become self-sustaining. There are many approaches to prediction, from traditional statistical methods to more special-ized knowledge discovery methods, such as neural networks, decision tree analysis, and k-nearest neighbor (Mahlman et al, 2010). Prediction is one of the most widely applied data mining methods in the analysis of data from multi-player and massively multi-player persistent games, where predicting the effect of design changes or the behavior of the player community, is important for revenue. Prediction can be used to forecast in many contexts around game development and -publishing.
Clustering: is a lot like classification, in that the aim is to order data into classes. However, the class labels are unknown and it is up to the clustering algorithm to dis-cover what the classes are and evaluate their acceptability. The core goal of clustering algorithms is to group or segment objects (e.g. players, asset, items, games or any observation, case or record) in such a way that the similarity between objects in one group (cluster) is high (intra-cluster similarity), while between groups is dissimilar (intercluster similarity).
Association (affinity): when performing an association analysis, the goal is to find features (attributes) that “go together”, thus defining association rules in the data. An association rule specifies that if X, then Y, e.g., “if players buy Stribed Trousers of Strength +3, they will also buy Girdle of Charisma +2.” The association rule is accompanied by a measure of support, and of confidence. The support threshold iden-tifies the frequency of the features occurring, and the confidence threshold defines the probability one appears when the other does. For example, it may be found that out of 1000 players, 500 bought the Stribed Trousers of Strength +3, and of those 500, 250 bought a Girdle of Charisma +2. The association rule then specifies: “if players buy Stribed Trousers of Strength +3, they will also buy Girdle of Charisma +2, with a support of 50.”
There are many other methods that can be used for game data mining, such as outlier analysis (looking at the exceptions to normal behavior, which can be pretty useful in the analysis of player behavior, e.g. for locating gold farmers), evolution analysis, and deviation analysis (the investigation of time related data that changes as a factor of time). However, these are out of scope for this chapter. The reader is re-ferred to the reference list for further information.
Fig. 12.2. An example of a descriptive analysis: A simple bar chart providing an overview of the average distance at which playtesters of the multiplayer shooter Fragile Alliance (Eidos Interactive, 2007) used different weapons, during early production of the game, for a particular map (note that the published version of the game has other rates and weaponry) (used with permission from IO Interactive).
3
Unsupervised Methods
As discussed above, unlike supervised models, in unsupervised learning there is no a priori defined output, i.e. we are not trying to predict target values, but rather focus on the intrinsic structure of and relations in the data. In particular, the data min-ing algorithms searches for patterns among all variables of a given dataset. A tradi-tional example is clustering, e.g. for classifying player behavior, causes for game crashes, etc. In such examples, we are not typically sure how these behaviors vary or whether particular causes are more typical than others. In the following sections some basic mathematical properties are described in the interest of accuracy.
In this section, we concentrate on a few examples of the application of unsu-pervised models for analyzing game telemetry data. We will give an overview over a few common methods applicable for unsupervised data analysis in games. We will demonstrate the usefulness of recent data mining techniques in terms of acquiring interpretable data representations.
3.1 Clustering
In the context of customer behavior analysis in computer game development, cluster (and classification) analysis provides a means for reducing the dimensionality of a da-taset in order to find the most important features, and locate patterns which are ex-pressed in terms of user behavior as a function of these features, which can be acted upon to test and refine a game design (or specific parameters of a design) (see Drachen et al., 2012, for a more in-depth discussion). For example, figuring out how people play the game or identifying groups of players who display unwanted behavior. Clustering is thus a highly useful data mining method, containing a plethora of algorithms, the most commonly used being k-means (Golub and van Loan, 1996).
There are however notable challenges (Drachen et al., 2012): 1) The potentially high dimensionality of behavioral data from games
2) There is sometimes a need to mix datatypes, e.g. binominal and categorical features which makes normalization challenging
3) Telemetry datasets can be noisy
4) Clustering generally require informed decisions as to the number of clusters to extract 5) The results have to be actionable. What this means is that it should be possible to relate the results to the design of the game in question, which entails converting results to a language understandable by the target stakeholder group (designers, marketing, management etc.).
Successful clustering of player behaviors in computer games requires that these chal-lenges are addressed. Furthermore, it is important to note that the integration of knowledge of the design of the game being investigated is necessary to guide the process of selecting which behavioral variables (or features) to work with. Also, de-pending on the goals of the analysis, different clustering algorithms may be more or
less applicable (Thurau and Drachen, 2011), because the algorithms have different properties (this is discussed in further detail below).
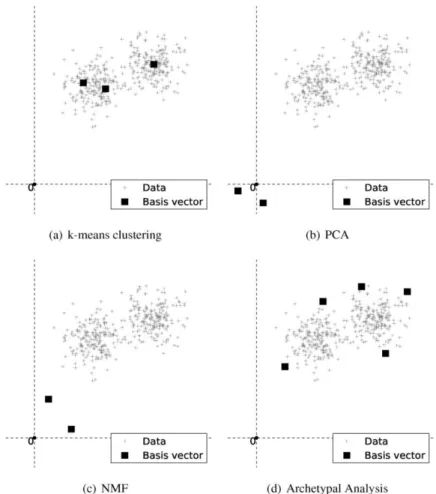
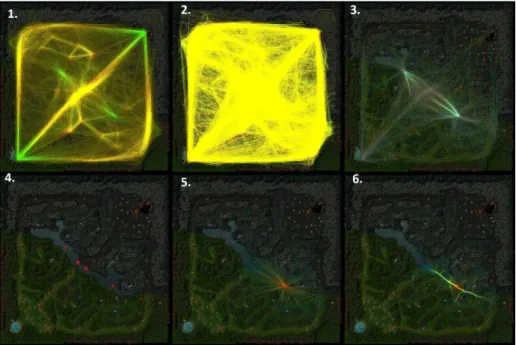
To exemplify the process of clustering, we applied k-means clustering to a simple bivariate (playtime and character level) dataset derived from World of Warcraft (ap-prox. 70,000 characters) Figure 12.2 shows the result, indicating that there are rough-ly two or three separate “clouds” of behaviors in the dataset. It can be seen that the resulting cluster centroids (the central point in each cluster cloud) or basis vectors reside within the data and represent certain cluster regions (top left diagram), i.e. one particular cluster center can now be used to represent a vast number of data samples. Each data sample is assigned to exactly one cluster centroid. This is, arguably, the most common way of cluster analysis as it tries to approximate larger dense data dis-tributions by one particular cluster centroid. However, various other unsupervised methods exist (e.g. Principal Components Analysis, Archetypal Analysis and Non-negative Matrix Factorization – results of which are shown in the other diagrams of figure 12.3) in that yield different cluster centroid locations and are less restrictive with respect to cluster membership of individual data samples. Often, these methods have advantages over the standard mean-based approach and can lead to more inter-pretable data representation (Thurau & Drachen, 2011; Drachen et al., 2012).
Fig. 12.3. Different cluster/matrix factorization methods can yield completely different views on the same game telemetry data.
3.1.1 Clustering – formal basis
Mathematically, when running a cluster analysis we are dealing with n samples of d-dimensional vectorial data gathered in a data matrix . The problem of
de-termining useful clusters corresponds to finding a set of k<<n centroid vectors
. If we express the membership of data points in V to the centroids in W using
a coefficient matrix , we note that clustering can be cast as a matrix factorization problem which aims at minimizing the expected Frobenius norm . For example, for k-means clustering, where each data sample exclusively belongs to a particular cluster center, the columns of H are all zeros, except the row to the i-th cluster centroid which is 1, assuming the i-th cluster centroid is the closest.
Generalizing clustering as a matrix factorization task immediately extends the range of applicable approaches. Common methods to achieve the desired factorization include principal component analysis (PCA) (Jolliffe, 1986; Golub and van Loan, 1996), non-negative Matrix Factorization (NMF) (Paatero and Tapper, 1994; Lee and Seung, 1999), or Archetypal Analysis (AA) (Cutler and Breiman, 1994), among oth-ers. However, resulting basis vectors (or cluster centroids) W considerably differ among the mentioned algorithms. While all mentioned methods roughly try to mini-mize the same criterion (the expected norm ), they impose different straints that yield different matrix factors. For example, PCA (Figure 12.3(b) con-strains W to be composed of orthonormal vectors and produces a dense H, k-means clustering constrains H to unary vectors, and NMF (Figure 12.3(c)) assumes V, W, and H to be non-negative matrices and often leads to sparse representations of the data. While the mentioned factorizations have their specific application in data analy-sis, it is often not obvious which method to choose for a particular task. Therefore, we will first take a closer look at the specific requirements of data analysis in games.
A common goal of unsupervised data analysis in games is player categorization, or grouping (the supervised learning equivalent is classification), ideally resulting in representations of the telemetry data which is interpretable by non-experts. Ideally, one could assign a simple expressive label to each found basis vector or centroid. While there is no objective criterion on what a descriptive representation is, it is wide-ly assumed that approaches yield interpretable results when they embed the data in lower dimensional spaces whose basis vectors W correspond to actual data points. This is e.g. the case for Archetype Analysis (AA) as the basis vectors or archetypes the method produces are restricted to being sparse mixtures of individual data points. This makes the method interesting as a means for game data mining as it does not require expert knowledge to interpret the results. This contrasts with other dimension-ality reduction methods, such as PCA (Jolliffe, 1986), where the resulting elements can lack physical meaning (Figure 12.3), and NMF, which yields characteristic parts (Figure 12.3) (Finesso and Spreij, 2004). K-means clustering is similar to AA as the basis vectors reside within cluster regions of the data samples. However, the centroids do not necessarily have to reside on existing data samples.
Taking a closer look at Archetypal Analysis, we note that it uses a constraint that expresses data as convex combinations of certain points in V, exemplary resulting clusters (Figure 12.3). It can be seen that the resulting basis vectors come to reside on the convex hull of the data distribution, and thus, unlike most other methods, data is expressed by the most extreme and not the most average samples. Searching for cer-tain extremal elements in a set of data as it is done for AA accommodates human cognition, since memorable insights and experiences typically occur in form of ex-tremes rather than as averages (on a side note, Philosophers and Psychologists have noted this for long, since explanations of the world in terms of archetypes date back to Plato). In contrast, k-means clustering focuses on the average, and is therefore in the context of other centroids usually more difficult to interpret. While the centroid vec-tors all cover different regions of the data space, their overall similarity is often too high as it would help a human observer in assigning it a concrete label.
The AA problem can be formulated as where
to unary column vectors [ ] In other words, the factorization approximates V using convex combinations where the basis vectors W = VG are data points selected from V. The goal now is to determine a basis that minimizes the Frobenius norm E = .
When minimizing the Frobenius norm, we have to simultaneously optimize W and H, which is generally considered a difficult problem and known to suffer from many local minima. AA, as introduced in (Cutler & Breiman, 1994), applies an alternating least squares procedure, where each iteration solves several constrained quadratic optimization problems. It solves the case where G is restricted to convexity instead of to unarity. It is important to note that Archetypal Analysis originally was restricted to smaller datasets due to the demanding computation; very recent work has discovered ways of extending Archetypal Analysis to large-scale datasets (Thurau et al, 2009; 2010), making the method effective for implementation in the context of game met-rics. Namely, the authors introduced convex-hull non-negative matrix factorization (CHNMF) and simplex-volume maximization as an approximation to AA (Thurau et al, 2009; 2010) (A Python implementation of the two methods is available from pymf.googlecode.com).
3.1.2 Example 1: Clustering players in Battlefield 2: Bad Company 2
The following case study is drawn from Drachen et al. (2012), and is focused on Battlefield 2: Bad Company 2 (BF2BC2) (2010, Electronic Arts), a first person shooter with tactical wargame elements, usually played in online multiplayer supporting up to 32 players, but including off-line (single-player campaign) capability.
In the multi-player mode of BF2BC2, each player controls one character in a team, playing against another team. There are various types of modes of play, and players can select between a range of classes, referred to in the game as “kits”. These are: Assault, Demolition, Specialist, Recon and Support. Each class provides different starting equipment. In addition, players can earn awards, ranks and special equipment.
Drachen et al. (2012) used behavior telemetry data from randomly selected 10,000 BF2BC2 players, all playing on PC. A total of 11 variables (features) were included in their analysis, with some of these being compound features. Given the hundreds of pos-sible behavioral variables that can be tracked from players in BF2BC2, selecting these 11 required consideration. Drachen et al. (2009), working with data from Tomb Raider: Underworld, suggested that any initial and explorative cluster or classification analysis of player behavior should focus on behaviors related to the central mechanics of a game, and this principle was adopted, leading to a selection of features relating to character performance (score, skill level, accuracy etc.) and game asset use (kit stats, vehicle use), and playtime - as follows (quoted from Drachen et al., 2012):
Score: Total number of points scored
Skill level: An aggregate measure of player skill
Total playtime: The sum total of time the player´s account has been active Kill/Death ratio: K/D ratio, the number of kills the player has scores divided
with the number of deaths suffered
Score per minute: The average number of points scored per minute of play while on active combat missions
Deaths per minute/Kills per minute: Dpm/Kpm - Average deaths or kills per minute
Rounds played: The number of game rounds the player has played
Kit stats: The number of points scored with each kit (class) and the number of kills and deaths for each class
Vehicle use: Total time spent in air, water, land-based or stationary vehicles Following pre-processing and normalization of the telemetry data, two algorithms were applied to the data: k-means, which produce cluster centroids (Figure 12.3), and Simplex Volume Maximization (SIVM), a variant of Archetype Analysis extended to large-scale datasets. SIVM does not look for commonalities between players, but rather archetypical (extreme) profiles that do not reside in dense cluster regions, but at the edges of the space spanned by the data points (Figure 12.3). Both algorithms resulted in 7 clusters, but the behavioral profiles that could be extracted from these varied some-what – this is to be expected given the different natures of the algorithms. This num-ber was decided upon using Scree plots and means squared error, two techniques for deciding on the number of clusters to work with. We will here focus the results from the SIVM analysis, which resulted in the following behavioral profiles, three of which are largely independent of the classes in the game, and four which are closely related to them:
Assassins: characterized by having extremely high Kill/Death ratios and highest Kpm ratio, but suprisingly low-middle playtime. Assassins are the most lethal players in the game, but also highly specialized.
Veterans: are the all-round elite. Where the Assassins are specialized, the Veter-ans display the highest or second highest values across all the behavioral varia-bles measured, but have also invested a lot of playtime into the game, indicating that these players are committed and stable. They represent a small fraction of the players, however, on the scale of 2-4%.
Target dummies: These are the opposite of the Veterans, with lowest or very low values for all the behavioral variables, comprising about a quarter of the players in the sample. They have not played BF2BC2 for long, have low K/D ra-tios, often get killed, and their Score per minute is the lowest of all the profiles. Their only redeeming factor is a middling Accuray.
Assault-Recon: These players display high performance with the Assault and Recon kits, correlating with high kill rates and death rates (they are on the front-line), and the second highest K/D rate overall. They also exhibit low accuracy, which may relate to the rapid-fire weapons associated with the assault class. Only about 1.5% of the players are included in this cluster,
Medic-Engineer: These players have very high skill levels and accuracy, score many points (second only to Veterans) and drive in vehicles a lot. Only about 1% of the players are included in this cluster, representing a highly specialized type of behavior.
Assault “specialist”: While this cluster of players mainly plays the assault class, they do it relatively badly. They die a lot, but have invested a lot of playtime into
the game, with low skill, K/D ratio and accuracy. They are not quite at the level of the Target Dummies, but perhaps represent the typical novice player. About 5% of the players fall into this cluster.
Driver Engineers: These players favor the Engineer class and have extremely high vehicle times (4 times higher than any other cluster), i.e. they spend a lot of time driving, sailing or flying the various kinds of vehicles in BF2BC2. They have high playtimes, scores and accuracy, very high K/D ratio but kill very few players, and also die rarely. Only about 1% of the players are included in this cluster.
The latter four behavioral profiles represent well two of the fundamental ways of playing BF2BC2, either combat-oriented or support-oriented.
3.1.3 Example 2: Comparing clustering algorithms in World of Warcraft
Our intention here is to demonstrate how common clustering techniques perform on game metric data with respect to (a) descriptive representations, and (b) cluster sepa-ration. Four different clustering algorithms are applied to find clusters in this dataset, the results compared and evaluated, and recommendations made. The example pre-sented here is drawn from Thurau and Drachen (2011).
The data for this case study contains a selection of approximately 70,000 player records, covering a period of about five years. The telemetry data are player/guild logs gathered from WarCraft Realms (http://www.warcraftrealms.com). The logs show for a certain number of dates the records of currently online players from Euro-pean and United States World of Warcraft realms. In addition, character names, level, class, and guild membership are recorded.
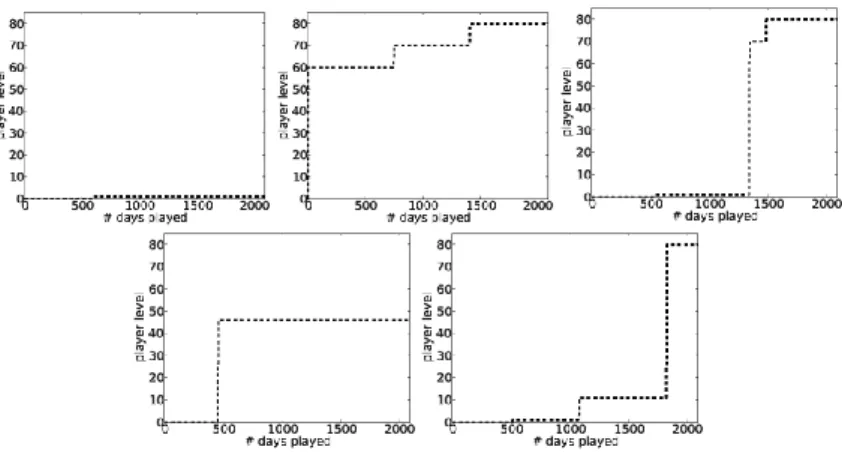
The World of Warcraft dataset contains a set of players recordings, their online time, and their level for a specific date. We aggregate the recordings into a 2:555 dimensional feature vector, where each entry corresponds to the level the player reached for each day in the last 6 years. Note that the maximal level of a character was increased twice via expansion packs (from levels 60 to 70 and 70 to 80) during the period of recording (and in December 7th 2010 a third time, following the end of the data logging period, from levels 80 to 85), usually when a new expansion got released. We applied AA, NMF, k-means, and PCA to the dataset. Note that unsuper-vised methods usually suffer from the problem of having no objective way of defining threshold values, which makes the definition of the number of classes (or cluster cen-troids) to use a subjective decision. These aspects of classification analysis add to the difficulty in adopting these methods by non-experts in a game design/development context. For the presented experiments we set the number of basis vectors/classes to k = 8 (note that we only visualized the first five) based on a consideration of variance explained vs. retaining a useful number of basis vectors with respect to the end goal being to produce player classes that are significantly different behaviorally.
The resulting basis vectors or cluster centroids for AA are visualized in Figure 12.5, and for PCA, K-means and NMF in Figure 12.6, 12.7 and 12.8, respectively. For