Experiencing the Same Road Twice:
A Driver Centered Comparison between Simulation and Reality.
Erwin R. Boer1, Ahna Girshick1, Tomohiro Yamamura2, and Nobuyuki Kuge2
1Cambridge Basic Research,
Nissan Technical Center North America, Inc. 4 Cambridge Center, Cambridge, MA 02142, USA Email: [email protected], Tel. 617-374-9663, Fax. 617-374-9697
2Vehicle Research Laboratory, Nissan Research Center,
Nissan Motor Co. Ltd.
1 Natsushima-cho, Yokosuka, 237-8523, Japan
Abstract: Driving simulators offer many advantages over reality when studying driving behavior. Repeatability of experimental conditions, safety, and cost are some of the motivating factors for using simulators. A relevant research question is to what degree drivers' behavior observed in driving simulators is a reflection of how they drive in reality. To study this question of transfer in a meaningful manner, a means to quantify driver behavior in an insight-providing manner is needed, as is a means to match experimental conditions between simulation and reality. The often used time averages and standard deviations of vehicle state variables (e.g. lateral position and speed) and/or driver control variables (e.g. steering wheel angle and pedal depression) are inadequate characterizations of driving behavior because they are too far removed from the perceptual cues that shape driving behavior and the way drivers evaluate driving performance. Drivers are hypothesized to base their control and decision-making on a set of perceptual variables (e.g. splay-rate, bearing-to-tangent-point, time-to-collision, and time-to-tangent-point) and to constrain their behavior such that several time-based safety-margins are satisfied (e.g. time-to-line-crossing, and time-headway). We propose an evaluation of driving behavior based on our perceptually plausible and cognitively feasible driver model and to apply it to assess behavioral difference between driving simulators and reality.
To demonstrate the proposed approach, we conducted an experiment where six drivers drove the same road in reality and in our driving simulator. To assure a close match between experimental conditions on the real road and in the driving simulator, we reconstructed the large Hokkaido proving ground (HPG) test-track in Nissan's 6-DOF moving base driving simulator and adapted the simulator's vehicle model to closely match that of our instrumented test vehicle. The instrumented vehicle recorded driver's perceptual variables and control actions based on a large number of sensors. A balanced experiment was conducted in which the same six subjects drove the proving ground road circuit in reality and in simulation. Each subject drove the track six times in each of the following three conditions (i.e. 18 times total): i) as they normally would, ii) as if in a hurry (to reduce natural variability), and iii) as they normally would while performing various secondary tasks. Here, we report on the second condition only.
Focus, in this paper, is placed on differences in drivers' time-based decision triggers and deceleration control strategies. Two cases are analyzed, namely stopping at a stop line and negotiating a sharp curve (i.e. one that requires deceleration prior to curve entry). Analysis show that even though approach speeds to the stop line and curve as well as the minimum speed reached in the curve match well between simulation and reality, striking differences are observed in terms of decision and control: in both cases the onset of deceleration is delayed in the simulator when approaching a stop-line, in both cases the maximum deceleration rate is higher in the simulator, the deceleration profile is multi-modal instead of single-moded in the approach to a stop line in the simulator, and subjects reach the minimum speed in a curve earlier than in reality. Interestingly, deceleration timing in the driving simulator, assumed to be based on time-to-collision (TTC) estimates, is inconsistent with those expected based on literature findings (i.e. TTC is underestimated
in virtual environments which would predict earlier instead of delayed braking). Furthermore, the interaction between the inherent impoverished perception experienced in driving simulators and the motion profile generated by non-sliding rail motion systems, which are incapable of sustaining forces associated with prolonged deceleration, has a striking effect on people’s braking profile. We observe multi modal braking profiles in our simulator that are uncharacteristic for normal driving behavior in reality. By looking at timing and control strategies rather than average vehicle states, we obtain insight into the potential shortcomings of our driving simulator as well as knowledge about the problems that may arise when using simulators to evaluate systems that interact with driving behavior. Our study contributes a means to evaluate the veridicality of simulators based on a driver-centered model-based approach to quantifying and interpreting driving performance.
Driver Centered Behavior Analysis
Driving simulator validation requires a good understanding of driving behavior. Most important is a good understanding of the input variables that drivers use and how they shape decision and control behavior. Unfortunately, most driver models assume that drivers have access to variables that are mathematically convenient but perceptually implausible [Boer, 1999]. Drivers should be characterized as intermittent satisficing controllers who base their control on perceptual variables rather than continuous optimizing controllers who have access to road design specs [Boer & Hoedemaeker 1998; Boer, Hildreth, & Goodrich, 1998]. By taking such a perceptually plausible and cognitively feasible approach to driver modeling, one automatically arrives at the set of appropriate performance indices that can be used for simulator validation. Gibson and Crooks in 1938 already characterized driving as the process of maintaining a sufficiently large safety margin thereby recognizing that drivers are intermittent satisficing controllers. This characterization has since been quantified by researchers from TNO on time-to-line-crossing (TLC) in lane keeping behavior (e.g. [van Winsum & Godthelp, 1996] and the references therein) as well as our own research at CBR on time-headway and time-to-collision (TTC) in car following (e.g. [Goodrich, Boer, & Inoue, 1999a; Goodrich, Boer, & Inoue, 1999b]). A key component is that perceptual variables trigger mode changes in the driver that are associated with characteristic actions (e.g. perform a corrective lane keeping maneuver when TLC falls outside a certain safety zone or perform a headway corrective maneuver when TTC drops below a certain safety margin). Driving is well characterized by a process of monitoring safety margins and injecting corrections when these margins are violated. These margins are the result of an interaction between multiple driver needs, contextual variables and task constraints (e.g. [Rothengatter, 1988]).
A complete characterization of driving behavior requires knowledge about the perceptual decision triggers to switch modes and the perceptual cues for open loop and feedback control. Decision triggers are related to drivers’ perception of performance in terms of safety, workload, comfort, etc. [Boer & Hoedemaeker, 1998] whereas the control cues are related to the particular control strategy that drivers employ and the associated internal or mental models they maintain (e.g. [Boer 1996]). Simulator validation should be guided by driver models and therefore focus on what is relevant to the driver in terms of performance: i.e. the ability to, for example, satisfy a set of safety, workload, and comfort margins. TTC estimates to obstacles, lane boundaries, curve entry points (e.g. tangent point), stop lines, etc. are relevant for decision making as are perceptual cues such as splay rate, TTC TT&C, and kinesthetic cues that provide predictive information to facilitate smooth and accurate control. In this study, we look at two situations in which drivers initiate a particular action as well as control the vehicle between well defined states, namely stopping at a stop line and negotiating a sharp curve. If the simulator produces any
perceptual biases, altered sensitivities, or a modified perception of performance1, then their effects will be different for the different decisions thresholds and control profiles associated with the two driving sub-tasks and one may be able to assess the origin of the observed differences better than when aggregate performance measures are used. One advantage of dissociating decision-making and control to some degree is that kinesthetic motion simulation has its greatest impact on control whereas effects on decision-making may be attributed primarily to visual cues2.
The proposed human centered approach differs greatly from the majority of simulator validation studies. Most studies only focus on speed and lateral deviation and not on decision triggers or control profiles (e.g. [Blana & Golias, 1999; Toros, Harms, & Alm, 1997]). Research on the perception of decision triggers, particularly time-to-collision or time-to-coincidence, is generally performed outside the context of driving simulator validation and focuses primarily on perception and not on its effect on control (e.g. van der Horst, 1991; Sidaway, Fairweather, Sekiya, & McNitt-Gray, 1996; Cavallo, Laya, & Laurent, 1986). A related body of literature does also focus on control of deceleration to a stop but generally in a lab setting where the effects of task and context are not modeled (e.g. [Tresilian, 1999; Yilmaz & Warren, 1995; Lee, 1994]). In the context of an overwhelming focus on visual perception, it is important to recognize that people’s ability to detect acceleration or deceleration based on visual stimuli alone is at best bad as is their ability to incorporate constant acceleration or deceleration in their estimation of TTC [Regan, Kaufman & Lincoln, 1986]. Kinestetic and vestibular cues play a large role here. The validity of these visual perceptual studies to simulator validation is that they provide insights into expected perceptual biases but the degree to which they interact with interactive task performance in a complex context where other cues are available that facilitate alternative strategies to accomplish a task remains largely uncertain.
Decision and Control Biases in Driving Simulators
Approach to a stop line and approach to a sharp curve both require a decision to initiate deceleration followed by a period during which speed is controlled to a desired value (zero for the stop line and non-zero for the curve). This decision is assumed to be based in part on time-to-collision estimates as well as some contextual variables that may affect perceived safety margins. Ambiguity exists in exact TTC estimate that drivers may use in triggering deceleration during curve approach, but time to tangent point is a plausible candidate. In both situations, drivers try to reach a desired target speed at a particular location or time3. The target speed for curve negotiation is derived from perceptual
1 By performance we mean the complex of interacting driver needs that shape behavior. In Boer &
Hoedemaker [1998] we identify eight fundamental driver needs: expediency, pleasure, kick, workload, economic cost, comfort, social deviance, and risk.
2 High frequency vibrations, which may or may not be part of a motion system, do affect speed perception and may therefore also have an effect on decision-making.
3 Our curve negotiation model (manuscript in preparation with Prof. E.C Hildreth) predicts that drivers reach
variables that are sensitive to curvature and curve length but it is still unclear which perceptual variables drivers use to assess whether a curve requires deceleration and how much (e.g. [Riemersma, 1991]). The degree to which these are accurately perceived will have an impact on speed choice. Note, however, that a mispeception of curve characteristics may be corrected for during the control phase.
In this section, several studies that focus on timing perception, speed perception, and the effect of different motion systems (i.e. no motion, 3-DOF and 4-DOF) on deceleration profiles are discussed.
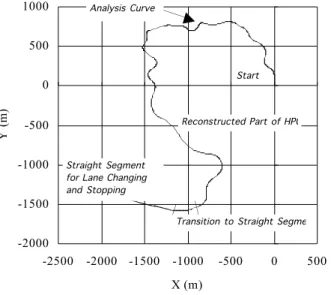
-2000 -1500 -1000 -500 0 500 1000 -2500 -2000 -1500 -1000 -500 0 500 X (m) Y ( m ) Start Reconstructed Part of HPG
Transition to Straight Segment Analysis Curve
Straight Segment for Lane Changing and Stopping
Figure 1. Top view of HPG course that was reproduced in the NRC DS. The final transition to straight and the straight segment are extracted from a different part of the HPG road circuit.
Spatio-temporal Perception in Virtual Environments
A large number of studies explore drivers’ time-to-collision (TTC) estimation. The concensus is that TTC is generally underestimated. This is true for simulator and reality. In the simulator it is primarily attributed to perceptual biases [Sidaway et al., 1996] whereas in reality it may be due to a build-in safety mechanism to always stop short of an obstacle (i.e. ecologically established safetybias) [Groeger & Cavallo, 1991]. Much of the debate surrounding TTC estimation hinges on the difference between direct perception of TTC and one that is computed based on or biased by distance and speed perception [Groeger, Carsten, Blana & Jamson, 1999]. Regardless of the mechanism through which drivers have access to TTC, the vast majority of the studies agree that distance, speed, and TTC are all underestimated in virtual worlds and that the ratio of underestimated distance and underestimated speed still results in an underestimated TTC [Sidaway et al., 1996]. They also review a set of studies that show how TTC estimates are improved by enhanced speed,
less constant during curve entry (i.e. steering increases and speed decrease simultaneously during the final curve entry phase). Note that the maximum steering is generally reached after curve entry.
greater flow, and TTC magnitude itself (better at smaller TTC). The underestimations of distance and TTC predict an earlier deceleration onset in simulators than in reality. In contrast, there is also a body of literature demonstrating that people overestimate distances when viewing displayed or projected images (e.g. [Roscoe, 1984; Roscoe, 1985]). If people overestimate distance and underestimate speed, then one may expect a delayed deceleration onset in simulators because the computed TTC is then overestimated. Finally, speed, distance, and TTC estimates are improved when sound, speedometer, vibrations and other speed cues are modeled more realistically4.
Very few published studies report on the effect of different motion platforms on drivers’ deceleration behavior. One example is Suetomi & Kido [1995] who compare drivers’ deceleration profiles when decelerating to a full stop. Their 4-DOF system (i.e. with linear sliding rail) shows a nearly constant deceleration rate (consistent with what we find in reality). Their 3-DOF system shows a multi modal deceleration profile with a maximum deceleration rate that is higher than that observed in the 4-DOF. Finally, the deceleration gradually increases in their fixed based system. We are currently exploring these differences in more detail by relating them to the time constants of the visual and vestibular system.
3-DOF Driving Simulator Validation Experiment
Matching Realities
The goal in this simulator validation study was to achieve a situation in which the same driver drives the same car on the same track performing the same tasks but in different realities.
Road Design: The goal in the experimental design was to reproduce the lateral and vertical road geometry as well as the sight distances from the Hikkaido proving ground (HPG) in our 6-DOF moving base driving simulator. The curvature profile of the HPG road, its width, its lane markings, its slope, and banking were matched to the blue prints of the HPG. We also modeled the shoulder of the road (i.e. cleared flat area next to the road) as well as the slope of the terrain beyond the shoulder. This resulted in a good correspondence of sight distances in the simulated and real world (compare Figs 2 and 3 of the same curve in reality and in the driving simulator respectively). The top view of the part of the HPG test track used in the experiment is shown in Fig. 1. The straight segment on which lane changes and stopping maneuvers were performed was added to the end of the DS road. It was modeled after the straight segment in the HPG where subjects performed the same maneuvers on a straight segment that they encountered when driving the instrumented vehicle around the track back to the start.
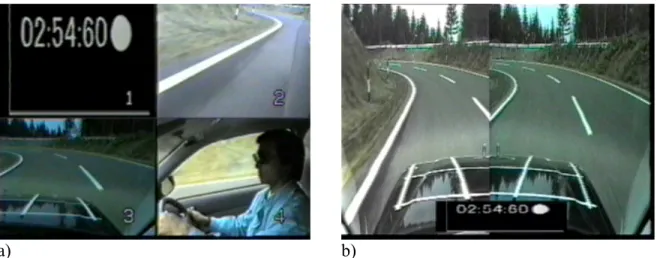
The curve used for the analysis discussed in this paper is marked in Fig. 1. It is a left curve with a radius of 40m and a length of 65m and is referred to as “the curve” in the remainder of the paper. An image of the curve during approach is shown in Figs. 2 and 3.
a) b)
Figure 2. Image arrays from the instrumented experimental vehicle (see text for details). The depicted curve is the one used in the analysis.
Instrumented Vehicle (IV): Fig. 2b shows a view of the stereo cameras mounted on the roof of the instrumented vehicle and Fig. 2a shows, in the lower left corner the right stereo camera image, in the upper right panel the view from the side camera, and in the lower right a view of the driver. The images are currently being processed which explains why we were unable to use measurements obtained from these data in the analysis. The side camera is used to obtain lateral deviation and heading estimates whereas the stereo cameras are used to extract time-to-line crossing, time–to-tangent point, and other perceptual variables such as bearing to tangent point. The vehicle was equipped with a large number of sensors that measured driver controls (e.g. steering and pedals), vehicle state (e.g. speed, accelerations).
Driving Simulator (DS): Three linear and three rotational accelerations are simulated with a hexapod cooperative motor-driven system (non sliding rail). The visual scene is projected onto 3 screens that provide a 120 degree horizontal and 30 degree vertical field of view. The driving experience provided by these systems is further enhanced by a digital sound system that simulates the various sound sources (e.g. engine, wind, tire). A photograph of the system is shown in Fig. 4.
Vehicle Dynamics: To further improve correspondence, the simulator's vehicle model was matched closely to that of our instrumented test vehicle.
Experimental Design
A balanced experiment was conducted in which the same six subjects drove the HPG test track in reality and in simulation. Each subject drove the track six times in each of the following three conditions (i.e. 18 times total): i) as they normally would (maximum about 60kph), ii) as if in a hurry5 (maximum about 80 kph), and iii) as they normally would while
performing various secondary tasks. In this study, we report only on the second condition.
It was necessary to use the same subjects because of the large natural variability between subjects.
In the simulator they performed a set of lane changes at the end of the curved portion (Fig. 1) followed by a full stop at a stop line, then they were required to speed up once more and make a second full stop at the second stop line (i.e. the one used in this study). After coming to a full stop for the second time, they were automatically teleported to the start. In the instrumented vehicle, they simply continued back to the start once reaching the end (i.e. what is the end in the DS) and perform the lane changes and a single stop for a stop line on a long straight segment of the track. The stop line in both simulator and reality was flanked by two clearly visible red cones.
a) b)
Figure 3. Image arrays from the driving simulator (see text for details). The depicted curve is the one used in the analysis.
Data Analysis
In this paper, we explore differences in drivers' control decisions (e.g. whether and when to slow down before a curve, and when to slow down before a stop line), and control strategies (e.g. deceleration profiles and curve negotiation behavior).
Stop-Line Measurements: To characterize stopping at a stop line, the following measurements were made for both realities: time and distance to the stop line as well as the approach speed when the gas pedal depression went zero (foot off gas), time and distance to the stop line when the brake pedal depression went non-zero (i.e. foot on brake), and the maximum rate of deceleration. The point at which the driver begins to release the gas pedal is difficult to estimate because multiple plateaus are often observed between the maximum gas pedal depression and when the foot drops off the gas pedal. These plateaus can sometimes be interpreted to signify the following chronological stages: accelerate to desired speed, maintain desired speed, correct for desired speed, and finally take foot off gas to initiate stopping maneuver. In some cases, the pedal depression changes by a small amount, which may simply be due to repositioning the foot. We expect this to occur at the
end of an acceleration period and when the foot comes off the gas (i.e. flexing the foot as well as repositioning the heel are two approaches to change gas pedal depression, the latter of which causes less strain on the foot and is used to settle into a steady state). To minimize measurement noise, we looked at the foot off gas point.
From these measurements the following decision and control-based variables were computed: i) total maneuver time (from foot off gas to full stop), ii) approach speed when foot off gas, iii) pedal transition time (time between foot off gas to foot on brake pedal), iv) TTC to stop line when foot off gas (i.e. distance divided by speed), v) TTC to stop line when foot on brake pedal, and vi) maximum deceleration rate. These values for all subjects and all trials are shown in Fig. 6 (see below for further details).
Figure 4. Nissan Research Center Moving Base Driving Simulator.
Curve-Negotiation Measurements: To characterize the curve negotiation driving sub-task, the following measurements were made for the simulated and real driving situations: time and distance to curve entry (see below for definition) as well as the approach speed at the point when the foot is taken off the gas pedal, time and distance to curve entry when the brake pedal is pressed, maximum rate of deceleration, the time and distance relative to the start of the curve when the minimum speed is reached, time and distance at which the brake pedal is released again, and the time and distance at which the gas pedal is pressed again. The curve entry reference point is defined as the point where the steering angle goes through zero. This is a reliable reference because the preceding curve is a shallow and rightward thus biasing the steering angle to the opposite direction before curve entry6.
6 Some variability in this null transition is expected due to differences in the degree to which drivers swing
wide before the curve or cut into the curve. From other studies it appears that this introduces at most a 500ms spread, which is similar to the spread in deceleration onset times as is shown in Fig 7. However, if the swing wide and cut in strategies are similar between simulator and reality, then the relative effect still holds. Ideally one would want to use a perceptual cue such as time to tangent point or time to lane crossing point but those will not be available reliably until we have analyzed the video data.
Figure 5. Median profiles of driver controls (steering plus pedals) and vehicle state (speed) during approach to a stop line.
Figure 6. Estimates of timing variables (total maneuver time, TTC when foot off gas pedal, TTC when foot on brake pedal, and pedal transition time) and vehicle state (approach speed, maximum deceleration) during approach to a stop line. See text for further details.
From these measurements the following decision and control-based variables were computed: i) minimum speed, ii) approach speed, iii) pedal transition time (from foot off gas to foot on brake), iv) TTC to the curve entry point when the foot is off the gas pedal, v) TTC when foot on brake pedal, vi) maximum deceleration rate, vii) total time the brake pedal was depressed, and viii) the time and distance into the curve at which the minimum speed is reached. These variables are shown in Fig. 8.
Results and Discussion – Braking to a Full Stop at a Stop Line
Fig. 5 shows median profiles of steering angle, pedal position (positive is gas, negative is brake), and vehicle speed. Each dotted line represents the median of one subject across all six trials. The solid line is the median across all six subjects. The left side shows the profiles against time and the right side the same profile against distance. Pedal depression magnitudes cannot be compared between DS and reality because they represent different quantities, but the shapes of the profiles can be compared.
Fig. 6 shows decision and control variables that characterize a stopping maneuver. Each panel shows a different variable. The left side of a panel shows values for all six subjects from the driving simulator (DS) and the right side form the instrumented vehicle (IV). For each subject, indicated along the x-axis, and represented by a different symbol, six values are shown, one for each trial. In some cases, a horizontal bar is shown through the median of a subject’s values, which is indicative of the fact that the value of this variable is significantly different between DS and IV. For example, the lower left panel shows that subject 1 (squares) exhibited a significantly lower “TTC Gas Off [s]” in the DS than in the IV, suggestive of a later deceleration onset.
Effects: Subjects exhibit a multi modal braking profile in the DS and a more or less constant braking profile in the instrumented vehicle (Fig. 5). In the DS, subjects press the brake, let it come up and then press it again before coming to a full stop (i.e. reaching the stop line to within a satisfactory distance). This is also apparent from the speed profiles, which have a clear correction in their slope (i.e. deceleration rate) that is not seen in reality.
Subjects initiate deceleration much later in the DS or equivalently much closer to the stop line. This is apparent from the fact that TTC when foot off gas and foot on brake are both much shorter in the DS than in reality by more than 50% (Fig. 6). Subjects also reach a much higher deceleration rate in the simulator by almost a factor of two. In reference, subjects do only have a slightly higher approach speed in the DS (by about 20%).
Many more effects can be observed in the figures but we focus only on the ones mentioned.
Conflicts and Consistencies: Subjects decelerate later in the simulator even though one would expect them to initiate deceleration earlier based on the fact that people underestimate TTC in virtual environments. This presumes that TTC is the decision trigger for deceleration7. Given that they do initiate deceleration later, one would expect a greater
deceleration, which is indeed observed. However, the deceleration rate is too high because they would have come to a full stop well before reaching the stop line had they maintained this high rate. In reality, subjects do maintain a constant deceleration rate. In the simulator subjects realize that they are about to stop short of the stop line as indicated by the fact that they decrease the deceleration rate considerably by reducing brake pedal depression.
7 Note that if initiation of braking is based on distance instead of TTC, the inconsistency with the observations
Finally, they depress the brake pedal once more before coming to a full stop. This behavior is highly consistent across all subjects and does not seem to diminish with experience with the driving simulator (subjects 1, 3 and 4 have much experience with driving in driving simulators).
Possible Explanations for the Braking Behavior to a Stop Line in the Driving Simulator
Subjects initiate braking later rather than earlier in the simulator. This counters expectations based on people’s underestimation of TTC in virtual environments. Several reasons for this inconsistency are being explored. The simplest one is that divers cannot perceive the stop line early enough in the driving simulator and are therefore forced to brake later and therefore harder. We are currently establishing the psychonometric function that shows the distances at which people detect the stop line if they expect one. The stop line would have to be visible from about 80m, which may be difficult even though the stop line was accompanied by a red cone on either side of the road (i.e. the same as in reality). If it turns out that people can detect the stop line (plus cones) early enough, then the question remains to what degree TTC does mediate initiation of deceleration and what other factors play a role especially since our results are inconsistent with most of the literature.
In regard to the onset of deceleration, several other hypotheses may be formulated based on the interaction between distance, speed, time-to-collision, and deceleration perception but because of the apparent inconsistencies between observed and predicted behavior based on time-to-collision, we await results from further experiments that take the driving context and its task constraints into account. Naturally, the lack of perceived risk in DS may bias drivers to a more aggressive driving style, which would also support later and harder braking [Summala, 1988]. Such an adaptation in driving style may develop even if people could judge the perceptual cues the same as in the real world. They may adopt different safety and comfort margins because they really don't experience the same consequences from skids, crashes or high acceleration or jerk. One possibility is that they artificially increase the perceived risk or potential to lose control to that experienced in the real world by adopting a more aggressive driving style. Alternatively, drivers may place greater emphasis on expediency or "kick of driving" in a simulator where you can get charged up by pushing yourself to the limits in a context where there is really no risk of harm (see [Rothengatter, 1988; Boer & Hoedemaeker, 1998] for a motivational approach to driver modeling).
The next question is why people brake too hard in a DS. The answer may shed light on the fundamental question whether a 6-DOF motion system without a sliding rail is capable of eliciting realistic braking profiles. We are currently exploring the interaction between the visual and vestibular systems in terms of their respective time constants as well as the time-constants associated with the visual induction of vection (e.g. [Wertheim, Wagenaar, & Leibowitz, 1982])8.
8 The profile of the motion signals is currently being explored and used to assess when the motion signal
Our current hypothesis about the perceptual processes that mediate braking in a 6-DOF driving simulator is as follows. The initial deceleration perception is similar to reality because the moving base is capable of reproducing the initial transient motion signals incurred immediately upon pressing the brake pedal. Because of the inherent constraints in any non-sliding-rail moving base, the deceleration cannot be sustained and the motion signal gracefully dies out through the use of wash-out filters. This causes the vestibular system to loose its input after some time (possibly delayed because of vestibular inertia). Drivers may unconsciously try to equalize the decreasing vestibular motion signal, because they expect it to be sustained longer, by braking harder, which may have little effect in terms of providing kinesthetic or vestibular cues because the motion system is already fully extended. This does however put them on a course that will stop them short of the target line.
The final question is how people judge that they will come to a full stop short of the stop line if they maintain the current deceleration rate. Unfortunately, very little research has been conducted on this topic. Focus is generally placed on TTC estimates based on constant approach speed or on the process of controlled braking using tau (rate of change in TTC). However, the degree to which people rely on tau remains controversial (e.g. [Tresilian, 1999]). Given that drivers often show a gradually increasing deceleration rate in fixed-base driving simulators (e.g. [Suetomi and Kido, 1995]), suggests perceptual biases in people’s estimate of stopping point. Given the lack of studies that focus on people’s ability to estimate where they will come to a full stop, we only remark that the data we have suggests that drivers underestimate the stopping point because otherwise it would be difficult to explain why people gradually increase their deceleration rate in approaching a target. The fact that Suetomi and Kido show normal braking profiles in their 4-DOF DS, in which the longitudinal deceleration signal does not wash out, suggests that the interaction with visual perception does not contribute to the multi-modal nature of the deceleration profile in a 3-DOF moving base DS9. The multi-modal braking profile in a non-sliding DS, we expect to be due to the fact that kinesthetic and vestibular lose strength and that drivers compensate for that by pressing the brake harder. Following this initial deceleration phase, drivers have to rely again primarily on their biased visual perception which shapes the latter part of the deceleration profile. The underlying message is that controlled braking to a target needs much more research before we can be conclusive about the perceptual cues that guide drivers in their stopping maneuvers.
second issue that is being explored is the time constant of the vestibular system to longitudinal deceleration. It is known that the vestibular system saturates but its interaction with the 3DOF moving base motion signals is uncertain and is currently being explored in detail.
9 The fact that braking profiles are so very different between reality and simulation further supports that
control of braking is not purely visual and that the tau-dot hypothesis may not hold across different contexts [Tresilian, 1999].
Figure 7. Median profiles of driver controls (steering plus pedals) and vehicle state (speed) during negotiation of a sharp left curve (Radius=40m, Length=65m).
Results and Discussion – Deceleration Before a Sharp Curve:
Figs. 7 and 8 are organized as Figs. 5 and 6 for the stopping task except that Fig. 8 shows two more variables.
Effects: Unlike in the stopping maneuver, subjects initiate deceleration in the simulator at about the same time before the curve as in reality. In fact the difference in TTC estimates between simulator and reality is not significant for three of the subjects. Interestingly, a
significant but only slightly delayed deceleration onset is observed for those subjects who have much experience in driving the simulator (i.e. subjects. 1,3, and 4) 10.
As in the stopping maneuver, all subjects reach a significantly higher deceleration rate in the simulator. However, whereas subjects show a correction to this large deceleration in the stopping maneuver by relaxing the brake pedal, this compensation is not observed in the curve approach. Subjects exhibit a uni-modal brake pedal depression profile. In the simulator, subjects brake for a much shorter period of time than in the real world and reach their minimum speed much earlier. In reality they reach it several seconds after curve entry at about the time where the steering angle reaches its maximum. The approach and minimum speed are very similar in both realities and show no consistent bias across all subjects. In both realities, subjects start to accelerate immediately after reaching their minimum speed, which means well before exiting the curve. Consequently, they reach much higher curve exit speeds in the simulator because they start their acceleration earlier. These higher curve exit speeds in the simulator seem to be accompanied by a greater steering variability but this has not been established quantitatively yet.
Possible Explanations for Speed Control during Curve Negotiation in Simulation.
The fact that onset timing of deceleration matches well between simulation and reality is attributed to the fact that subjects initiate deceleration closer to a curve than to a stop line because the total desired speed difference is much less that for a complete stop. One explanation for the lack of or the small bias in onset time is explained by the fact that TTC estimates improve when TTC decreases [Sidaway et al., 1996]. In addition, a curve provides a richer optic array of flow elements that a simple stop line, thus further improving TTC estimation. The fact that subjects simply tolerate the fact that they reach their minimum speed too early (assuming they notice it) is reasonable because it reduces the visual demand associated with curve entry because they enter it at a lower speed. In simulation, we see that people drive much faster through the latter part of the curve than in reality even though the minimum speed in both realities is very similar. Since they reach their minimum speed earlier, but initiate acceleration immediately after reaching it and do so at a rate greater than observed in reality, the curve exit speeds are considerably higher in the driving simulator. From Fig. 7 it is also apparent that the variability in drivers’ steering is greater during the later part of the curve in the driving simulator than in reality for which some explanations are given below.
The Dynamics of Driving Faster
On grounds of perceived optic flow, it is well understood that subjects drive faster or underestimate speed in most simulators, in fog, and in the dark. Besides the optic flow argument, other factors are also hypothesized to play a role in speed choice. Some possible candidates are discussed next. Kinestetic cues are hypothesized to play a critical role in
10 It remains to be explored whether these simulator-experienced drivers have adopted a different control
strategy that may have biased the adopted curve onset reference (i.e. where the steering angle goes through zero) and therefore the timing estimates.
assessing the edge of performance. By this we mean that drivers use perceptual cues to assess whether they can handle possible disturbances such as wind gusts or disturbances in the road surface. A good controllability indicator to the driver is the sensitivity of the vehicle state to steering input. If a small change in steering causes a fast change in vehicle state, which is most easily detected by the vestibular system and kinesthetic proprioceptive receptors because their time-constants are considerably shorter than those of the visual system, then the associated bandwidth may be too high for the driver to respond to accurately. Because of the lack of high frequency kinesthetic cues in most simulators, drivers have to rely on visual perception. Visual perception is less sensitive to the effects of steering (self induced) and external disturbances than the vestibular and kinesthetic system. For drivers to experience the same controllability, they need to drive faster. This assumes that drivers have some constant safety margin against which they push and controllability is hypothesized to be one component in this assessment. This means that any external disturbance that requires a steering correction may not be controllable to a satisfactory degree if they drive too fast in a simulator. By slowing down, the driver effectively decreases the input bandwidth and thereby controllability of disturbances. Given that these high frequent vestibular cues are not present, because of the limited bandwidth of most motion base systems, drivers do not have access to this perceptual cue. As a consequence, greater variability may be observed because drivers cannot perceive the disturbances as accurately and timely as in reality.
In most driving simulators the external disturbances on the vehicle state are not modeled accurately thus giving people more control over the vehicle than they would have in the real world. Both aspects, lack of high frequent vestibular cues and lack of properly modeled disturbances may enable people to drive faster and still give them the same sense of controllability. This may also explain why many people do crash more often in simulators than in the real world. In the driving simulator, drivers do introduce disturbances them selves which may lie beyond the controllable bandwidth. The same reasoning holds for drivers’ ability to control a skid or more important detect the chance of skidding early enough to avoid it. This ability also relies on high frequent vestibular cues thus explaining why it is sometimes very difficult for people to control a vehicle at high speed when the vehicle model does include a skid model. We found that this is particularly true in a fixed based DS and that people often do not even understand the reason for their loss of control because they are not gradually being made aware of the loss of control when the predictive kinesthetic and vestibular cues are lacking.
Even though these controllability effects may be small compared to the ones caused by impoverished optic flow, they do become important in studies where drivers are required to manage their attention between the driving task and other task such as interacting with a navigation system. To assure proper transfer to reality, drivers need to have a realistic sense of their controllability and be able to accurately estimate for how long they can safely take their eyes off the road. Both require accurate modeling of disturbances and the cues that drivers use to perceive and control them.
Figure 8. Estimates of timing variables (TTC when foot off gas pedal, TTC when foot on brake pedal, pedal transition time, duration of foot on brake pedal, time into curve when minimum speed is reached) and vehicle state (approach speed, maximum deceleration, and minimum speed) during negotiation of a sharp left curve (Radius=40m, Length=65m). See text for further details.
Conclusions
It is well known that people drive faster in simulators, that timing estimates are off in virtual worlds is well documented, and that risk perception is different in simulators is well understood. It is also generally accepted that simulators offer a good tool for studying
relative effects on driving behavior but that their absolute validity is at best questionable. Studies that report a good absolute match between reality and simulation generally use a very limited set of behavioral signatures (e.g. speed and lateral deviation) and calculate them by averaging across many driving subtasks (e.g. corrective lane keeping maneuvers, negotiation of sharp curves, stopping, etc) or across the various stages of a driving subtask (e.g. curve approach, steady state curve negotiation, and curve exit). Even though the matching of these aggregate signatures between reality and simulation is a necessary condition for absolute transfer, it does not offer a sufficient proof of behavioral transfer because identical averages and standard deviations can be obtained in multiple ways. Furthermore, when simulation and reality do not match on these aggregate quantities, it becomes difficult to determine the cause.
In this paper, we highlight a few perceptual cues and behavioral signatures associated with the various stages in particular driving subtasks. We demonstrate that they offer constructive insight into the effects of the inherently impoverished displays of simulators and their compromised motion simulation on drivers’ decision-making, control strategies, and performance evaluation. By studying transients in behavior rather than gross averages, focus is placed on perceptual and control signals that shape driver behavior rather than statistics of the vehicle state, which is the end product of driving performance11. Since driving simulators simulate the perceptual array, it makes sense to compare directly how drivers use perceptual cues in simulators and reality.
Results of deceleration behavior to a stop line as well as speed control profiles during curve negotiation are shown for well-matched conditions between simulator and reality. In both cases, we find that subjects initiate braking later and brake much harder in the DS. This is observed most severely in the approach to a stop line where it results in a multi-modal deceleration profile to guarantee a timely final stop at the stop line. In decelerating before a curve, subjects simply reach minimum speed earlier (sometimes before curve entry) than observed in reality (always well into the curve). We attribute differences in the timing of control actions to biases in time-to-collision, speed, and distance perception as well as to modified safety margins. Differences in control strategies are attributed to the compromised kinesthetic and vestibular cues with 3-DOF motion platforms that are normally used for feedback control (i.e. they adopt a more visually dominated strategy) and controllability assessment. Small differences in control set points (e.g. the speed) are also attributed to perceptual biases (vibrations, sound, optic flow) and modified safety margins. It is our experience that the proposed driver-centered approach to quantifying and interpreting performance in particular driving subtasks offers informative and constructive insights into the shortcomings of driving simulators because it focuses explicitly on variables associated with the various stages in a driving sub-task that shape driving performance.
11 For example, instead of focusing on lateral deviation it is much more informative to look at the
time-to-line-crossing profile which provides information about perceived safety (i.e. minimum TLC), the frequency of control actions (effect of disturbance), etc.
References
E. Blana & J. Golias, “Behavioral Validation of a Fixed-Base Driving Simulator”, In Proceedings of the
Driving Simulator Conference (DSC’99), INRETS, RENAULT (organizing institutions), Paris, France, July
7-8, pp. 227-240, 1999.
E.R. Boer, "Tangent Point Oriented Curve Negotiation", Proceedings of the 1996 IEEE Intelligent Vehicles
Symposium, pp. 7-12, Seikei University, Tokyo, Japan, September 19-20, 1996.
E.R. Boer, "Car Following from the Driver's Perspective." Transportation Research, Part F: Traffic
Psychology and Behavior, Vol. 2, pp. 201-206, 1999.
E.R. Boer and M. Hoedemaeker, "Modeling driver behavior with different degrees of automation: A hierarchical decision framework of interacting mental models. " In Proceedings of the XVIIth European
Annual Conference on Human Decision making and Manual Control, Valenciennes, France, Dec. 14-16,
1998.
E.R. Boer, E.C. Hildreth, and M.A. Goodrich "A driver model of attention management and task scheduling: Satisficing decision making with dynamic mental models", In Proceedings of the XVIIth European Annual
Conference on Human Decision making and Manual Control, Valenciennes, France, Dec. 14-16, 1998.
V. Cavalo, O. Laya, & M. Laurent, “The Estimation of Time-To-Collision as a Function of Visual Simulation”, Vision in Vehicles, A.G. Gale et.al. (Eds.), Elsevier Science Publishers B.V. (North-Holland), pp. 179-183, 1986.
J.J. Gibson & L.E. Crooks. “A Theoretical Field-Analysis of Automobile Driving”, The American Journal of
Psychology, Vol. LI, No. 3, pp. 453-471, July, 1938.
M.A. Goodrich, E.R. Boer and H. Inoue, “A Model of Human Brake Initiation Behavior with Implications for ACC Design.” In Proceedings of International Conference on Intelligent Transportation Systems (ITSC99),
Tokyo, October 5-8, 1999.
M.A. Goodrich, E.R. Boer and H. Inoue, “A Characterization of Dynamic Human Braking Behavior with Implications for ACC Design. “ In Proceedings of International Conference on Intelligent Transportation
Systems (ITSC99), Tokyo, October 5-8, 1999.
J.A. Groeger, O.M.J. Carsten, E. Blana, & H. Jamson, “Speed and Distance Estimation under Simulated Conditions”, Vision in Vehicles VII, A.G. Gale et.al. (Eds.), Elsevier Science Publishers B.V. (North-Holland), pp. 291-299, 1999.
J.A. Groeger and V. Cavallo, “Judgements of Time-To Collision and Time-To-Coincidence”, Vision in
Vehicles III, A.G. Gale et.al. (Eds.), Elsevier Science Publishers B.V. (North-Holland), pp. 27-34, 1991.
R. van der Horst, “Time-to-Collision as a Cue for Decision-Making in Braking”, Vision in Vehicles III, A.G. Gale et.al. (Eds.), Elsevier Science Publishers B.V. (North-Holland), pp. 19-26, 1991.
D.N. Lee, “An Eye or Ear for Flying”, Chapter 13 in Perception and Motor Control in Birds, M.N.O, Davies & P.R. Green (Eds.), Springer-Verlag, Berlin, pp. 270-291, 1994.
D.M. Regan, L. Kaufman, J. Lincoln, “Motion in Depth and Visual Acceleration”, Chapter 19 in Handbook of
Perception and Human Performance, Vol. 1, Sensory Processes and Perception, K.R. Boft, L. Kaufman &
J.P. Thomas (Eds.), John Wiley & Sons, Inc. New York, 1986.
J.B.J. Riemersma, erception of Curve Characteristics,” Vision in Vehicles III, A.G. Gale et.al. (Eds.), Elsevier Science Publishers B.V. (North-Holland), pp. 163-170, 1991.
S.N. Roscoe, “Judgements of Size and Distance with Imaging Displays”, Human Factors, Vol. 26, No. 6, pp. 617-629, 1984.
S.N. Roscoe, “Bigness is in the Eye of the Beholder”, Human Factors, Vol. 27, No. 6, pp. 615-636, 1985. T. Rothengatter, “Risk and the Absence of Pleasure: A Motivational Approac to Modeling Road User Behaviour,” Ergonomics, Vol. 31, No. 4, pp. 599-607, 1988.
B. Sidaway, M. Fairweather, H. Sekiya and J. McNitt-Gray, “Time-to-Collision” Estimation in a Simulated Driving Task”, Human Factors, Vol. 38, No. 1, pp. 101-113, 1996.
T. Suetomi and K. Kido, “The Effect of Motion Feedback on the Validity of Driver’s Emergent Behavior in a Driving Simulator”, JSAE, Fall Convention, # 9539455, 1995.
H. Summala, “Risk Control is not Risk Adjustment: The Zero-Risk Theory of Driver Behavior and its Implications,” Ergonomics, Vol. 31, No. 4, pp. 491-506, 1988.
J. Toros, L. Harms, and H. Alm, he VTI Driving Simulator – Validation Studies”, Proceedings of the Driving
Simulator Conference(DSC 97), Lyon, France, Sep 8-9, 1997.
J.R. Tresilian, “Visually Time Action: Time-Out for ‘Tau’?, Trends in Cognitive Sciences, Vol. 3, No. 8, pp. 301-310, August, 1999
A.H. Wertheim, W.A. Wagenaar, & H.W. Leibowitz (Eds.), Tutorials on Motion Perception, Plenum Press, New York, 1982.
W. van Winsum and H. Godthelp, “Speed Choice and Steering Behavior in Curve Driving.” Human Factors, Vol. 38, 1996, No. 3, pp. 434-441.
E.H. Yilmaz & W.H. Warren, “Visual Control of Braking: A Test of the !& Hypothesis”, Journal of