Technical Report
Number 914
Computer Laboratory
UCAM-CL-TR-914 ISSN 1476-2986Characterizing the impact
of network latency on
cloud-based applications’ performance
Diana Andreea Popescu, Noa Zilberman,
Andrew W. Moore
November 2017
15 JJ Thomson Avenue Cambridge CB3 0FD United Kingdom phone +44 1223 763500 http://www.cl.cam.ac.uk/c
2017 Diana Andreea Popescu, Noa Zilberman, Andrew W. Moore
This version of the report incorporates minor changes to the November 2017 original, which were released December 2017.
Technical reports published by the University of Cambridge Computer Laboratory are freely available via the Internet:
http://www.cl.cam.ac.uk/techreports/ ISSN 1476-2986
Characterizing the impact of network latency on
cloud-based applications’ performance
Diana Andreea Popescu
Noa Zilberman
Andrew W. Moore
University of Cambridge
[email protected]
Abstract
Businesses and individuals run increasing numbers of applications in the cloud. The performance of an application running in the cloud depends on the data center conditions and upon the resources committed to an application. Small network delays may lead to a significant performance degradation, which affects both the user’s cost and the service provider’s resource usage, power consumption and data center efficiency. In this work, we quantify the effect of network latency on several typical cloud workloads, varying in complexity and use cases. Our results show that different applications are affected by network latency to differing amounts. These insights into the effect of network latency on different applications have ramifications for workload placement and physical host sharing when trying to reach performance targets.
1
Introduction
Cloud computing has revolutionized the way businesses use computing infrastructure. In-stead of building their own data centers, companies rent computing resources available from providers like Google Cloud Platform, Amazon EC2, and Microsoft Azure, and de-ploy their applications in the cloud. While customers are able to choose the specifications of the used computing instances according to their needs, specifying guarantees in terms of network latency for an application is not yet fully possible.
The fact that latency impacts performance is well known for wide area networks (WAN) [29, 43, 41, 32, 11], for example as it is implicitly a part of rate computations for TCP, but also for host applications. The latency studied in these works was in the order of milliseconds to hundreds of milliseconds. However, today much of the commu-nication is within data centers, meaning that the latency is far below the WAN scale. Several studies [45, 8, 48, 34] have shown that network latency variability is common in multi-tenant data centers. There is a need to quantify the impact of network latency on an application’s performance as even small amounts of delay, in the order of tens of microseconds, may lead to significant drops in application performance [53]. While past work has provided comprehensive performance studies of the effect of CPU cache and memory, the operating system or virtualization upon application performance (e.g. [50, 31, 47, 45]), a significant gap exists in evaluating the impact of networking resources, particularly network latency and network latency variation.
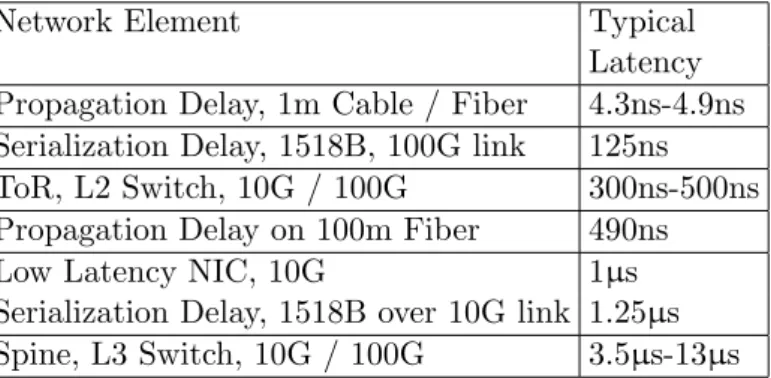
Network Element Typical Latency Propagation Delay, 1m Cable / Fiber 4.3ns-4.9ns Serialization Delay, 1518B, 100G link 125ns ToR, L2 Switch, 10G / 100G 300ns-500ns Propagation Delay on 100m Fiber 490ns
Low Latency NIC, 10G 1µs
Serialization Delay, 1518B over 10G link 1.25µs
Spine, L3 Switch, 10G / 100G 3.5µs-13µs
Table 1: Latency of Different Network Elements - Typical Examples
In this paper, we study the impact of network latency upon application performance for a set of cloud applications, ranging from a domain name server (DNS) to machine learning workloads running on Spark. We select the workloads so they represent an increasing scale of complexity, and do not target the same frameworks. Our work is both measurement and implementation driven, and is based on an extensive exploration of latency characteristics.
We describe an experimental methodology developed to evaluate the relationship be-tween application performance and network latency. We do this by artificially injecting arbitrary network latency into a networked system. We use a bespoke hardware appliance, NRG , we specifically designed for this purpose that affords us fidelity of per-packet latency control and a precision on the order of tens of nanoseconds. Our methodology enables testing different latency magnitudes, as well as different variance magnitudes and distri-butions. In this manner, the injected latency may represent delay due to an increased cabling length (increased propagation delay), delay caused by end-host behaviours, or queueing within switches due to network congestion.
In order to know how we should represent latency in the system, we conduct network latency measurements for multiple cloud-operators across different data centers around the world. These measurements are used to inform the magnitude of latency and its variance in our experiments. In our experiments, we use both synthetic and real workloads for our chosen applications.
The principal contributions of this paper are:
• a description of an experimental methodology to measure application performance
under arbitrary network latency,
• an extensive measurement study of how the performance of a number of cloud-based
applications will change under arbitrary magnitude of network latency
The rest of the paper is organized as follows. In Section 2, we present the results of network latency measurements performed across six data centers from three different cloud operators. Section 3 outlines the cloud-based applications we study in this paper, while Section 4 describes our experimental setup. Section 5 presents the results of experiments of how network latency impacts application performance. Section 6 discusses the lessons learned from our study. We give an overview of related work in Section 7, with conclusions and future work in Section 8.
2
Network Latencies in Data Centers
If in the past it was common to think about latency on the scale of milliseconds, today network elements within the data center are several orders of magnitude faster than that.
In Table 1 we present some examples of the latency of different network elements. If in the past it took 640ns to transmit just 64B using 1GE technology, today it is possible to transmit five 1518B packets at the same time. Sub-microsecond, high port count, top of rack (ToR) switches are common and there is little difference in latency between different 10GE and 100GE from the same manufacturing generation. This does not preclude higher latency network elements, in the order of microseconds, from being part of the network, depending on their role (e.g. as a Layer 3 Spine switch/router). What becomes interesting is that the latency within a switch is now at the same magnitude as the latency of traversing 100m one way within the data center over fiber. All the above means that the architecture and topology of the network within the data center, the dominant factor of network latency, can significantly vary between cloud operators and expose users to different magnitudes of data center latency and variation.
To understand the scale and distribution of latency as experienced by a user in a data center, we measure the round-trip time (RTT) between multiple virtual machines (VMs) rented from different cloud operators. Our aim is to calibrate our latency exploration based upon current data center measurements and further use these values as inputs to our controlled latency environment. This permits us to evaluate the performance of an application as it is subject to varying latency values. While this is not a comprehensive study of latency within data centers, it represents several latency scenarios that might be experienced by a specific user. This work was performed without any specialist support (or intervention) by the cloud hosting companies. Any errors or faults arising from user-misconfiguration or misunderstanding are our own.
For each of three cloud operators, we chose one data center from US and one from Europe, and we rented 4 VMs in each data center1
. The VM’s type is the default type rec-ommended by each cloud operator, running Ubuntu 16.04. Since the VMs’ performance may be affected by other collocated VMs and the network traffic within the data centers may be different due to diurnal and weekly patterns, we ran measurements over several days, totalling 100 million RTT measurements between each VM pair. Information re-garding the hop count between our VMs is not available, and traceroute does not reveal any useful information, however, this does not affect our later experiments.
One of the VMs, operating as a client, measures the RTT to the three other VMs (operating as servers). The client VM sends a UDP packet to the first server VM and waits for a reply from it, measuring the time between the sending of the packet and the receipt of the reply. In one round, the client makes 100,000 such measurements. Once a round finishes, the client VM waits 10 seconds before moving to the next server VM, and so on. The measurements are performed sequentially in a round robin fashion. Taking into account the time of each measurements round, the latency of each VM-pair is measured approximately once a minute, for a thousand consecutive minutes.
The UDP latency measurement methodology and source code are based on the tool utilized in [53]; it is intended for accurate low latency measurement, and sends a single measurement probe at a time (rather than a train of packets). As a result, the latency measurements only observe the state of the network and do not congest it. The latency measurements use the CPU’s Time Stamp Counter (TSC). TSC is a 64-bit register present on recent Intel ix86 processor. It counts the number of cycles since reset and provides a useful resolution of approximately 288ps-per-cycle with tens of cycles resolution (due to CPU pipeline effects). Access to TSC is done using the rdtsc ix86 assembly instruction. The RTT is measured on the client VM by computing the difference between two rdtsc reads: one just before the request is sent, and one as it is received. Using the rdtsc instruction results in an error within VMs running on cloud operator C, so we use the
1
0 100 200 300 400 500 600 700 Round-Trip Time[µs] 0.0 0.2 0.4 0.6 0.8 1.0 C D F VM-Pair1 VM-Pair2 VM-Pair3 VM-All (a) Provider A US 0 100 200 300 400 500 600 700 Round-Trip Time[µs] 0.0 0.2 0.4 0.6 0.8 1.0 C D F VM-Pair1 VM-Pair2 VM-Pair3 VM-All (b) Provider B US 0 100 200 300 400 500 600 700 Round-Trip Time[µs] 0.0 0.2 0.4 0.6 0.8 1.0 C D F VM-Pair1 VM-Pair2 VM-Pair3 VM-All (c) Provider C US 0 100 200 300 400 500 600 700 Round-Trip Time[µs] 0.0 0.2 0.4 0.6 0.8 1.0 C D F VM-Pair1 VM-Pair2 VM-Pair3 VM-All (d) Provider A Europe 0 100 200 300 400 500 600 700 Round-Trip Time[µs] 0.0 0.2 0.4 0.6 0.8 1.0 C D F VM-Pair1 VM-Pair2 VM-Pair3 VM-All
(e) Provider B Europe
0 100 200 300 400 500 600 700 Round-Trip Time[µs] 0.0 0.2 0.4 0.6 0.8 1.0 C D F VM-Pair1 VM-Pair2 VM-Pair3 VM-All (f) Provider C Europe Figure 1: Measured RTTs within data centers for cloud operators A, B and C in December 2016.
less precise clock gettime function with CLOCK MONOTONIC instead.
The RTT CDFs for cloud operators A (Amazon), B (Google) and C (Microsoft) are presented in Figure 1. We also present in each CDF an aggregate plot using all the RTTs measured by a single VM to the three other VMs within the same data center. We observe that there are differences between cloud operators, but on the other hand, the measured latencies within data centers of the same cloud operator share the same characteristics.
We further explore the periodicity within a data center on the minimum, median and 99th
percentile, per VM-pair, and find no interesting effects over time (Figure 2). Provider B maintains consistent latency in all our measurements, while other providers have noisier results (order of tens of microseconds), but on a round-to-round basis rather than for longer periodic patterns. We notice only one outlier, for the 99th
percentile of operator C.
We ran our measurements between 10 and 13 December 2016, and then repeated them between 8 and 10 May 2017 (Figure 3). While we observe changes between our two measurements campaigns, the ranges of medians are similar, with one exception only (Provider A US data center).
3
Selected Cloud-based Applications
We choose four popular applications whose performance can be analysed in our network-latency study setup (see Section 4). The choice of applications is intended to explore an increasing level of application’s complexity as well as different distributed operating models. The choice of applications is not intended to represent all common data center applications, and we overtly prefer applications that are likely to be network intensive.
(a) Provider A US (b) Provider B US (c) Provider C US
(d) Provider A Europe (e) Provider B Europe (f) Provider C Europe Figure 2: Measured RTTs percentiles per VM pair within data centers for cloud operators A, B and C for each iteration round.
0 100 200 300 400 500 600 700 Round-Trip Time[µs] 0.0 0.2 0.4 0.6 0.8 1.0 C D F VM-Pair1 VM-Pair2 VM-Pair3 VM-All (a) Provider A US 0 100 200 300 400 500 600 700 Round-Trip Time[µs] 0.0 0.2 0.4 0.6 0.8 1.0 C D F VM-Pair1 VM-Pair2 VM-Pair3 VM-All (b) Provider B US 0 100 200 300 400 500 600 700 Round-Trip Time[µs] 0.0 0.2 0.4 0.6 0.8 1.0 C D F VM-Pair1 VM-Pair2 VM-Pair3 VM-All (c) Provider C US 0 100 200 300 400 500 600 700 Round-Trip Time[µs] 0.0 0.2 0.4 0.6 0.8 1.0 C D F VM-Pair1 VM-Pair2 VM-Pair3 VM-All (d) Provider A Europe 0 100 200 300 400 500 600 700 Round-Trip Time[µs] 0.0 0.2 0.4 0.6 0.8 1.0 C D F VM-Pair1 VM-Pair2 VM-Pair3 VM-All
(e) Provider B Europe
0 100 200 300 400 500 600 700 Round-Trip Time[µs] 0.0 0.2 0.4 0.6 0.8 1.0 C D F VM-Pair1 VM-Pair2 VM-Pair3 VM-All (f) Provider C Europe Figure 3: Measured RTTs within data centers for cloud operators A, B and C in May 2017.
3.1
Domain Name System (DNS)
This is the most simple application studied, which is widely used in the cloud. It provides a domain name lookup service. As a server, we use NSD (Name Server Daemon)2
, which is an open source name server, authoritative only. DNSPerf3
(version 2.1.0.0) is used on the client side to generate requests. We define as our application performance metric as the number of requests per second that the name server can achieve. DNS follows a client-server model, and we focus on the server side and the effect that network latency as observed by the server has on its overall performance.
3.2
Key-value Store: Memcached
Memcached4
is a popular, in-memory, key-value store for arbitrary data. In our experi-ments we use on the server side, the open-source version of memcached 1.4.25.
We use the Mutilate5
memcached load generator to evaluate the impact of network latency on memcached’s application performance, measured in queries per second (QPS). The workload generator is based on a closed system model [39]; that is, each workload-generator waits for a reply before sending the next request. We use two workloads gener-ated by the mutilate benchmark: i) a read-only workload, the requests follow an exponen-tial distribution; the key size is 30 byte and the value size is 200 bytes; following [27], the keys are accessed uniformly; ii) the Facebook “ETC” workload, taken from [6], is consid-ered representative of general-purpose key-value stores. The results for the two workloads are similar, and we omit for brevity the results for the read-only workload.
Memcached follows a client-server model, and we focus on the server side and the effect that network latency as observed by the server has on its overall performance.
3.3
Machine Learning Applications
Machine learning (ML) applications have become very popular in recent years, represent-ing a common workload for data centers. Due to the huge amount of data that has to be processed, the ML applications are distributed, using either a data parallel approach (the input data is partitioned across the machines and the ML model is shared) or a model parallel approach (the ML model is partitioned across the machines and the input data is shared). In the data parallel approach, each machine can read and update all model parameters, while in the model parallel approach, each machine can access and update only its model parameter partition.
3.3.1 Distributed Machine Learning: Lasso Regression
We use the STRADS [26]6
distributed framework for machine learning algorithms. The framework is targeted for moderate cluster sizes (between 1 and 100 machines).
We evaluate the impact of network latency on the sparse Lasso (least absolute shrink-age and selection operator) regression [44] application implemented in this framework. The network communication pattern can be represented as a star in the case of the Lasso regression application, with a central coordinator and scheduler on the master server, while workers communicate only with this master server. The STRADS framework uses
2 https://www.nlnetlabs.nl/projects/nsd/ 3 https://nominum.com/measurement-tools/ 4 http://memcached.org 5 https://github.com/leverich/mutilate 6 https://github.com/petuum/strads.git
one coordinator, one scheduler and requires at least two workers. In our setup, the coor-dinator and the scheduler run on the master server (in Figure 4).
We define as application performance metric the objective function value versus time (seconds), also referred-to as convergence time[26]. The input to the application is repre-sented by aN-by-M matrix and aN-by-1 observation vector, while the model parameters are represented by a M-by-1 coefficient vector. In common with papers describing the algorithm [26], we use a synthetic workload that we generated, with a number of 10K samples and 100K features, and a total of 500M non-zero values in the matrix, the data size is 9.5GB.
3.3.2 Distributed Machine Learning: Generalized Linear Regression
We use Spark [1]’s machine learning library (MLlib), on top of which we run benchmarks from Spark-Perf7
. We run Spark 1.6.3 in standalone mode. We experiment with different numbers of examples (100K, 1M) and iterations (20, 100), however we notice a similar behaviour. Spark follows a master-worker model. Spark supports broadcast and shuffle, which means that the workers do not communicate only with the master, but also between themselves. We define as application performance the training time, e.g. the time taken to train a model.
3.4
Other applications
On top of the four applications described above, we also explored the effect of latency on the performance of other applications, which are omitted from this paper. In previous work [53] we studied the effect of static latency on Apache Benchmark8
for a single client-server pair. However, for this use case, Apache easily saturates the link, making network bandwidth the bottleneck of the system studied. Under this scenario, even two clients are competing for network resources, thus the study of latency effect is tainted by other network effects. We also studied the effect of latency on TPC-C MySQL benchmark9
, reporting New-Order transactions per minute (where New-Order is one of the database’s tables). TPC-C latency sensitivity heavily depends on its warm-up period, which hinders the methodological reliability of repeated tests. On top of the above, we also explored a set of applications under the Spark platform, including e.g. KMeans, Gaussian Mixture Models. We omit those for brevity, as they behave similarly to other applications using the same platform.
4
Experimental Setup
While characterising the performance of network latency in the cloud is ideally done within a large-scale and controlled data center, such access is granted today only to the single few who work at the world’s leading data centers. Other may use the data center, but have no control over it or full visibility into it. Instead, we propose a methodology that enables characterising the effect of network latency on applications performance using a much smaller scale, well controlled environment. Our ability to control and flexibly change latency within this environment provides a new venue for studying network characteristics in academic environments. 7 https://github.com/databricks/spark-perf 8 https://httpd.apache.org/docs/2.4/programs/ab.html 9 https://github.com/Percona-Lab/tpcc-mysql
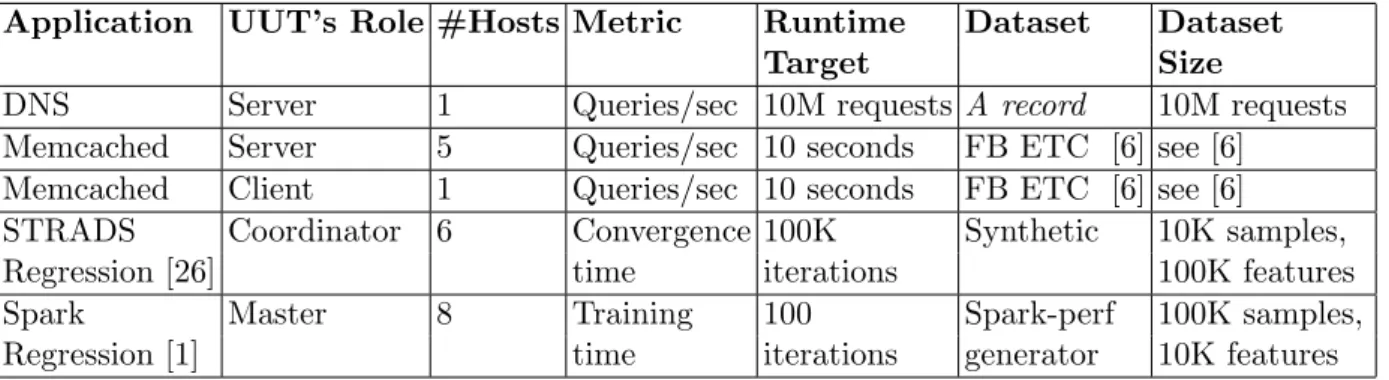
Table 2: Workloads Setup. #Hosts indicates the minimum number of hosts required to saturate the UUT or the number of hosts for which we determine the best job completion time/training time when no latency is added.
Application UUT’s Role #Hosts Metric Runtime Dataset Dataset
Target Size
DNS Server 1 Queries/sec 10M requests A record 10M requests
Memcached Server 5 Queries/sec 10 seconds FB ETC [6] see [6] Memcached Client 1 Queries/sec 10 seconds FB ETC [6] see [6]
STRADS Coordinator 6 Convergence 100K Synthetic 10K samples,
Regression [26] time iterations 100K features
Spark Master 8 Training 100 Spark-perf 100K samples,
Regression [1] time iterations generator 10K features
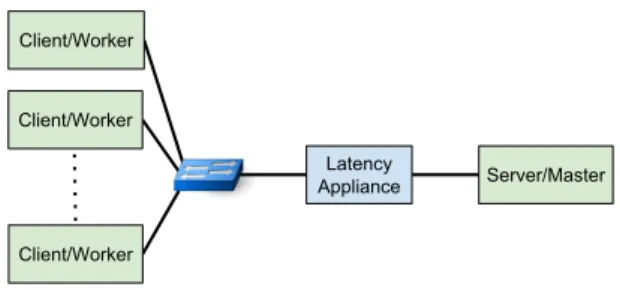
Our methodology is based on the observation that each host’s experience of the net-work can be collapsed to the link connecting it to the Top of Rack switch (ToR). By modifying the properties of the traffic arriving through this link, the host can experience different effects of network latency, as if it was located in different data centers.
In our experiments, in each scenario one host is selected as the unit under test (UUT). This host can act as a server (DNS, memcached), master (STRADS Lasso Regression, Spark Ridge Regression) or client (memcached), depending on the application. While it can be claimed that for some distributed applications, the effect of latency on a single host becomes a statistical combination of the different values, we later show that even under such a model the latency effect on a single host is not negligible.
Between the selected host and all other parts of the setup, we use an appliance that can inject well-controlled latency into the system. The appliance is an open-source contributed NetFPGA SUME project [52], originally included in release 1.4.0. While a detailed eval-uation of the latency appliance is under independent preparation [35], it is described below in Section 4.1. We abstract the network topology as a single queue, represented by the delays injected by the latency appliance and illustrated in Figure 5. This queue imposes delay, from the UUT’s perspective, through the point-to-point link that connects the server to the remaining network.
The experimental setup, Figure 4, is composed of 10 hosts10
. Each host has an Intel Xeon E5-2430L v2 Ivy Bridge CPU with six cores, running at 2.4GHz with 64GB RAM. CPU-power saving, hyper-threading and frequency scaling are disabled. The hosts run Ubuntu Server 16.04, kernel version 4.4.0-75-generic. Each host is equipped with an Intel X520 NIC with two SFP+ ports. Each host is connected at 10Gbit/s using an Arista 7050Q switch. Table 2 describes the settings per application, and during our tests we run each application multiple times for each latency configuration.
4.1
NRG
The Network Research Gadget (NRG) is used in this work as a latency appliance that implements traffic control mechanisms in hardware, replicating the functionality of Net-Em [20]. The hardware implementation provides higher resolution and better control over latency than software -implemented traffic control such as NetEm might afford [40, 24, 21]. The latency injection has a resolution of 5ns and can range from zero to twenty seconds (at low data rates), supporting up to 1.1ms latency for 64B packet at full 10GbE line rate. Traffic control introduces both a constant latency and variable latency to recreate a
10
Client/Worker Client/Worker
Latency
Appliance Server/Master Client/Worker
Figure 4: Experimental setup to evaluate application performance under changing network latency
P,dn+2 P,dn+1 P,dn
Figure 5: Each packet is P delayed by a value d chosen randomly from a certain distri-bution
predefined latency distribution. We refrain from using terms such as jitter, which implies a difference in latency that is both above and below a certain value, as latency injected by NRG is always positive within our setup. The supported latency distributions are: none, user-defined, uniform, normal, Pareto, and Pareto-normal distributions. The definitions for the last three distributions are adapted from NetEm[20]. The user-defined distribution allows specification of any distribution, and can used to recreate the latencies measured in the cloud (Section 2).
Latencies are imposed independently for each direction of each port, thus client to server and server to client added latencies are completely independent thereby replicating the direction-independent latency experienced by packets due to in-network congestion. There is no packet reordering within NRG. As illustrated in Figure 5, a packet P is delayed in a queue inside the appliance for a given amount of time chosen from a given delay distribution. The packets delaydwithin the queue is independent of the inter packet gap. While inter packet gap based latency is possibly using NRG, such latency injection will impose a specific network latency distribution. As we seek to understand the effect of additive latency within the network, we impose per-packet latency control.
5
Application Performance Analysis
We study the scale of latency that affects application performance. For the different tests, we use a per-test setup configured to provide optimal application-performance. All results are averaged over multiple runs. The network latency we introduce using our appliance represents the various sources of latencies throughout a networked system: both static sources, i.e., propagation delay, and variable sources, e.g., end-host delay, and queuing in switches. The topology of the network, notably non-uniformity of latency among client-server paths, is still an unexplored factor in determining the application behaviour that we leave for future work at this time.
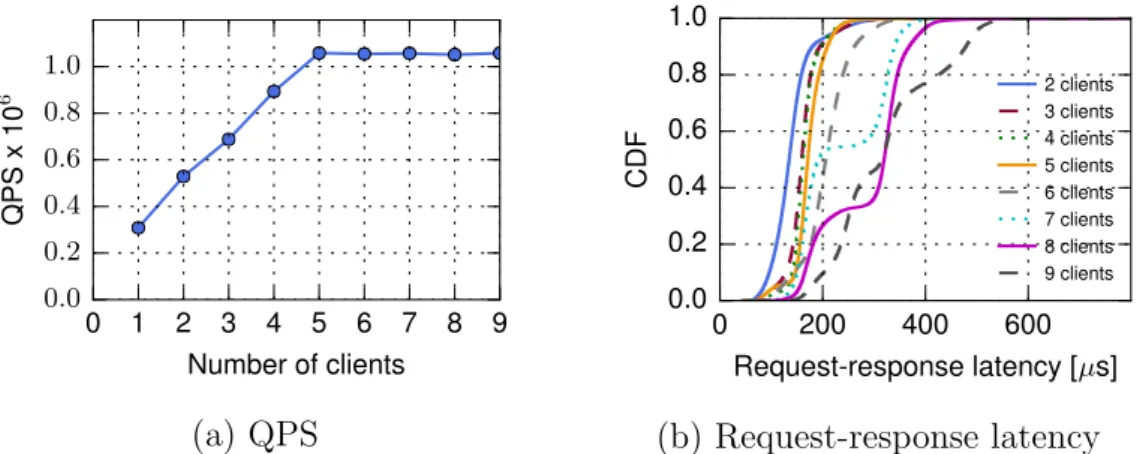
0 1 2 3 4 5 6 7 8 9 Number of clients 0.0 0.2 0.4 0.6 0.8 1.0 Q P S x 1 0 6 (a) QPS 0 200 400 600 Request-response latency [µs] 0.0 0.2 0.4 0.6 0.8 1.0 C D F 2 clients 3 clients 4 clients 5 clients 6 clients 7 clients 8 clients 9 clients (b) Request-response latency
Figure 6: Baseline analysis to determine the maximum QPS that can be achieved by the Memcached server.
5.1
Setting the Baseline
Before experimenting with the effect of latency, we first find the baseline performance of each application. We set the following goals for the baseline settings:
• Results must be stable. Running the same test multiple times, using the same seed,
needs to produce similar results.
• Results must be reproducible. Running the same test on different (comparable)
machines should produce similar results. Results should not vary over time, and should not be affected by externalities (e.g. other machines in our experimental data center).
• Results should not be affected by our tools and methodology. For example, the
number of samples should be sufficient, the latency appliance should not limit the link bandwidth and any statistics should be collected outside run time, as not to affect available computation resources.
• Baseline performance should be the maximum achievable performance of the UUT.
The setup and application should be configured in a manner that achieves the maximal performance possible using the available resources.
• Baseline setup should achieve the maximum UUT performance using a minimum
number of hosts. The UUT (acting as a server, worker or other) resources should be saturated, but without overloading the host.
To exemplify the last point: lets consider a client-server application, where the peak performance of the server is N queries per second. The minimum number of clients required to achieve this performance isk. Any number of clients abovek can still achieve
N queries, but not more. What we seek is to understand the effect of performance on such server using k clients, where any loss of performance will be due to latency rather than e.g. processing or storage. Had we picked any number of clients greater than k, it is possible that the host had maintained a performance of N queries per second, but the sensitivity to the network would not have been exposed.
For each of the workloads, we follow the guidelines above, conducting multiple exper-iments required to set the aforementioned baseline. An example of such baseline analysis is provided in Figure 6 for memcached. We vary the number of client machines from 1 to 9, and one of the clients, called the master client, also takes measurements. In this con-figuration, memcached achieved a maximum of approximately 1.05M QPS (Figure 6(a))
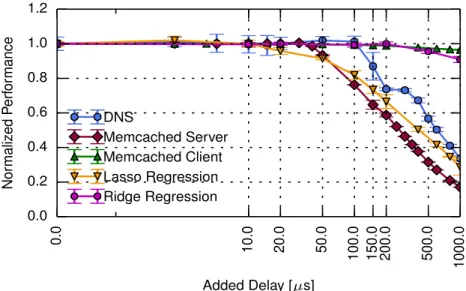
0 .0 1 0 .0 2 0 .0 5 0 .0 1 0 0 .0 1 5 0 .0 2 0 0 .0 5 0 0 .0 1 0 0 0 .0 Added Delay [µs] 0.0 0.2 0.4 0.6 0.8 1.0 1.2 N o rm a lize d P e rf o rm a n ce DNS Memcached Server Memcached Client Lasso Regression Ridge Regression
Figure 7: The effect of static latency on different applications.
using five clients machines (180 connections total). From Figure 6(a), we observe that, as we reach the maximum compute power of the memcached server, increasing the num-ber of client machines beyond five does not increase the maximum throughput achieved. However, using more than five client machines leads to an increase in the request-response latency per client(Figure 6(b)). Based on these results, we select the setup that yields maximum performance under minimal request-response latency: four client machines to generate load, an additional client machine that keeps QPS and latency measurements, and a sixth machine - the UUT acting as a server.
5.2
Analysing the Effect of Static Latency
To consider the effect of latency on the performance of different applications, we begin by studying the scale of network latency that is enough to have a significant effect. The goal here is not to find a specific number, which is very system dependent, rather to understand what is the scale - ranging from nanoseconds to milliseconds. The scenario that we study here is most notably translated to a placement problem: what is the maximal distance between processing nodes that will not affect the performance of an application? As every 100mof fibre translate to 1µs of RTT, this is becoming an increasing challenge [53]. This
scenario bears similarities to the median latency within data centers, and we explore the effects of those later on.
For each application, a baseline performance is determined on our setup. Next, NRG is used to introduce a constant latency between the UUT and the network. A range of constant latencies, from 2µs to 1000µs is introduced, and the applications’ performance
is measured for each latency value.
To compare the effect of additive latency on each of the applications, we normalise their performance. The baseline performance is marked as 1, and the ratio between the measured performance at each latency point, and the baseline performance is shown in Figure 7. The x-axis is the static latency added (in µs, for RTT) while the y-axis is
the normalized performance. We note that each application has a different performance metric, as shown in Table 2.
All applications are sensitive to latency, though on very different scales. For STRADS Lasso Regression, we observe performance degradation when as little as 20µs are added
to the RTT (10µs in each direction), while Ridge Regression on Spark is not affected
and slaves, and not also between the slaves themselves. We also considered a scenario where we introduced additional latency using NetEm at the slaves, however we did not see noticeable effects below 500µs RTT. The memcached sever is also very sensitive to
latency: 100µs are enough for over 20% performance degradation, and the performance
is halved around twice this number. DNS is also affected by latency at the scale of hundreds of microseconds, and its drop in performance is much steeper than STRADS Lasso Regression. Contrary to the memcached server case, adding static latency to a single memcached client has a minimal effect on the overall aggregated performance of the 5 clients (measured by the master client), which is likely due to the design of the benchmark.
This sensitivity to latency demonstrates two orders of magnitude difference between applications. As previous work has shown 10µs to be the scale of latency between two
hosts connected back-to-back [53, 14], this certainly makes memcached and STRADS Lasso Regression very sensitive to their physical resource allocation.
6
Discussion
The Impact of Network Latency The fact that network latency affects performance is well known (e.g. [12, 9, 13]), yet our experiments expose for the first time the extent of sensitivity to latency for some applications: with 10µs latency in each direction enough
to have a noticeable effect, and 50µs latency in each direction enough to significantly
negatively impact the performance. Given that only a few years ago this was the scale of latency within the host alone [38], it means that much more attention must continue to be paid to the host. A second aspect is the attention to the distance between servers: with longest cable length reaching 900m [17], equivalent to 9µs RTT on the fibre alone, and
expected to grow beyond the kilometre, performance can be noticeably affected. When scaling the data center comes at the cost of additional hops between servers, passing the more switches increases latency further. This has ramifications for workload placement and physical host sharing when trying to reach performance targets.
Generalizing The Results While the impact of latency on performance, evaluated in Section 5, is conducted on a specific setup, the results presented in this paper can be generalized to other setups and scenarios as well. While there are differences between platforms, due to their different capabilities, the results are at the same scale and follow the same trends.
Validation An extensive validation of NRG and the methodology used in this paper is done prior to our experiments. The characterization and evaluation of NRG are part of a different work [35].
Limitations In this paper, we have limited ourselves to a study of application perfor-mance and data center network latency. Our methodology may be trivially adapted to understand the impact of network bandwidth upon application performance. This adap-tation would only require a derivative hardware appliance setup to constrain and control the available network bandwidth between network end-hosts.
We note that our cloud RTT measurements are not fully representative of all the cloud data centers latency, as they are a sample capture over a limited period of time and space. These measurements represent potential latency scenarios to which an application may be subjected when running in the cloud.
7
Related Work
Network Latency. Network latency was identified as a crucial factor for having a good user experience several decades ago [12]. Latency is more difficult to control and improve-upon when compared with network bandwidth [37]. In recent years, tail latency has been considered an important issue for interactive applications in data centers [9, 13], because it gets magnified at scale. Multiple efforts have been proposed in this space [5, 49, 25].
In this context, it is important to have a complete breakdown of latency for common end-host systems used in data centers [53], but also of the current end-to-end network latencies in cloud data centers. Several previous works looked into the network condi-tions in cloud data centers, noting that network latency within data centers can vary significantly. Studies were conducted in EC2 in 2010 [8, 45] and in 2013 [48] to mea-sure network latency, identifying as causes for the observed latency variation queuing in switches, queueing at end-hosts in the hypervisor or co-scheduling of CPU bound and latency-sensitive tasks. Mogul et al. [34] performed latency measurements between two pairs of VMs from several cloud operators. Their work looks at several options to infer network latency requirements for cloud tenants, focussing on a hypervisor-based mecha-nism that would not require modifications at the tenants. In our work, we explore through controlled experiments the impact that network latency has on several cloud applications, using a hardware device that injects latency with high resolution. Pingmesh [19] reports network latency measurements for two data centers, one used for distributed storage and MapReduce, and the second used for interactive search service, observing similar ranges as ours. We performed our own cloud latency measurement study with the aim of obtaining realistic network latency ranges and distributions to use as inputs for our experiments.
The scale of latency contributions within data centers keeps shrinking: while only five years ago a switch latency of 10µs and an OS stack latency of 15µs were considered the
norm [38], today’s numbers are an order of magnitude smaller [53, 7]. It is within the context of these scales that we position our contribution. While previous work (e.g. [15]) considered application performance with the latency between the user to the data center to be included, our work focuses on latency within the data center and thus is focussed upon values orders of magnitude lower. [42] investigates the causes of latency inflation in the Internet, since network latency in the Internet is seen as a concern for user experience. Several works focused on providing network latency guarantees by controlling and re-ducing in-network queueing [18, 22, 51]. They show the impact of network congestion on different applications’ performance (for Memcached on request-response latency [18, 22], for PTPd on the clock offset [18], for Naiad barrier synchronization latency [18]). While their work gives an indication of the negative impact that network congestion has on application performance, it does not attempt to quantify its scale, their focus being on developing a solution to limit it. We performed a detailed analysis of network latency impact on application performance, where the injected network latency encompasses dif-ferent causes, not only network congestion.
A different analysis than ours focuses on understanding networking requirements for data center resource disaggregation [16], using similar cloud applications. Kay et al. [36] analyzed Spark using different workloads, finding that improving network performance can improve job completion time by a median of at most 2%, results which are in accordance with ours, since Spark is not a network intensive application.
Memcached. Due to its popularity and extensive use by companies to provide sub-strates for their services, there is a large body of work that sought to improve Mem-cached’s throughput and request latency. Leverich et al. [27] described techniques to co-locate latency-sensitive workloads (memcached in particular) with other workloads,
while maintaining good quality-of-service for the latency-sensitive applications. IX [10], a dataplane operating system that leverages hardware virtualization to separate network processing from the other kernel functions, manages to reduce memcached’s latencies to approximately half for an unloaded server. A Memcached over RDMA design has been proposed by Jose et al. [23], which reduces latency by considerable factors compared to the traditional design. Chronos [25] is a framework that provides predictable network latency and reduces tail latency for Memcached and other data center applications by partitioning requests based on application-level packet header fields and load balancing them across threads at the NIC. In our work, we do not propose techniques to improve the performance of Memcached. We evaluate the current performance of Memcached under arbitrary network latency, looking mainly at an aggregate metric of performance (QPS) as a measure of the overall work that a Memcached server can do, not only at individual request-response latencies.
Distributed Machine Learning. There has been an explosion of distributed ma-chine learning frameworks and libraries in recent years: Spark MLlib [33], GraphLab [30], parameter servers [28], Bosen [46], STRADS [26]. Companies have also released libraries: Google’s TensorFlow [4], Microsoft’ Cognitive Toolkit [3] and Distributed Machine Learn-ing Toolkit [2]. While considerable effort has been put in optimizLearn-ing network communica-tion and reducing the impact of network condicommunica-tions on ML applicacommunica-tions, an evaluacommunica-tion to understand the impact of network latency on their performance is needed in the context of the observed variability of network conditions in the cloud.
8
Conclusion
In this paper, we studied the effects of network latency on typical cloud applications, ranging from DNS to distributed machine learning applications. We performed exten-sive measurements by artificially injecting controlled network latency in our experimental setup, quantifying the impact of network latency on application performance. Our re-sults show that different applications are affected by latency to differing amounts. Even small network delays, in the order of tens of microseconds can impact the application performance significantly.
9
Acknowledgments
This work has received funding from Leverhulme Trust Early Career Fellowship ECF-2016-289 and the Isaac Newton Trust, European Union’s Horizon 2020 research and innovation programme 2014-2018 under SSICLOPS (grant agreement No. 644866) and EU FP7 Marie Curie ITN METRICS (grant agreement No. 607728).
References
[1] Apache Spark MLLib. https://spark.apache.org/docs/1.2.2/ml-guide.html. [Online; accessed January 2017].
[2] Distributed Machine Learning Toolkit. hhttps://www.dmtk.io/. [Online; accessed January 2017].
[3] Microsoft Cognitive Toolkit. https://www.microsoft.com/en-us/research/ product/cognitive-toolkit/. [Online; accessed January 2017].
[4] TensorFlow. https://www.tensorflow.org/. [Online; accessed January 2017].
[5] Alizadeh, M., Kabbani, A., Edsall, T., Prabhakar, B., Vahdat, A., and
Yasuda, M. Less is More: Trading a Little Bandwidth for Ultra-low Latency in
the Data Center. In Proceedings of the 9th USENIX Conference on Networked Sys-tems Design and Implementation (Berkeley, CA, USA, 2012), NSDI’12, USENIX Association, pp. 19–19.
[6] Atikoglu, B., Xu, Y., Frachtenberg, E., Jiang, S., and Paleczny, M.
Workload Analysis of a Large-scale Key-value Store. In Proceedings of the 12th ACM SIGMETRICS/PERFORMANCE Joint International Conference on Measurement and Modeling of Computer Systems (New York, NY, USA, 2012), SIGMETRICS ’12, ACM, pp. 53–64.
[7] Attar, M. A., Crowcroft, J., Eggert, L., and Wehrle, K. Network
La-tency Control in Data Centres (Dagstuhl Seminar 16281). Dagstuhl Reports 6, 7 (2016), 15–30.
[8] Barker, S. K., and Shenoy, P. Empirical Evaluation of Latency-sensitive
Appli-cation Performance in the Cloud. In Proceedings of the First Annual ACM SIGMM Conference on Multimedia Systems (New York, NY, USA, 2010), MMSys ’10, ACM, pp. 35–46.
[9] Barroso, L. A. Landheld Computing. InIEEE International Solid State Circuits
Conference (ISSCC) (2014). Keynote.
[10] Belay, A., Prekas, G., Klimovic, A., Grossman, S., Kozyrakis, C., and
Bugnion, E. IX: A Protected Dataplane Operating System for High Throughput
and Low Latency. In 11th USENIX Symposium on Operating Systems Design and Implementation (OSDI 14) (CO, 2014), USENIX Association, pp. 49–65.
[11] Bozkurt, I. N., Aguirre, A., Chandrasekaran, B., Godfrey, P. B.,
Laughlin, G., Maggs, B., and Singla, A. Why Is the Internet so Slow?!
Springer International Publishing, 2017, pp. 173–187.
[12] Cheshire, S. It’s the Latency, Stupid, may 1996. [Online; accessed July 2016].
[13] Dean, J., and Barroso, L. A. The Tail at Scale. Commun. ACM 56, 2 (Feb.
2013), 74–80.
[14] Emmerich, P., Raumer, D., Wohlfart, F., and Carle, G.A study of network
stack latency for game servers. In 13th Annual Workshop on Network and Systems Support for Games (Dec 2014), pp. 1–6.
[15] Faisal, A., Petriu, D., and Woodside, M. Network Latency Impact on
Per-formance of Software Deployed Across Multiple Clouds. In Proceedings of the 2013 Conference of the Center for Advanced Studies on Collaborative Research (2013), CASCON ’13, pp. 216–229.
[16] Gao, P. X., Narayan, A., Karandikar, S., Carreira, J., Han, S.,
Agar-wal, R., Ratnasamy, S., and Shenker, S. Network Requirements for Resource
Disaggregation. In Proceedings of the 12th USENIX Conference on Operating Sys-tems Design and Implementation (Berkeley, CA, USA, 2016), OSDI’16, USENIX Association, pp. 249–264.
[17] Ghiasi, A., Baca, R., Quantum, G., and Commscope, L. Overview of Largest Data Centers. In Proc. 802.3 bs Task Force Interim meeting (may 2014).
[18] Grosvenor, M. P., Schwarzkopf, M., Gog, I., Watson, R. N. M., Moore,
A. W., Hand, S., and Crowcroft, J. Queues Don’T Matter when You Can
JUMP Them! In Proceedings of the 12th USENIX Conference on Networked Sys-tems Design and Implementation (Berkeley, CA, USA, 2015), NSDI’15, USENIX Association, pp. 1–14.
[19] Guo, C., Yuan, L., Xiang, D., Dang, Y., Huang, R., Maltz, D., Liu,
Z., Wang, V., Pang, B., Chen, H., Lin, Z.-W., and Kurien, V. Pingmesh:
A Large-Scale System for Data Center Network Latency Measurement and Analy-sis. In Proceedings of the 2015 ACM Conference on Special Interest Group on Data Communication (New York, NY, USA, 2015), SIGCOMM ’15, ACM, pp. 139–152.
[20] Hemminger, S. NetEm - Network Emulator. http://man7.org/linux/
man-pages/man8/tc-netem.8.html. [Online; accessed January 2017].
[21] Hofeld, T., and Fiedler, M. The unexpected QoE killer: When the network
emulator misshapes traffic and QoE. In 2015 Seventh International Workshop on Quality of Multimedia Experience (QoMEX) (May 2015), pp. 1–6.
[22] Jang, K., Sherry, J., Ballani, H., and Moncaster, T. Silo: Predictable
Message Latency in the Cloud. InProceedings of the 2015 ACM Conference on Special Interest Group on Data Communication (New York, NY, USA, 2015), SIGCOMM ’15, ACM, pp. 435–448.
[23] Jose, J., Subramoni, H., Luo, M., Zhang, M., Huang, J., ur Rahman,
M. W., Islam, N. S., Ouyang, X., Wang, H., Sur, S., and Panda, D. K.
Memcached Design on High Performance RDMA Capable Interconnects. In 2011 International Conference on Parallel Processing (Sept 2011), pp. 743–752.
[24] Jurgelionis, A., Laulajainen, J.-P., Hirvonen, M., and Wang, A. I. An
empirical study of netem network emulation functionalities. InComputer Communi-cations and Networks (ICCCN), 2011 Proceedings of 20th International Conference on (2011), IEEE, pp. 1–6.
[25] Kapoor, R., Porter, G., Tewari, M., Voelker, G. M., and Vahdat, A.
Chronos: Predictable Low Latency for Data Center Applications. In Proceedings of the Third ACM Symposium on Cloud Computing (New York, NY, USA, 2012), SoCC ’12, ACM, pp. 9:1–9:14.
[26] Kim, J. K., Ho, Q., Lee, S., Zheng, X., Dai, W., Gibson, G. A., and Xing,
E. P. STRADS: A Distributed Framework for Scheduled Model Parallel Machine
Learning. InProceedings of the Eleventh European Conference on Computer Systems
(New York, NY, USA, 2016), EuroSys ’16, ACM, pp. 5:1–5:16.
[27] Leverich, J., and Kozyrakis, C. Reconciling High Server Utilization and
Sub-millisecond Quality-of-service. In Proceedings of the Ninth European Conference on Computer Systems (New York, NY, USA, 2014), EuroSys ’14, ACM, pp. 4:1–4:14.
[28] Li, M., Andersen, D. G., Park, J. W., Smola, A. J., Ahmed, A.,
Josi-fovski, V., Long, J., Shekita, E. J., and Su, B.-Y. Scaling Distributed
Conference on Operating Systems Design and Implementation (Berkeley, CA, USA, 2014), OSDI’14, USENIX Association, pp. 583–598.
[29] Liddle, J. Amazon found every 100ms of latency cost them 1% in sales., aug 2008.
[30] Low, Y., Bickson, D., Gonzalez, J., Guestrin, C., Kyrola, A., and
Hellerstein, J. M. Distributed GraphLab: A Framework for Machine Learning
and Data Mining in the Cloud. Proc. VLDB Endow. 5, 8 (Apr. 2012), 716–727.
[31] Marinos, I., Watson, R. N., and Handley, M. Network Stack Specialization
for Performance. InProceedings of the 2014 ACM Conference on SIGCOMM (2014), SIGCOMM ’14, ACM, pp. 175–186.
[32] Maynard-Koran, P. Fixing the Internet for real time applications: Part II, feb
2016.
[33] Meng, X., Bradley, J., Yavuz, B., Sparks, E., Venkataraman, S., Liu, D.,
Freeman, J., Tsai, D., Amde, M., Owen, S., Xin, D., Xin, R., Franklin,
M. J., Zadeh, R., Zaharia, M., and Talwalkar, A. MLlib: Machine Learning
in Apache Spark. J. Mach. Learn. Res. 17, 1 (Jan. 2016), 1235–1241.
[34] Mogul, J. C., and Kompella, R. R. Inferring the Network Latency
Require-ments of Cloud Tenants. In Proceedings of the 15th USENIX Conference on Hot Topics in Operating Systems (Berkeley, CA, USA, 2015), HOTOS’15, USENIX As-sociation, pp. 24–24.
[35] Nikolaou, C., Zilberman, N., and Moore, A. W. Characterization of Network
Tools for Traffic Generation and Traffic Capture. In Proceedings of ACM Internet Measurement Conference (IMC) (2017), ACM.
[36] Ousterhout, K., Rasti, R., Ratnasamy, S., Shenker, S., and Chun,
B.-G. Making Sense of Performance in Data Analytics Frameworks. In Proceedings of the 12th USENIX Conference on Networked Systems Design and Implementation
(Berkeley, CA, USA, 2015), NSDI’15, USENIX Association, pp. 293–307.
[37] Patterson, D. A. Latency Lags Bandwidth. Commun. ACM 47, 10 (Oct. 2004).
[38] Rumble, S. M., and et al.. It’s Time for Low Latency. In HotOS’13 (2011),
USENIX Association, pp. 11–11.
[39] Schroeder, B., Wierman, A., and Harchol-Balter, M.Open Versus Closed:
A Cautionary Tale. In Proceedings of the 3rd Conference on Networked Systems Design & Implementation - Volume 3 (Berkeley, CA, USA, 2006), NSDI’06, USENIX Association, pp. 18–18.
[40] Shaikh, J., Minhas, T. N., Arlos, P., and Fiedler, M. Evaluation of delay
performance of traffic shapers. In Security and Communication Networks (IWSCN), 2010 2nd International Workshop on (2010), IEEE, pp. 1–8.
[41] Singla, A., Chandrasekaran, B., Godfrey, P. B., and Maggs, B. The
Internet at the Speed of Light. In Proceedings of the 13th ACM Workshop on Hot Topics in Networks (2014), HotNets-XIII, ACM, pp. 1:1–1:7.
[42] Singla, A., Chandrasekaran, B., Godfrey, P. B., and Maggs, B. The
Internet at the Speed of Light. In Proceedings of the 13th ACM Workshop on Hot Topics in Networks (New York, NY, USA, 2014), HotNets-XIII, ACM, pp. 1:1–1:7.
[43] Su, A. J., Choffnes, D. R., Kuzmanovic, A., and Bustamante, F. E.
Drafting Behind Akamai: Inferring Network Conditions Based on CDN Redirections.
IEEE/ACM Transactions on Networking 17, 6 (Dec 2009), 1752–1765.
[44] Tibshirani, R. Regression shrinkage and selection via the lasso: a retrospective.
Journal of the Royal Statistical Society: Series B (Statistical Methodology) 73, 3 (2011), 273–282.
[45] Wang, G., and Ng, T. S. E. The Impact of Virtualization on Network
Per-formance of Amazon EC2 Data Center. In Proceedings of the 29th Conference on Information Communications (Piscataway, NJ, USA, 2010), INFOCOM’10, IEEE Press, pp. 1163–1171.
[46] Wei, J., Dai, W., Qiao, A., Ho, Q., Cui, H., Ganger, G. R., Gibbons,
P. B., Gibson, G. A., and Xing, E. P. Managed Communication and
Consis-tency for Fast Data-parallel Iterative Analytics. In Proceedings of the Sixth ACM Symposium on Cloud Computing (New York, NY, USA, 2015), SoCC ’15, ACM, pp. 381–394.
[47] Xu, F., Liu, F., Jin, H., and Vasilakos, A. V. Managing performance
over-head of virtual machines in cloud computing: A survey, state of the art, and future directions. Proceedings of the IEEE 102, 1 (2014), 11–31.
[48] Xu, Y., Musgrave, Z., Noble, B., and Bailey, M. Bobtail: Avoiding Long
Tails in the Cloud. In Proceedings of the 10th USENIX Conference on Networked Systems Design and Implementation (Berkeley, CA, USA, 2013), nsdi’13, USENIX Association, pp. 329–342.
[49] Zats, D., Das, T., Mohan, P., Borthakur, D., and Katz, R. DeTail:
Reduc-ing the Flow Completion Time Tail in Datacenter Networks. SIGCOMM Comput. Commun. Rev. 42, 4 (Aug. 2012), 139–150.
[50] Zhang, X., Tune, E., Hagmann, R., Jnagal, R., Gokhale, V., and Wilkes,
J. CPI2: CPU Performance Isolation for Shared Compute Clusters. In Proceedings of the 8th ACM European Conference on Computer Systems (2013), EuroSys ’13, ACM, pp. 379–391.
[51] Zhu, T., Berger, D. S., and Harchol-Balter, M. SNC-Meister:
Admit-ting More Tenants with Tail Latency SLOs. In Proceedings of the Seventh ACM Symposium on Cloud Computing (New York, NY, USA, 2016), SoCC ’16, ACM, pp. 374–387.
[52] Zilberman, N., Audzevich, Y., Covington, G., and Moore, A. W.
NetF-PGA SUME: Toward 100 Gbps as Research Commodity. IEEE Micro 34, 5 (Septem-ber 2014), 32–41.
[53] Zilberman, N., Grosvenor, M., Popescu, D. A., Manihatty-Bojan, N.,
Antichi, G., Wojcik, M., and Moore, A. W. Where Has My Time Gone? In
Proceedings of the 18th International Conference on Passive and Active Measurement