REGIONAL FORMATION
AND
DEVELOPMENT STUDIES
Journal of Social Sciences
No. 3 (14)
Regional Formation and Development Studies
Klaipėda University Social Science Faculty
Scientific Editor
Prof. Dr. Antanas Bučinskas Klaipėda University (Lithuania) Deputy of scientific editor
Prof. Dr. Ligita Šimanskienė Klaipėda University (Lithuania) Editorial board:
Assoc. Prof. Dr. Ciprian Beniamin Benea University of Oradea (Romania) Prof. Habil. Dr. Remigijus Čiegis Vilnius University (Lithuania)
Prof. Dr. Larisa Emeljanova I. Kant Federal University (Russia Federation)
Assoc. Prof. Dr. Sebastian Gadal University of Versailles Saint Quentin en Yvelines (France) Prof. Dr. Hilmar Þór Hilmarsson University of Akureyri (Iceland)
Prof. Dr. Vytautas Juščius Klaipėda University (Lithuania) Prof. Dr. Jose Manuel Lasierra Zaragoza University (Spain) Prof. Dr. Vaidutis Laurėnas Klaipėda University (Lithuania) Prof. Habil. Dr. Tadeusz Palmowski Gdansk University (Poland)
Assoc. Prof. Dr. Romana Provazniková Pardubice University (Czech Republic) Prof. Habil. Dr. Bronislaw Sitek Alicide De Gasperi University (Poland) Prof. Dr. Biruta Sloka Latvia University (Latvia)
Assoc. Prof. Dr. Eduardas Spiriajevas Klaipėda University (Lithuania) Prof. Dr. Rimantas Stašys Klaipėda University (Lithuania)
Prof. Habil. Dr. Gerhard Strohmeier Alpen-Adria Universitat Klagenfurt (Austria) Prof. Habil. Dr. Stasys Vaitekūnas Klaipėda University (Lithuania)
Prof. Habil. Dr. Povilas Zakarevičius Vytautas Magnus University (Lithuania) Lithuanian language editor: Vilma Urbonavičiūtė (Lithuania)
Layout: Ingrida Sirvydaitė (Lithuania)
Cover design: Vilhelmas Giedraitis (Lithuania) The first number was published in 2007.
There are 3 annual volumes in Lithuanian, English languages.
The journal included in EBSCO Publishing Business Source Complete databases (http://www.ebscohost.com/titleLists/bth-journals.pdf).
Address:
Herkaus Manto g. 84, LT-92294 Klaipėda, Lietuva, tel. (370 46) 39 88 95, fax (370 46) 39 89 99 Internet address: http://www.ku.lt/leid
© Klaipėda University, 2014 © Social Science Faculty, 2014
Your read journal were papers were selected from international conference. Faculty of Social Sciences at Klaipėda University was organize the 10th annual International Scientific Conference. Conference topic: “Social Sciences for Regional Development: Influence and Perspectives”. The Conference were held in Klaipėda University (Klaipėda, Lithuania) on the 25th–26th of September 2014. The Conference was dedi-cated to the 20th anniversary of Faculty of Social Sciences. The main purpose of the Conference is to pro-mote the actualization of social science research, revealing social sciences’ impact on regions. The confer-ence aims to bring together scientists and researchers from different countries who study regions and who are able to offer a new theoretical ideas and their practical application in relevant case studies. Proposed topic areas: Economics; Management; Politics and administration; Sociology, Media and Communication studies; Social geography and regional development. The papers is covered the conference aim and there are a lot of interesting and different papers how was mentioned above. We hope that you’ll find this journal quite attractive.
Deputy of scientific editor Prof. dr. Ligita Šimanskienė, Klaipėda University (Lithuania)
PRATARMĖ
Jūsų rankose žurnalas, kuriame spausdinami straipsniai, atrinkti iš tarptautinėje konferencijoje skaitytų pranešimų. Klaipėdos universiteto Socialinių mokslų fakultetas 2014 m. rugsėjo 25−26 dienomis jau dešimtą kartą organizavo kasmetinę tarptautinę konferenciją „Socialiniai mokslai regionų plėtrai: įtaka ir perspek-tyvos“, ji skirta Socialinių mokslų fakulteto 20-mečiui. Konferencijos tikslas – skatinti socialinių mokslinių tyrimų aktualizaciją, atskleidžiant socialinių mokslų įtaką regioninei plėtrai. Konferencijos kryptys: ekono-mika, vadyba, politikos mokslai ir viešasis administravimas, sociologija, medijos ir komunikacija, socialinė geografija ir regionalistika.
Žurnale pateikiami įvairių sričių mokslininkų požiūriai, vertinant skirtingas perspektyvas. Tikime, kad mūsų leidinys bus jums patrauklus ir paskatins mokslo pažinimą.
Redaktoriaus pavaduotoja Prof. dr. Ligita Šimanskienė, Klaipėdos universitetas (Lietuva)
TURINYS
Ieva Andersone, Rita Greitane
The Development of Retail Store Types in the Context of Region and Consumer Behaviour / 7 (Mažmeninės prekybos parduotuvių plėtra vartotojų elgsenos ir regiono kontekste) / 15 Ģirts Burgmanis
Commuting Patterns in Riga Agglomeration: Evidence From a Survey Analysis of Youth / 16 (Važinėjimo Rygos aglomeracijoje modeliai: jaunimo anketinės apklausos rezultatai) / 29 Lāsma Dobele, Aina Dobele
Economic Gains from Social Entrepreneurship Development in Latvia / 30 (Socialinės entreprenerystės plėtros Latvijoje ekonominė nauda) / 39
Raimonds Ernšteins, Anita Lontone, Jānis Kauliņš, Līga Zvirbule, Jānis Strazdiņš, Zane Šteinberga, Ivars Kudreņickis, Ilga Zīlniece, Andris Ķepals
Municipal Climate Change Adaptation Governance in Latvia: Approaching Cross-Sectorial and Multi–Instrumental understanding / 40
(Klimato kaitos valdymas Latvijoje, siekiant multiinstrumentinio supratimo ir supratimo tarp sektorių) / 52 Algirdas Giedraitis
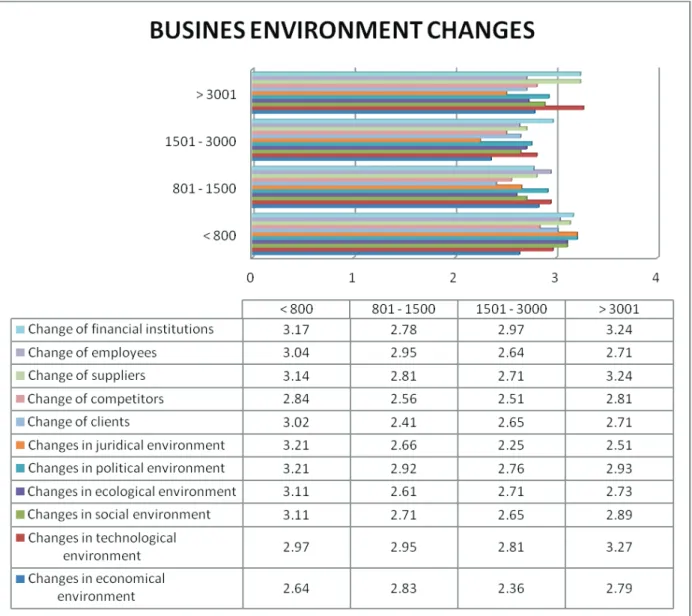
(Expression of Business Environment Changes in Trading Company: Research of Users’ Opinion) / 53 (Verslo aplinkos pokyčių raiška prekybos įmonėje: vartotojų nuomonių tyrimas) / 62
Viktorija Grigaliūnaitė, Lina Pilelienė
Satisfaction and Loyalty of Lithuanian Rural Tourists: Segmentation and Managerial Implications / 64 (Lietuvos kaimo turistų pasitenkinimas ir lojalumas: segmentavimas ir vadybiniai sprendimai) / 74 Juris Hāzners, Helma Jirgena
Barter Terms of Trade in Latvian Trade in Agricultural Commodities and Processed Food Products / 76 (Prekybos žemės ūkio ir maisto pramonės produkcija Latvijoje sąlygos) / 85
Hilmar Þór Hilmarsson
Iceland and Latvia: the Economic and the Social Crisis / 86 (Islandija ir Latvija: ekonominė ir socialinė krizė) / 96 Laura Juchnevič
Roles of Lithuanian Library Network in Regional Infrastructure of Culture and Information / 98 (Lietuvos bibliotekų tinklo vaidmuo kultūrinėje ir informacinėje regionų infrastruktūroje) / 111 Deimena Kiyak, Linara Pranckevičiūtė
Causal Survey of Purchase of Non-life Insurance Products for Lithuanian Consumers / 112 (Ne gyvybės draudimo produktų pirkimo priežasčių tyrimas) / 121
Arimantas Bronislovas Knašas
Knowledge Spread in Lithuania in Terms of Published Patent Applications / 123 (Žinių plitimas Lietuvoje paskelbtų patentinių paraiškų požiūriu) / 137
Evgeny Kolbachev
University as an Actor of a Regional Development Processes: Practices of the Southern Federal District of Russia / 139
(Universitetas, kaip regiono vystymo veiksnys: federalinio pietų Rusijos regiono pavyzdys) / 147 Janis Kusis, Baiba Miltovica, Linda Feldmane
Lithuanian and Latvian Urban Youth Perceptions and Stereotypes of Farmer and Agriculture / 148 (Lietuvos ir Latvijos miestų jaunimo stereotipai, suvokimas apie žemdirbius ir žemės ūkį) / 156
(AB ,,Klaipėdos kartonas“ organizacinės kultūros vertinimas) / 169 Rasa Rukuižienė
Sustainable Tourism Development Implications to Local Economy / 170 (Tvarios turizmo plėtros poveikis vietos ekonomikai) / 177
Jeļena Šalkovska, Anda Batraga, Elīna Ogsta
Actual Problems of Enterprises’ Marketing Management / 178 (Aktualios organizacijų rinkodaros valdymo problemos) / 188 Daiva Verkulevičiūtė-Kriukienė
Change of Living Standards in Lithuania, Latvia and Estonia after Joining the European Union / 189 (Gyvenimo lygio kaita Lietuvoje, Latvijoje ir Estijoje, įstojus į Europos Sąjungą) / 198
Anastasija Vilcina, Gunta Grinberga-Zalite, Kristine Makovska
Development of Hemp Industry in the European Union and Latvia / 199 (Kanapių pramonės vystymas Europos Sąjungoje ir Latvijoje) / 206 Olga Stariņeca, Inesa Voronchuk
Employer Branding Training Development for Public Organisations / 207
(Darbdavio, kaip „prekės ženklo“, mokymai viešojo sektoriaus organizacijose) / 219 Katarzyna Szczepańska-Woszczyna
Innovation Processes in the Social Space of the Organization / 220 (Inovaciniai procesai socialinėje organizacijos erdvėje) / 229
T H E D E V E L O P M E N T O F R E TA I L S TO R E T Y P E S
I N T H E C O N T E X T O F R E G I O N A N D C O N S U M E R B E H AV I O U R
Ieva Andersone1 Rita Greitane2 Riga Technical University (Latvia) ABSTRACT
The aim of the article is to analyze the prevalence of retail stores in Latvian regions and consumer behavior in Latvia. The authors have analyzed the prevalence of largest retail stores in regions and consumer behavior in retail using available statistical data and research done by the authors. As a result of the study, the role of shop assistants was determined during the purchasing process, and the results of the study have been compiled from the viewpoint of generations. These results can help retail companies to work more effectively by choosing the most appropriate retail store types
KEY WORDS: Consumer behavior, Retailing, Retail store types, Generation.
JEL CODES: M11, M31, F1
DOI: http://dx.doi.org/10.15181/rfds.v14i3.859 Introduction
Research problem: Latvia saw one of the highest increases in retail sales in 2013. Persisting macro-economic stability and rising real disposable incomes resulted in higher private spending, which was one of the main contributors to the country’s GDP over the review year. Lower income tax and rising real wages re-sulted in higher real disposable incomes in 2013 and improved consumer confidence, thus encouraging peo-ple to spend more on discretionary goods, both in the grocery and non-grocery sector. Non-grocery retailers outperformed their grocery peers in 2013, mainly thanks to a further improvement in customer purchasing power which in turn shaped buyer preferences in favour of larger purchases that were not affordable during the economic downturn. Despite the growth of non-store retailing, traditional retailing in stores has held its positions. Therefore, it is important to recognize store types and their development trends.
Research purpose is to produce recommendations for store development in regions using statistical data and the study made by the authors.
Research object are particularities of consumer behaviour and retail stores in Latvia.
The main goal is to analyze the prevalence of store types in the regions of Latvia. The study attributes particular importance to the role of shop assistants and their influence on the decision making of customers during the purchasing process.
1 Ieva Andersone – lecturer, Riga Technical University, Faculty of Engineering Economics and Management. Scientific interests: marketing, consumer behaviour
E-mail: [email protected] Tel.: +371 676 086 47
2 Rita Greitane – lecturer, Riga Technical University, Faculty of Engineering Economics and Management. Scientific interests: marketing, consumer behaviour
E-mail: [email protected] Tel.:+371 676 086 47
Ieva Andersone, Rita Greitane
THE DEVELOPMENT OF RETAIL STORE TYPES IN THE CONTEXT OF REGION AND CONSUMER BEHAVIOUR
Research tasks are to analyze statistical data of retailing and retail stores in regions; to analyze the importance of shop assistants and what the seller does correctly or incorrectly; to establish division of gen-erations and their proportions in Latvia; to develop decision making tools for retailing companies.
Research methods: The authors employ well-known methods of research – analysis and synthesis methods, grouping, comparison etc.
1. Development of retail stores in Latvia
Latvia saw one of the highest increases in retail sales in 2013. Persisting macro-economic stability and rising real disposable incomes resulted in higher private spending, which was one of the main contributors to the country’s GDP over the review year. Increasing private spending encouraged retailers to open new stores and expand their assortments with higher-priced grocery and non-grocery goods, thereby providing addition-al stimulus to retail saddition-ales growth. Lower income tax and rising readdition-al wages resulted in higher readdition-al disposable incomes in 2013 and improved consumer confidence, thus encouraging people to spend more on discretion-ary goods, both in the grocery and non-grocery sector. Non-grocery retailers outperformed their grocery peers in 2013, mainly thanks to a further improvement in customer purchasing power which in turn shaped buyer preferences in favour of larger purchases that were not affordable during the economic downturn. Higher disposable incomes enabled Latvians to renew spending on electronics, home appliances and home improvement products, thereby stimulating overall non-grocery growth. An additional boost to non-grocery sales came from customers’ willingness to improve their appearance by buying new apparel, footwear and beauty products. With a value share of 10 %, Depo DIY SIA was the leading player in non-grocery retailers in 2013. The company’s strong position can mainly be attributed to its large stores which offer a broad vari-ety of goods, ranging from home improvement and gardening to food and pets. (Euromonitor, 2014) These tendencies can be seen by examining the net turnover share in trade shown in Table 1.
Table 1. Net turnover share in trade for 2012, %
Trade Net turnover share, %
Food and beverage 55
Home and garden 22
Equipment and suupplies for office and production 7,8
Clothing, footwear and accessories 5,5
The rest 10
Source: Statistical data, 2014
Meanwhile, the dominating grocery players, Rimi Latvia SIA and Maxima Latvija SIA, enlarged their non-grocery assortments, especially in supermarkets and hypermarkets, in order to defend their market share from non-grocery rivals. Maxima Latvija SIA runs sales through conveniences stores, supermarkets and hy-permarkets while Rimi Latvia SIA operates through Supernetto discounters, suhy-permarkets and hyhy-permarkets. Both grocery retail chains compete for the leading position in the market by attempting to provide the best possible prices, large discounts and comprehensive loyalty programmes. Companies are regularly running massive advertising campaigns via TV, outdoor media and the internet. (Euromonitor, 2014) Store-based retailing is expected to perform healthily over the forecast period and record modest growth rates as the Lat-vian economy stabilises. The non-grocery channel is projected to see slightly faster expansion compared to grocery retailing as consumers will allocate a major portion of rising real disposable incomes to discretionary items. In contrast, non-store retailing is predicted to continue to record rapid annual growth rates thanks to the surging popularity of shopping over the internet (Euromonitor, 2014). The increasing use of smartphones and tablet computers fuelled growth within non-grocery retailing during 2013. Internet retailer 220.lv SIA was the leading player in 2013, accounting for 8 % of total non-store retailing value sales. The company managed to outperform previous market leader direct seller Avon Cosmetics Latvia SIA, mainly due to the
increasing popularity of shopping online and soaring demand for electronics and appliances. It should be noted that 220.lv SIA has a very broad product assortment ranging from fragrances and child goods to furni-ture and sports (Euromonitor, 2014).
Despite the growth of non-store retailing, traditional retailing in stores has held its positions. Therefore, it is important to recognize store types and their development trends. However, there is no unique method of categorizing retailers.
Some studies (e.g. Jin and Kim, 2003; Arnold and Reynold, 2003; Geuens, Brengman and Rosette, 2001; Bloch, Ridgway and Dawson, 1994) provide evidence that shoppers patronise diverse store formats as they find an opportunity to interact with others as well as store personnel, share their experience and knowledge with others, and bond with others at store format (Jayasankaraprasad and Kathyayani, 2013: 9).
The authors will use the conventional classification method of retail stores based on their size and assort-ment. These include malls (shopping centers), hypermarkets, department stores, supermarkets, specialized supermarkets, warehouse stores, specialized stores, convenience stores (neighbourhood stores), boutiques, pop-up stores, discounters and express stores (Berman, Evans, 2003: 280−282; Newman, Cullen, 2005: 24−27). The article will analyse the most widespread retail store types, such as hypermarkets, supermarkets, convenience stores (neighbourhood stores), in Latvia as a whole and in its regions. The largest members of the market which represent these retail store types are Rimi, Maxima, Top, AIBE and LaTS. Their turnover and profits/losses have been summarised in Table 2.
Table 2. Financial data of largest retailers (thsd lats/thsd euro)
Retailer Year Turnover (thsd lats/thsd euro) Profit/loss (thsd lats/ thsd euro)
Maxima 2012 450 368.000/640 815.931 14 342.000/20 406.828 2011 413 210.000/587 944.861 1 870.000/2 660.770 2010 390 450.000/555 560.298 10 700.000/15 224.728 Rimi 2012 443 326.000/630 796.068 8 950.000/12 734.703 2011 417 160.000/593 565.205 6 345.000/9 028.122 2010 391 800.000/557 481.175 5 228.000/7 438.774 top! 2012 7 980.000/11 354.517 19.994/28.449 2011 5 490.000/7 811.566 6.363/9.054 2010 4 100.000/5 833.774 0.068/0.097 AIBE 2012 5 940.000/8 451.859 No data 2011 4 895.697/6 965.949 -109.924/-156.408 2010 4 200.000/5 976.062 -77.893/-110.832 Source: www.nozare.lv 2014
In the study “101 most valuable Latvian enterprise” done by the business idea magazine “Kapitāls”, IBS Prudentia and Riga Fund stock exchange in 2012 “Maxima Latvija” (with a value of Ls 174.1 million on the 01.01.2012) was in 10th place, whereas in the 2013 study (with a value of Ls 173.4 million on the 01.01.2013) it was in 11th place. Their largest competitor “Rimi Latvia” in the 2012 and 2013 studies with a value of Ls 131.5 million on the 01.01.2012 and a value of Ls 141.7 million on the 01.01.2013 was in the 16th place (www.nozare.lv, 2014).
There are 196 food stores operating under the trademark top!, 99 of which are top! and 97 mini
top! stores owned by 17 local enterprises (April 2014): “Firma Madara 89”, LLC, JSC “LPB”, JSC
“Diāna”, “Lars Limited” LLC, “Gabriēla” LLC, “Dekšņi” LLC, “Mārksmens” LLC, “Madara 93”
LLC, “AA & Co” LLC, “Krista – A” LLC, JSC “Roga – Agro”, “ESSA” LLC, “G.A.L.” LLC,
“Lekon” LLC, “Ogres Prestižs” LLC, “Pārtikas veikalu grupa” LLC and “Oregano” LLC.
“Iepir-kuma grupa” LLC is the enterprise that represents the supermarket chain top! and provides for joint
purchasing procedures and common marketing activities for the whole supermarket chain.
(www.
toppartika.lv). In contrast, “Latvijas tirgotāju kooperācija AIBE” is an enterprise with international
Ieva Andersone, Rita Greitane
THE DEVELOPMENT OF RETAIL STORE TYPES IN THE CONTEXT OF REGION AND CONSUMER BEHAVIOUR
experience. Its founders are not only Latvian entrepreneurs and the trading camera, but also the
cooperation “Aibe mažmena” in Lithuania. At the moment there are around 450 stores in Latvia,
which operate in various Latvian regions as part of AIBE.
Rimi and Maxima are represented in the hypermarket, supermarket, convenience store and
dis-counter segments, whereas top! and AIBE operate mostly in the convenience store segment.
The entry and increasing activity of large supermarket chains in the convenience store segment
in various regions in Latvia shows both that these regions are becoming more appealing and that the
supermarket chains are willing to strengthen their positions in this retail segment. Turnover, staff
costs and number of employees according to region are shown in Table 3.
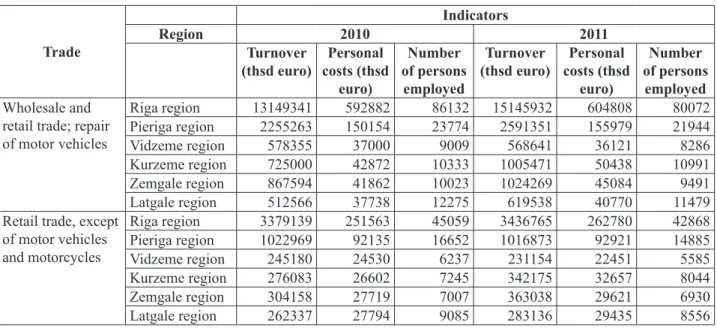
Table 3. Main entrepreneurship indicators in trade by statistical region for 2010−2011
Trade
Indicators
Region 2010 2011
Turnover
(thsd euro) costs (thsd Personal euro)
Number of persons
employed
Turnover
(thsd euro) costs (thsd Personal euro)
Number of persons employed Wholesale and
retail trade; repair of motor vehicles Riga region 13149341 592882 86132 15145932 604808 80072 Pieriga region 2255263 150154 23774 2591351 155979 21944 Vidzeme region 578355 37000 9009 568641 36121 8286 Kurzeme region 725000 42872 10333 1005471 50438 10991 Zemgale region 867594 41862 10023 1024269 45084 9491 Latgale region 512566 37738 12275 619538 40770 11479
Retail trade, except of motor vehicles and motorcycles Riga region 3379139 251563 45059 3436765 262780 42868 Pieriga region 1022969 92135 16652 1016873 92921 14885 Vidzeme region 245180 24530 6237 231154 22451 5585 Kurzeme region 276083 26602 7245 342175 32657 8044 Zemgale region 304158 27719 7007 363038 29621 6930 Latgale region 262337 27794 9085 283136 29435 8556
Source: Statistical data, 2014
From Table 3 it is evident that the lowest trade figures are in the Latgale and Vidzeme regions, whereas the best figures are in the Riga and Pieriga regions. Respectively, staff costs are the highest in the Riga and Pieriga regions and the lowest in Latgale and Vidzeme regions but turnover per retail employee is the highest in the Riga region, the lowest in the Vidzeme region.
The number of Rimi, Maxima, top! and AIBE stores in regions is shown in Table 4. Table 4. Number of shops of Maxima and Rimi by statistical region
Region Maxima Total Rimi Total XXX hyper-market XX
super-market X neighbour-hood store marketHyper- marketSuper- (discounter)Supernetto
Riga region 3 5 47 55 12 21 24 57 Pieriga region – 6 18 24 4 3 8 15 Vidzeme region – 5 11 16 – 2 5 7 Kurzeme region – 4 12 16 2 6 6 14 Zemgale region – 3 11 14 2 2 7 11 Latgale region – 3 16 19 1 3 5 9 Total 3 26 115 144 21 37 55 113
It can be seen from Table 4 that the strategy of Maxima is oriented towards opening hypermarkets only in Riga, whereas Rimi also has hypermarkets outside Riga, except the Vidzeme region.
The number of stores of top! and AIBE in regions is shown in Table 5.
Table 5. Number of shops of Top! And AIBE by statistical region
Region Top! Total AIBE
supermarket
(top) convenience store (mini) convenience store
Riga region 5 – 5 37 Pieriga region 15 13 28 18 Vidzeme region 25 25 50 18 Kurzeme region 29 45 74 4 Zemgale region 14 5 19 41 Latgale region 7 7 14 45 Total 95 95 190 163
Source: www.top.lv, www.aibe.lv, 2014
Most of AIBE stores are located in Latgale, Zemgale and Riga regions but top! stores – in Kurzeme and Vidzeme regions.
2. Consumer behaviour in retail
The study results can be analysed and interpreted from various perspectives but in order to achieve the aim of the study the survey results were summarised by dividing all respondents into generations.
Generations which have been surveyed during the study are (Levy, 1998: 98−104): • “Net” generation: 0–19 years old;
• “Y” generation: 20–30 years old; • “X” generation: 31–45 (50) years old; • “Post-war” generation: 51−62 years old; • “Silver” generation: older than 63 years.
A questionnaire was made to carry out the reasearch. When answering questions about whether or not the shop assistant, when selling a good in a shop, influences customer decision about buying the good, 50 % of respondents answered positively, whereas 48 % thought that the actions of the shop assistant influence them rarely.
When compiling answers about what is done incorrectly in stores, respondents indicated that the shop assistant:
• is impolite, communicates very little or does not communicate at all. A contrasting opinion was also expressed that shop assistants are too active and insistent with their offers;
• are willing to help as soon as the customer has entered the store without having the chance to see the assortment;
• is in a bad mood, is impatient;
• often is busy with his/her own affairs, chats, eats, argues, plays videogames and so on;
• enforces his/her own opinion, is too persistent, does not give the customer the chance to assess the good on his/her own;
• stands next to the customer and observes him/her, follows the customer like a shadow, thinks of the customer as a potential thief;
• is not interested in selling;
• is not knowledgeable about the assortment of goods and their applications, often is incompetent; • does not like if the customer touches the good with his/her hands but ultimately does not purchase
Ieva Andersone, Rita Greitane
THE DEVELOPMENT OF RETAIL STORE TYPES IN THE CONTEXT OF REGION AND CONSUMER BEHAVIOUR
After analysing the answers, the authors conclude that Latvian customers pay attention, analyse and ob-serve the work of shop assistants. Customers form their opinion about the company according to the actions of the shop assistant, who thus forms the overall image of the company. During more detailed interviews customers revealed that it is very difficult to change the negative experience they have had and very often information about their negative experience is spread within the social class of the customer through word of mouth.
The results of the study also indicated positive experience during shopping and that this experience en-courages repeated purchases. This validates the assumption of the authors that the sales assistant plays a very important role in the process of purchasing goods. Taking into account theories of determining and analysing customer needs, it can be concluded that any complaint encompasses potential needs. The authors would like to emphasize that, when analysing customer complaints, a list of customer needs can be constructed, which can be used by shop assistants working in the store. This approach to shop assistant training can ensure that the actions of shop assistants are oriented towards satisfying customer needs and expectations.
Respondents also mentioned various situations when during selling something was not done correctly or when the customer did not benefit from the purchase. Therefore, in order to clarify how often this happens, various specific questions were asked.
The “Net” generation said that sometimes the shop assistant convinces them to make a purchase. In addition, occasionally a purchase is made only because the good was well-position in the store. According to the “Net” generation, the layout of shops is important, but the shop assistant can rarely convince them to purchase a good which will not benefit them economically or socially. Respondents have also noted that sometimes conflict situations arise with the shop assistant, and that 50% of the time the cause is due to the shop assistant and 50% of the time the cause is due to the customer or various external factors. However, it is clear that the opinion of the shop assistant could differ from the opinion of the customer.
The answers of the “Y” generation were similar, but some slight differences could be noticed. Respond-ents in this generation said that they have occasionally purchased a good if it is well-positioned in the store. They also noted that the layout of the store always plays a role in the purchasing process and choice of goods. The shop assistant rarely influences them; however, sometimes conflict situations arise. According to the “Y” generation, the cause of these situations is more often the customer rather than the shop assistant. 55 % of the respondents have noted that the conflict is caused by various external factors. Respondent answers indicate that the “Y” generation is characterized by social maturity and the ability to individually make well-grounded decisions. It is possible that the “Y” generation carefully plans its expenditure and does not make unreasoned purchases.
After studying the answers given by the “X” generation to the aforementioned questions, it can be con-cluded that shop assistants sometimes convince this generation to make a purchase and that members of this generation often purchase goods if they are well-positioned in the store. This generation considers that store layout is more important than shop assistant influence. Conflict situations, which occur rarely (this is a sound indicator based on the age group and social experience of this generation), are more often initiated by customers themselves, but more rarely by shop assistants or various external factors.
The Silver and Post-war generations have mutually similar views; however, they are not identical. Summarizing the results of the study, it can be concluded that: when the age of the customer changes (according to the indicated generations), the influence of the shop assistant on the decison to make a pur-chase changes as well. As the age increases, the influence of the shop assistant increases as well, whereas for younger customers a more important factor is the layout of the store.
This can be explained using various psychological, social, economic and other factors. It should be noted, however, that the habits of the new generation of consumers are changing and that the causes of these changes are directly or indirectly related to the development of information technologies and the internet.
The study confirms that, during the purchasing process, shop assistants, communication and other factors play an important role.
By using the available statistical data about regions it is possible to determine the development trends of every region and find correlations with retail stores located there. Looking at the population statistics it can be seen that the Vidzeme region has the lowest population (only 10 % of the whole population of Latvia); whereas half of the population lives in the Riga and Pieriga regions (see Table 6). Hence, all retail store types are widespread in these regions, and they have the largest number of hypermarkets and supermarkets.
Table 6. Number of inhabitants by statistical region
2011 2012 2013 LATVIA 2074605 2044813 2023825 Riga region 659418 649853 643615 Pieriga region 371952 370128 369987 Vidzeme region 211995 208728 205949 Kurzeme region 271143 266433 262755 Zemgale region 255111 251495 248845 Latgale region 304986 298176 292674
Source: Statistical data, 2014
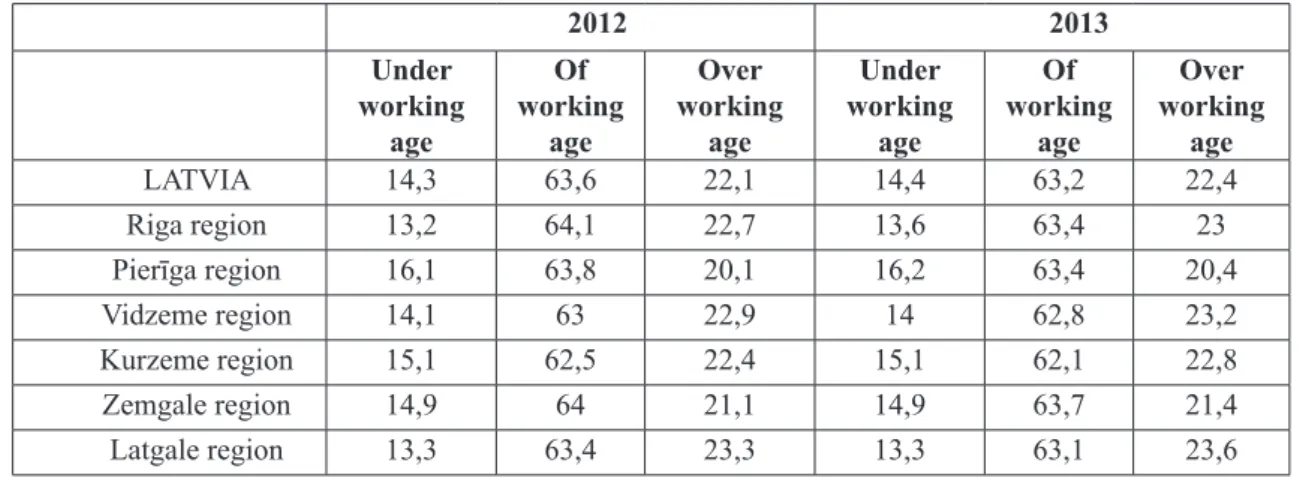
On the other hand, if the population is viewed in terms of its generations, it is seen that around 60 % of people living in regions are working-age. This means that mostly they are people from the “X” and “Y” generations. If we look at the Silver generation, the size of this generation is increasing every year, and this is especially evident in regions.
Table 7. Population by sex and by main group by statistical region at the beginning of the year, %
2012 2013 Under working age Of working age Over working age Under working age Of working age Over working age LATVIA 14,3 63,6 22,1 14,4 63,2 22,4 Riga region 13,2 64,1 22,7 13,6 63,4 23 Pierīga region 16,1 63,8 20,1 16,2 63,4 20,4 Vidzeme region 14,1 63 22,9 14 62,8 23,2 Kurzeme region 15,1 62,5 22,4 15,1 62,1 22,8 Zemgale region 14,9 64 21,1 14,9 63,7 21,4 Latgale region 13,3 63,4 23,3 13,3 63,1 23,6
Source: Statistical data, 2014
Looking at people’s incomes in regions, it is seen that the lowest average salary is in the Vidzeme region. Table 8. Avarage monthly wages and salaries by statistical region of Latvia (in Euro)
2010 2011 2012 2013 Bruto LATVIA 633 660 685 716 Riga region 724 757 778 815 Pieriga region 603 622 649 677 Vidzeme region 485 518 528 560 Kurzeme region 544 559 598 608
Ieva Andersone, Rita Greitane
THE DEVELOPMENT OF RETAIL STORE TYPES IN THE CONTEXT OF REGION AND CONSUMER BEHAVIOUR
2010 2011 2012 2013 Zemgale region 508 547 571 597 Latgale region 440 468 475 490 Neto LATVIA 450 470 488 516 Riga region 511 534 551 583 Pieriga region 429 447 466 491 Vidzeme region 351 376 384 410 Kurzeme region 392 404 430 441 Zemgale region 367 395 413 436 Latgale region 320 340 345 358
Source: Statistical data, 2014
Taking the size of the population and people’s incomes into account (see Table 8), the Vidzeme region is not attractive to the large retail chains Rimi and Maxima because there are relatively few of these stores in this region. On the other hand, Aibe, top! and LaTS convenience stores are more popular.
Conclusions
After analysing the study results, the authors conclude that the Latvian consumers pay attention to shop assistant work, they analyse and observe them. Depending on the shop assistant’s behaviour, the buyer forms an opinion about the company and shop, hence shaping the overall image of the company. During in-depth interviews, people pointed out that it is difficult to change the negative experience, and often this negative experience is disseminated in the buyer’s social layer through word of mouth.
The authors conclude that the shop arrangements, advertising of the goods at the point of sale, and shop assistant behaviour have a great impact during the purchasing process. It must be noted that the shop assis-tant’s behaviour can decisively affect customer decision making during the purchasing process in particular age groups.
Looking at the main entrepreneurship indicators in trade, population size and people’s incomes it can be concluded that retailers pay attention to economic and demographic parameters by choosing the store types which they open in each region.
References
Andersone, I., Gaile-Sarkane, E. (2009). Development of demand and consumption by generations. 5 International scientific conference “Social sciences in global world: possibilities, challenges and perspectives”. Klaipėda Uni-versity. Bridges, Vol. 39. Supplementary issue: scientific volume, p. 165−170.
Arnold, M. J., Reynolds, K. E. (2003). Hedonic Shopping Motivations. Journal of Retaling, Vol. 79 (1), p. 77−95. Bloch, P. H., Ridgway N. M., Dawson, S. A. (1994). The Shopping Mall as Consumer Habitat. Journal of Retailing,
Vol. 70 (1), p. 23–42.
Central Statistical Bureau of Latvia. (2014). Avarage monthly wages and salaries by statistical region of Latvia. Available at: http://data.csb.gov.lv/Table.aspx?layout=tableViewLayout1&px_tableid=DS0070m_euro.px&px_ path=Sociala__%c4%aastermi%c5%86a%20statistikas%20dati__Darba%20samaksa&px_language=en&px_ db=Sociala&rxid=cdcb978c-22b0-416a-aacc-aa650d3e2ce0 [accessed 2014-05-14].
Central Statistical Bureau of Latvia. (2014). Main entrepreneurship indicators in trade by statistical region. Available at: http://data.csb.gov.lv/Table.aspx?layout=tableViewLayout1&px_tableid=TI0021_euro.px&px_path=rupnbuvn__ Ikgad%c4%93jie%20statistikas%20dati__Iek%c5%a1zemes%20tirdzniec%c4%abba%20un%20maksas%20 pakalpojumi&px_language=en&px_db=rupnbuvn&rxid=cdcb978c-22b0-416a-aacc-aa650d3e2ce0 [accessed 2014-05-15].
Central Statistical Bureau of Latvia. (2014). Population by sex and by main age group by statistical region. Avail-able at: http://data.csb.gov.lv/TAvail-able.aspx?layout=tAvail-ableViewLayout1&px_tAvail-ableid=IS0180.px&px_path=Sociala__ Ikgad%c4%93jie%20statistikas%20dati__Iedz%c4%abvot%c4%81ji__Iedz%c4%abvot%c4%81ji%20skaits%20
un%20t%c4%81%20izmai%c5%86as&px_language=en&px_db=Sociala&rxid=19100e33-6a5b-429f-af64-13a44f275c18 [accessed 2014-05-15].
Central Statistical Bureau of Latvia. (2014). Population number and its change by statistical region. Available at: http://data.csb.gov.lv/Table.aspx?layout=tableViewLayout1&px_tableid=IS0032.px&px_path=Sociala__ Ikgad%c4%93jie%20statistikas%20dati__Iedz%c4%abvot%c4%81ji__Iedz%c4%abvot%c4%81ji%20skaits%20 un%20t%c4%81%20izmai%c5%86as&px_language=en&px_db=Sociala&rxid=19100e33-6a5b-429f-af64-13a44f275c18 [accessed 2014-05-15].
Chang, H. J., Eckman, M., Yan, R. N. (2011). Application of the Stimulus-Organism-Response model to the retail envi-ronment: the role of hedonic motivation in impulse buying behaviour. The International Review of Retail, Distribu -tion and Consumer Research, Vol. 21(3), p. 233−249. Available at DOI: 10.1080/09593969.2011.578798 [accessed 2013-10-03].
Euromonitor International. (2014) Non-grocery-retailers in Latvia. Available at: http://www.euromonitor.com/non-grocery-retailers-in-latvia/report [accessed 2014-05-18].
Jayasankaraprasad, C., Kathyayani, G. (2013). Cross-format shopping motives and shopper typologies for grocery shopping: multivariate approach. The International Review of Retail, Distribution and Consumer Research. Avail-able at: http://dx.doi.org/10.1080/09593969.2013.801358 [accessed 2013-10-03].
LETA Biznesa portals. (2014). About top! Available at: http://nozare.lv.resursi.rtu.lv/nozares/trade/uznemumi/item/ B56A80B0-C9FC-4277-B2C5-754A23650E15/ [accessed 2014-05-12].
LETA Biznesa portals.(2014). About aibe. Available at: http://nozare.lv.resursi.rtu.lv/nozares/trade/uznemumi/item/ F8EB429D-DFC3-4507-854A-C7935ACED998/ [accessed 2014-05-12].
LETA Biznesa portals. (2014). About Maxima. Available at: http://nozare.lv.resursi.rtu.lv/nozares/trade/uznemumi/ item/0625334A-2541-4754-900B-AF0660699301/ [accessed 2014-05-12].
LETA Biznesa portals. (2014). About RIMI. Available at: http://nozare.lv.resursi.rtu.lv/nozares/trade/uznemumi/item/ F7D9DC3D-AC39-11D4-9D85-00A0C9CFC2DB/ [accessed 2014-05-12].
Levy, M. (1998) Retailing Management. 3.ed. IRWIN: McGraw-Hill, p. 98–103.
N’jumjen, J., Kallen, P. (2005). Розничная торговля: организация и управление. Питер, с. 24−27.
Solka, A., Jackson, V. P., Min-Young, L. (2011). The influence og gender and culture on Generation Y consumer decision making styles. The International Review of Retail, Distribution and Consumer Research, Vol. 21 (4), p. 391−409. Available at DOI: 10.1080/09593969.2011.596554 [accessed 2013-10-03].
Solomon, M. R. (2006). Consumer behavior: buying, selling and being. 7th.ed., p. 512−514.
Supermarket chain. (2014). About top! Available at: http://www.toppartika.lv/supermarket [accessed 2014-05-13]. Берман, Б., Эванс, Д. Р. (2003). Розничная торговля: стратегический подход. 8-ое издание. Москва: Вильямс,
с. 280−282.
M A Ž M E N I N Ė S P R E K Y B O S PA R D U O T U V I Ų P L Ė T R A VA RTO TO J Ų
E L G S E N O S I R R E G I O N O
K O N T E K S T E
Ieva Andersone, Rita Greitane
Rygos technikos universitetas (Latvija)
SantraukaŠio straipsnio tikslas – išanalizuoti mažmeninės prekybos parduotuvių paplitimą Latvijos regionuose ir Latvijos vartotojų elgseną. Remdamiesi prieinamais statistiniais duomenimis ir savo tyrimo rezultatais, auto-riai išanalizavo didžiausių mažmeninės prekybos parduotuvių pasiskirstymą Latvijos regionuose ir vartotojų elgseną mažmeninėje prekyboje. Tyrimo metu apibrėžtas parduotuvių konsultantų vaidmuo pirkimo procese, tyrimo rezultatai įvertinti kartų požiūriu. Šie rezultatai gali padėti mažmeninės prekybos bendrovėms dirbti efektyviau, pasirinkus tinkamą mažmeninės prekybos parduotuvės tipą.
PAGRINDINIAI ŽODŽIAI: vartotojų elgsena, mažmeninė prekyba, mažmeninės prekybos parduotuvių rūšys, kartos.
Ģirts Burgmanis
COMMUTING PATTERNS IN RIGA AGGLOMERATION: EVIDENCE FROM A SURVEY ANALYSIS OF YOUTH
C O M M U T I N G PAT T E R N S I N R I G A A G G L O M E R AT I O N :
E V I D E N C E F R O M A S U RV E Y A N A LY S I S O F Y O U T H
Ģirts Burgmanis1 University of Latvia (Latvia) ABSTRACT
In the last ten years the evident changes of settlement patterns through suburban growth near to capital city of Latvia occurred. Increase of distance between home and routine activity places as well as changes of public transport and rapid increase of car owner-ship initiated significant changes in commuting patterns of inhabitants living outside of Riga. Although the commuting from subur-ban area to Riga is recently broadly studied, however these researches focused primarily on able-bodied population leaving behind school-age children and young people. The aim of this study is to analyse commuting patterns of young people aged 12 to 17 moving from outskirts of Riga to school located in Riga. This study reveal commuting patterns in Riga agglomeration through wide analysis of spatial patterns of youth commuting, examination of motives and factors affecting transportation mode choice for school trips and commuting times. Findings of the research show existing correlation between location of young people’s place of residence in terms of distance from core city and proportion of them commuting to Riga. Likewise several socio-demographic and socio-economic characteristics of young people have influence on school trip transportation mode choice.
KEY WORDS: youth, geographic mobility, commuting, transportation modes, Riga agglomeration. JEL CODES: R32, J690, J130
DOI: http://dx.doi.org/10.15181/rfds.v14i3.860 Introduction
The society of 21st century are characterised by increased mobility and ability to cover larger areas easier through highly developed transport infrastructure and availability of advanced and faster vehicles. The stud -ies of the everyday movement of local residents, not only reflects the level of economic advantages and the development of social and transport infrastructure, but also links which exist among everyday activity places and help through diversity, intensity and nature of these links, demonstrate the extent to which local residents seek opportunities of work, education, health care, social and cultural amenities (Krišjāne, Bērziņš, 2009). In previous studies the commuting to work was used as an indicator to describe the people movement within Riga metropolitan area (Pierīga), process of suburbanization as well as development and changes of Riga agglomeration (Krišjāne et al., 2007; Krišjāne, Bērziņš, 2011; Krišjāne, Bērziņš, 2009, Krišjāne et al., 2012).
Although these studies show various aspects of commuting patterns such as profile of commuters, time and directions of commuting, these studies mostly ignore young people’s everyday mobility. Therefore the com -muting patterns within Riga agglomerations are not studied sufficiently losing experience of social group with high demands for mobility, but restricted by immaturity and dependency on adults as well as indirect effects of on-going urban transformation and socio-demographic processes including change of the place of residence due to on-going suburbanization, cut off public transport trips, automobilization and optimization of school network. 1 Girts Burgmanis − doctor, lecturer University of Latvia, Faculty of Geography and Earth Sciences. Scientific inte
-rests: human geography, urban geography, children and youth geography E-mail: [email protected]
The aim of the present paper is to analyse commuting patterns of young people aged 12 to 17 moving from outskirts of Riga to school located in Riga. This study has three main tasks. First, to reveal spatial pat -terns of youth commuting from Riga agglomeration towards Riga. Second, to consider motives and factors affecting youth transportation mode choice for school trips. Finally, to examine variations in commuting time by location of the place of residence and transportation mode used for school trip.
In order to gather the data for this study the author organized and managed survey of young people in eleven schools located and distributed in six residential neighbourhoods of Riga, Latvia.
1. Suburbanisation, optimization of school network and changes in transportation behaviour
1.1. Suburbanisation and development of Riga agglomeration
The process of suburbanization similarly as in other Baltic countries (Tammaru, 2001) started in late 1960s and was based on simultaneous process of urbanization initiated by industrialisation and immigration mainly of Russian-speakers from the other Soviet Republics. In Soviet era the migration to suburban areas of major cities were determined by 1) the increasing food shortages throughout most of the socialist world; 2) soviet planning implications restraining spatial development in larger centres with more than 200000 in -habitants and restricting on in-migration to most large cities (Kule, 2009; Tammaru, 2007). Hence the part of the workers concentrated in rural areas near to large cities and in satellite towns. In period of two decades as in other East and Central Europe countries, a series of collective and state farms with high-quality residences and summer home villages emerged in areas around Riga, which provided workers with better homes and complementary agricultural products (Krišjane, Bērziņš, 2009). Along with changes in settlement patterns the number of people living in Riga and the adjacent areas increased by 17 % from 1045,000 in 1970 to 1227,000 by year 1989 (Filimonenko, 1991).
Figure 1. Spatial structure of Riga agglomeration
Source: Department of Human geography, University of Latvia, 2004
Rapid changes of settlement patterns and population growth near to Riga also encouraged necessity to identify the spatial structure and possible borders of this area for planning and research. In 1966 the Riga Suburban Zone Plan and later in 1980s a regional planning project defined Riga agglomeration as unit for
Ģirts Burgmanis
COMMUTING PATTERNS IN RIGA AGGLOMERATION: EVIDENCE FROM A SURVEY ANALYSIS OF YOUTH
further planning (Kūle, 2009; Krišjāne, Bērziņš, 2009). The Rīga agglomeration was defined as “the area which is adjacent” to Rīga city (see Figure 1). Criteria for the delimitation of the boundaries of the Rīga ag -glomeration particularly focused on the intensity of labour migration at a radius of 60 to 70 kilometres with travel times of up to 1.5 hours and includes both urban and rural areas (Krišjāne, Bērziņš, 2009).
After the restoration of Latvia’s independence in 1990s the suburbanization evolved under conditions of market economy including privatization, free price system and establishment of land and housing market. Such dramatic changes encouraged people of lower socio-economic status to leave the cities in order to find cheaper housing elsewhere, other people left the cities because the restitution policy enabled them to become landowners elsewhere (Markausa, 1997) as well as others returned to the suburban homes from which they had once departed in order to find jobs in the cities, especially when they became unemployed in the course of transition (Krišjāne, Bērziņš, 2011).
The process of suburbanisation started to develop more rapidly in the 2000s after joining the EU in 2004 along with the increase in individual wealth, supply of new housing and availability of mortgages (Bērziņš, Krišjāne, Krūzmētra, 2010). People who lived in Soviet-era apartment buildings were increasingly able to improve their living conditions by moving from these old or high priced apartments in city centre to cheaper or new-built dwellings in suburban areas. Upper- and middle-class households moved to suburban areas in search of a higher quality life and environment purchasing dwelling corresponding to their financial re -sources (Bērziņš, Krišjāne, 2008).
However new suburbanites often faced absence of appropriate social, cultural and recreational infra -structure within areas where new residences were located. This encouraged them to use the opportunities of education, medicine and recreation within towns and cities of agglomerations. For example these changes of settlement system within Riga and in Pierīga and displacement of residences outside of the city as well as lack of appropriate infrastructure stimulated rapid increase of distance between routined activity sites and commuting towards Rīga from suburban areas (Krišjāne, Bērziņš, 2009). Most of the former inhabitants of Riga from their residences on the outskirts for daily commuting to work frequently use private cars (Bērziņš, Krišjāne, Krūzmētra, 2010) without which it would be difficult to cover distances varying between few kilo -metres to more than 70.
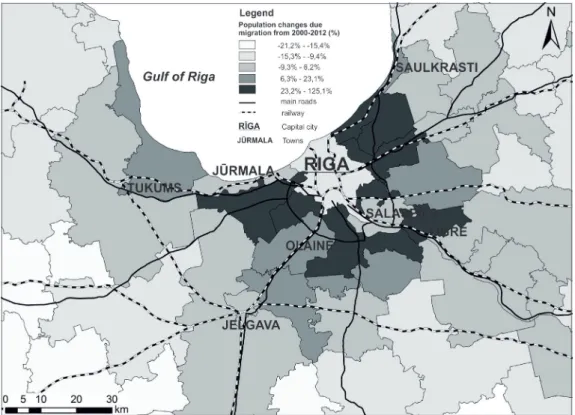
Figure 2. Population changes in municipalities of Riga agglomeration 2000−2012 Source: made by author according to data from CSB of Latvia
Although in the last twenty years starting from 1991 the Riga agglomeration as Latvia experienced population decline due the return migration of Russians to Russia, emigration to the Western countries and negative natural population growth (Eglīte, Krišjāne, 2009), however the population of the Riga agglomera -tion has not decreased substantially since positive internal net migra-tion has counterbalanced emigra-tion losses. Net migration became positive in all municipalities around Riga (40 per cent population growth in the 2000s) in the 2000s as a result of suburbanisation (see Figure 2) and in 2007 the total population of the Riga agglomeration was 1 151 112, including 429 000 suburban residents (Krišjāne et al., 2007; Krišjāne, Bērziņš, 2011; Krišjāne et al., 2012). After administrative territorial reform in 2012 Riga agglomeration consists of 22 municipalities and 16 towns. The territorial structure of this area includes capital Riga as the central city and the internal and external zone of the agglomeration (Bērziņš, Krišjāne, 2008). The two zones differ from one another by the nature of interaction between the zones and the capital city through intensity of daily com -muting and density of population.
1.2. Automobility and public transport system changes
The economic and social changes experienced in Latvia in 1990s directly changed the conditions which previously guided the development of settlements. Critical changes took place in transport system signifi -cantly changing travel behaviour of inhabitants through excessive increase of private car ownership (see in Table 1). Such transformations had a several significant causes. The end of subsidized public transportation and growth of technical maintenance expenses determined dramatic increase of public transport prices in early 1990s in Latvia. The high public transport ticket prices along with relatively low petrol prices stimu -lated decline of public transport users and explosive car ownership and use. Privatisation of public transport sector determined that private enterprises were guided by interests of profit and decrease of passengers (also due negative population growth) was perceived as emergency to cut off public transport trips restricting commuters to easily access the work place or educational institution. Decline in public transport services made existing system of public transport deficient and encouraged acquiring and using a car for commuting. The high use of private car for commuting mainly characterizes Riga agglomeration (Krišjāne et al., 2007).
Table 1. The number of registered passenger cars per 1000 residents
Latvia agglomerationRiga Riga Lithuania Vilnius Estonia Tallinn
1985 70 83 96 73 114 116 1990 136 109 158 107 207 164 1995 133 147 145 198 226 265 311 2000 234 269 243 335 367 338 398 2005 330 376 339 426 497 366 426 2009 418 460 406 508 588 407 412 2012 302 328 296 565 613 428 350 Increase from 1990 (%) 222% 222% 272% 358% 573% 207% 213%
Source: own elaboration using data from various national transport agencies, The World Bank database (http://data. worldbank.org/indicator) and European Commission – Eurostat database (http://epp.eurostat.ec.europa.eu) Emergence of market economics also resolved shortage of cars (Grava, 2007) and cost of car mainte -nance which previously was very expensive because for regular car usage the owner had to buy both petrol, and spare parts in black market (French, 1995). For example Riga, a city of close to a million people, had only ten places selling legally fuel in t 1980s (Grava, 2007). Hence it is also undeniable that in the late 1990s
Ģirts Burgmanis
COMMUTING PATTERNS IN RIGA AGGLOMERATION: EVIDENCE FROM A SURVEY ANALYSIS OF YOUTH
and in 2000s before economic crisis in 2008 the financial resources of households significantly raised and people become more prosperous which made private car purchase more affordable than in the Socialist era. Although the number of private cars increased more than two decades in the last four years (from 2009) it started to decrease. Such decline of private car ownership is only partly associated with the economic crisis in 2008. Main cause for such changes was initiated by Road Traffic Safety Directorate of Latvia maintaining register of vehicles. The vehicles which were registered in other countries or were without roadworthiness test for last five years were excluded from register of vehicles.
1.3. Population decline and optimization of school network
After the regaining of independence in 1990 Latvia experienced continuous population decline due to negative natural population growth. Since 1991 the number of population decreased by 11000 people per year on average. Such demographic trends lead to significant decrease of the number of children and young people in school-age. For example, the number of school-age children in Riga and Riga agglomeration de -creased by more than 35 % from 2000 to 2012 (see in Figure 3).
Figure 3. The number of pupils and schools in Riga and Riga agglomeration 2000−2012 Source: own elaboration according to data from CSB of Latvia
Such changes in the number of school-age children also have negative socio-economic effects. The existing model of school network maintained by the Ministry of Education and Science as well as local mu -nicipalities becomes ineffective and economically non-affordable. Therefore the revision and optimization of school network were initiated leading to closing and restructuration of prospectless schools. Immediate optimization of school network was forced by economic crisis in 2008. 150 schools (16 %) all over the coun -try were closed in four years from 2008 to 2012. The vast majority of schools were closed in rural areas of Latvia forcing the school-age children to choose the schools located in cities or regional centres to precede their education.
Although the most of the schools were closed in rural areas similar trend was observable also in Riga and Riga agglomeration. Figure 3.shows that the number of schools both in Riga and Riga agglomeration decreased by 18 % in period of twelve years (2000−2012).
Hence considering decline in number of schools and restricted accessibility of qualitative education in local areas parents and young people was forced to choose and attend the schools located further from home.
This leads to observable changes in travel behaviour for school trips as well as to increase of flows of school-age children from rural areas towards to cities and towns.
2. Commuting patterns in Riga agglomeration
Previous studies shows that in comparison to 1980s and 1990s daily commuting from the urban centres to rural areas decreased due to disappearance of job opportunities in suburban zone and in modern days the suburbanization is one of the main factors influencing increase of commuting flows from the suburbs to Riga (Krišjāne, Bērziņš, 2009). A total of 42 % of those who migrated to the suburbs from Riga in last ten years became commuters because they continued working in the city (Krišjāne et al., 2012). The concentration of workforce towards Riga acknowledges that agglomeration is functionally monocentric where core is signifi -cant centre for industry, finance, education, entrepreneurship and transport.
In 2000s the largest share of commuters – more than 40 % come from local municipalities adjacent to Rīga city as well as from towns and cities such as Baloži, Saulkrasti, Jūrmala, and Ogre located in agglom -eration zone (Krišjāne, Bērziņš, 2009). Hence the percentage of commuters who travel from internal zone of Riga agglomeration to capital city are higher than proportion of commuters in external zone.
Although most of the commuters use public transport for travelling to work, however the increase of residents in municipalities near to Riga in last ten years also significantly extended traffic flows of private cars towards Riga. Approximately 60 % of commuters use public transport as their main mode of transporta -tion between home and work in Riga (Krišjāne et al., 2012) and 40 % drive a car to get to work (Krišjāne et al., 2007). According to some studies the use of public transport is more pronounced for commuters without migration experience, but use of private car for commuters who migrated to suburbs (Krišjāne et al., 2012). Several studies examining young people travel behaviour and transportation mode choice in Riga agglom -eration showed that the strongest effect on transportation mode choice for young people have only two fac -tors – the family driving habits and travel distance (Burgmanis, 2012).
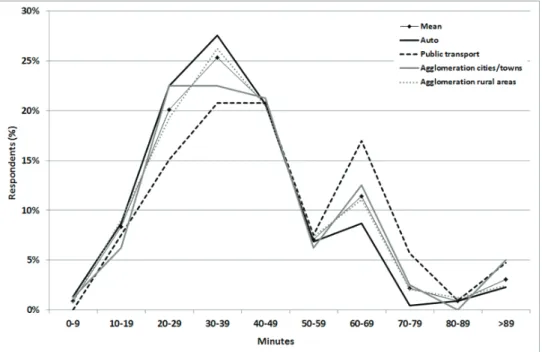
Previous studies on commuting times within Riga agglomerations shows that commuters who use public transport spend 13 minutes more travelling to work in Riga than other commuters (Krišjāne et al., 2012). However the commuting time depends also on location of the place of residence within agglomeration. Com -muters who live in internal rural zone of Riga agglomeration spend 43 minutes in average for work trip. For other commuters who live in towns within internal zone (58 minutes) and in rural areas (70 minutes) and towns (62 minutes) of external zone the commuting times are even higher (Krišjāne, Bauls, 2011).
Largest socio-demographic groups of commuters from both internal and external zone of agglomera -tion are residents aged 20 to 44, Latvians, men, workers who earn average or high incomes (LVL 150−500; 200−700 EUR) and suburban inhabitants who hold university degrees (Krišjāne, Bērziņš, 2009; Krišjāne et al., 2012).
3. Youth’s commuting behaviour and transportation mode choice
Travelling by personal transport, public transport, and bicycle or on foot to the activity sites is the most significant activity daily performed by youths. A contemporary increase of the distance between activity spaces, growing prosperity and changes of intensity of urban life mostly in developed countries significantly increased the rates of car ownership and usage. The non-active and car oriented mode of mobility of families as ʽconsequences of complexity of modern life resulting in shortage of time’ (Mackett, 2002) which directly affects children and young people’s travel patterns through immaturity and dependency on adults. Parents chauffeuring their siblings to the activity sites reduce the opportunity for young people to travel indepen -dently and intervene in active interactions with environment indirectly restricting development of their social and spatial skills (Prezza et al., 2001; Rissotto, Tonucci, 2002; Rissotto, Giuliani, 2006). Passive transporta -tion due to restrictedopportunity to access the most ordinary physical activity for human being – walking may also favour obesity (Cooper et al., 2003; Timperio et al., 2004).
Ģirts Burgmanis
COMMUTING PATTERNS IN RIGA AGGLOMERATION: EVIDENCE FROM A SURVEY ANALYSIS OF YOUTH
Some researchers have argued that distance between home and school is a critical factor which promotes children to walk or choose other transportation modes (McDonald, 2008, Nelson et al., 2009). Several stud -ies emphasize that the choice of transportation mode for reaching a particular activity site is directly as -sociated with youth’s sex, age, family driving habits and previous experience of physical safety within the residential neighbourhood (Valentine, McKendrick, 1997; O’Brien et al., 2000; McDonald, 2008; 2010). Previous studies show that trips to and from school was used for analysing youth travel behaviour. This ap -proach to represent youth commuting behaviour and patterns in Riga agglomeration is also used in this paper.
4. Research Data and Methods
4.1. Data collection and questionnaire
The data for this study was acquired from the survey, called “The Study of Children’s Activities and Per -ception of Urban Environment” which was conducted from March 2010 to February 2012. The survey was performed in eleven schools located and distributed in six residential neighbourhoods of Riga, Latvia. The selection of eleven schools for surveying was made considering their location and the language of instruc -tion and communica-tion (i.e., six Latvian-language and five Russian-language schools were chosen). One teacher delivered and collected the questionnaires, which were designed to be completed within 40 minutes (length of lesson).
The questionnaire consisted of several parts and was designed to extensively study the commuting pat -terns of youth living in Riga agglomeration and attending the school in Riga. First part of questionnaire elic -ited general socio-demographic information about respondent and his/her household characteristics. There were questions asking respondents age, gender, current level of education, type of dwelling, duration of living in place of residence, location of place of residence. The second part of questionnaire examined travel behaviour of young people to most important daily activity sites such as to school, out-of-school formal ac -tivities, city centre and the consumed time for trip from home to school. The last set of questions dealt with family driving habits. This part of survey enquired how frequently parents use car weekly, does family have car and how often weekly parents chauffer children to school and other activity sites.
4.2. Participants
The questionnaires were distributed among pupils from primary school grades 6 to 9 and secondary school grades 10 to 11. In total, 2975 students from 12 to 17 years were surveyed and filled the question -naires. 2707 (91 %) questionnaires were accurately filled. Further to develop the study sample the students who completed the questionnaire but stated that they lived in Riga were eliminated from the analysis, which meant that only 339 (50 %) of the questionnaires were initially included; however, 324 (96 %) of these were accurately completed by the respondents and considered valid. Hence the total sample of study (n) was 324 respondents between the ages of 12 to 17 years.
4.3. Data analysis
Travel mode to school in spring and autumn was used as a dependent variable and consisted of two categories: car and public transport. Traveling time from home to school was also used as a dependent vari -able to analyse youth’s commuting times. To study the transportation mode choice of youth for school trips the nine independent variables were used: sex, age, language of education, current education level, type of dwelling, parent’s driving habits, duration of living in a place of residence, the location of place of residence, distance from home to school. For estimating travel distance from home to school the Google maps were used. The choices of independent variables were based on previous studies on young people travel behaviour and commuting patterns in Riga agglomeration.
The Pearson chi square criteria test was used and calculated to convey whether there is a significant difference between the effect of two categorical independent variables (for example, sex) on a categorical dependent variable (transportation mode for school trips). The SPSS 18.0 for Windows software was used for the statistical data analysis. The cartographic software Arc Gis 9.3 was used to determine and describe the spatial commuting patterns of youth living in Riga agglomeration.
5. Results and Discussion
5.1. Spatial Patterns of Youth Commuting
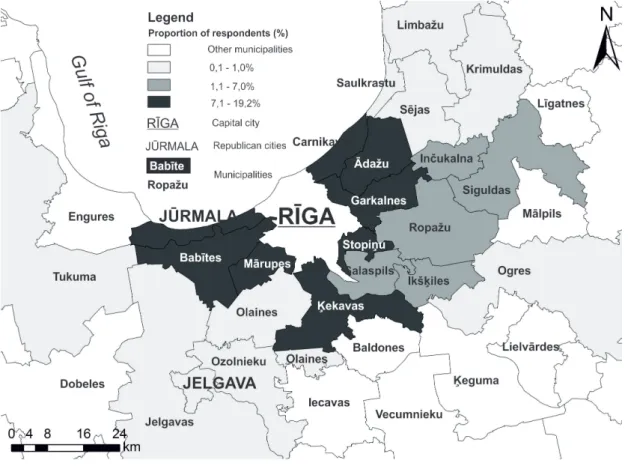
Analysing spatial patterns of youth commuting in Riga agglomeration locations of young peoples’ place of residence were used. The results show obvious connection between proportion of respondents attending school in Riga and location of their residential municipality within Riga agglomeration. Figure 4.confirms that most of the commuters (proportion of respondents is higher than 7 %) are going to Riga from adjacent municipalities (Babītes, Mārupes, Ķekavas, Stopiņu, Garkalnes, Ādažu, Carnikvas) of Riga and Jūrmala (19 %).
Figure 4. School trips from Riga agglomeration to Riga (n = 324) Source: made by author
Previous studies on spatial patterns of commuting in Riga agglomeration shows similar findings (Krišjane, Bērziņš, 2009) emphasizing that most of the commuters travel from internal zone of Riga agglomeration to Riga. Such findings have several obvious explanations. First, highly developed transport system including road network, public bus and train services mostly developed in the Socialist era and improved in Post-socialist era directly link Riga agglomeration internal zone with core city. Second, the frontier municipali -ties of Riga comparing to others are directly exposed to urban transformations and suburbanization. More frequently people desiring to change the place of residence and move from core city to suburban zone chose
Ģirts Burgmanis
COMMUTING PATTERNS IN RIGA AGGLOMERATION: EVIDENCE FROM A SURVEY ANALYSIS OF YOUTH
the place of residence which is located in more quiet and clean area but not far away from their workplace. Another reason to migrate to these municipalities is possibility to access appropriate social infrastructure (kindergarten, gym, swimming pool, etc.) comparing to municipalities located further from core city. Such behaviour leads to high growth of population in adjacent municipalities of Riga and is confirmed by previ -ously discussed data from CSB of Latvia on domestic migration (see also Figure 2). Therefore it is logical that the commuting flows from municipalities like Babītes, Mārupes and etc. also are higher and the majority of young people from the sample of this study live in these municipalities.
The number of schools as component of social infrastructure within municipality without reference on its location may constrain also the flows of youth commuting. The Figure 4. shows that although several municipalities (proportion of respondents: Salaspils – 4.4 %, Olaines – 0.9 %) share border and has direct public transport connections both bus and train with Riga the number of commuters from these areas are less than from previously described. Within both municipalities there are average size towns – centres of munici -palities – Salaspils with 18 000 inhabitants and Olaine with 12 000 inhabitants. In both towns there are two secondary schools, there for e young people living in these municipalities can access appropriate education and opportunities to enable them to develop their knowledge and skills near their homes and there is no need for them to travel longer distances to Riga.
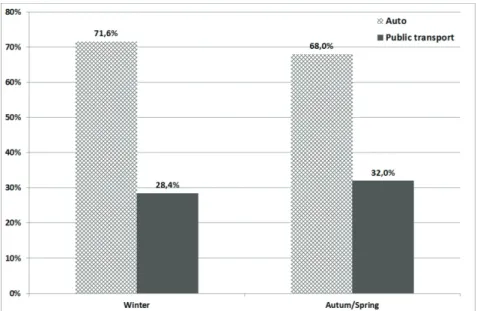
5.2. Commuting and Seasonality
Examining transportation mode choice for school trips and effect of seasonality on such choice data in figure 5 shows that mostly young people are chauffeured to school by their parents. The private care for school trips is used nearly three times more frequently than public transport. These finding are not supported by previous studies on commuting from suburban areas of Riga to core city (Krišjāne, et al., 2012). In these studies where able-bodied population was sampled authors found that commuters use public transport as their main mode of transport for travelling between home and work. Results also show that seasonal changes do not encourage young people to change their transportation mode for school trips. Figure 5 shows that only small increase of car usage and decrease in public transport (3.6 %) are observable. Previous studies on youth’s travel behaviour in Riga agglomeration shows similar findings (Burgmanis, 2012).
Figure 5. Transportation mode for school trips in spring/autumn and winter (n = 324) Source: made by author
The unweighted changes of transportation mode by various seasons could be explained with high usage of private cars by parents who are tended to choose the less time consuming and most comfortable transpor
-tation mode to reach their work place without reference on season of the year. Similarly young people also choose the most comfortable way for the school trip if direction to parents’ work place and school matches.
5.3. Transportation Mode for School Trips
To analyse factors influencing young people’s choice of transportation mode for school trip to Riga cat -egories of nine independent variables were compared (see Table 2). The Pearson chi-square test shows that the gender does not affect transportation mode choice. Both proportions of girls (69.3 %) and boys (66.7 %) who are chauffeured by parents or use public transport (respectively 30.7 % and 33.3 %) for school trips are similar. Table 2 also shows that there are no differences between categories of two other independent vari -ables. There are no statistically significant differences for transportation mode choice between young people learning in schools with Latvian and Russian as language of education as well as young people whose place of residence is located in rural areas of Riga agglomeration and in agglomeration cities or towns.
Results show that six of independent variables included in analysis affect transportation mode choice for school trips. There is evidence that older children more frequently choose to use public transport for com -muting than younger children. These findings are consistent with previous researches focusing on independ -ent mobility and emphasizing that spatial autonomy increases when children grow older and par-ents consider them competent enough for negotiating with danger in public space and public transport (O’Brien, 2000).
Table 2. Factors affecting transportation mode choice for school trips
Factors Auto transportPublic X2 df p
Sex BoysGirls 66,7%69,3% 33,3%30,7% 0,259 1 0,611
Age 12–14 75,6% 24,4% 9,098 1 0,003 **
15–16 60,1% 39,9%
Language of education Latvian 69,3% 30,7% 0,496 1 0,481
Russian 65,5% 34,5%
Education level Primary schoolSecondary school 72,9%53,6% 27,1%46,4% 10,729 1 0,001 **
Type of dwelling Apartament 44,6% 55,4% 20,276 1 0,000 **
Private house 73,7% 26,3%
Parent‘s driving habits < 4 times per week> 3 times per week 71,6%5,9% 94,1%28,4% 32,066 1 0,000 ** Duration of living in
a place of residence < 5 years>5 years 75,2%60,9% 24,8%39,1% 7,634 1 0,006 ** Place of residence Agglomeration rural areas 70,2% 29,8% 2,17 1 0,141
Agglomeration cities/towns 61,4% 38,6%
Distance <25 km>25 km 76,4% 23,6% 3,904 1 0,048 *
85,8% 14,2%
Notes: Significance **p<0.01, *p<0.05
Source: made by author
Another factor which affects transportation mode choice is education level. Young people who attend secondary school more frequently choose the public transport for school trips. Although this factor is partly