Advanced feature selection methods in
multinominal dementia classification from
structural MRI data
Conference or Workshop Item
Accepted Version
Sarica, A., Di Fatta, G., Smith, G., Cannataro, M. and Saddy,
D. (2014) Advanced feature selection methods in multinominal
dementia classification from structural MRI data. In:
CADDementia workshop, Medical Image Computing and
Computer Assisted Intervention (MICCAI) 2014 conference,
1418 Sep 2014, Boston. Available at
http://centaur.reading.ac.uk/37128/
It is advisable to refer to the publisher’s version if you intend to cite from the
work.
Published version at: http://caddementia.grandchallenge.org/workshop/All outputs in CentAUR are protected by Intellectual Property Rights law,
including copyright law. Copyright and IPR is retained by the creators or other
copyright holders. Terms and conditions for use of this material are defined in
the
End User Agreement
.
www.reading.ac.uk/centaur
CentAUR
Central Archive at the University of Reading
Advanced Feature Selection in Multinominal
Dementia Classification from Structural MRI
Data
Alessia Sarica1 ?, Giuseppe Di Fatta2, Garry Mark Smith2,3, Mario
Cannataro1, and James Douglas Saddy3 and for the Alzheimer’s Disease
Neuroimaging Initiative??
1 Department of Medical and Surgical Sciences, Magna Graecia University of
Catanzaro, Italy,sarica,[email protected]
2 School of Systems Engineering, University of Reading, UK,
g.difatta,[email protected]
3
Centre for Integrative Neuroscience and Neurodynamics (CINN), University of Reading, UK,[email protected]
Abstract. Recent studies have shown that features extracted from brain MRIs can successfully discriminate Alzheimer’s disease from Mild Cog-nitive Impairment. This study describes a method that sequentially ap-plies advanced feature selection techniques for finding the best subset of features in terms of binary classification accuracy. The classifiers that provide the highest accuracy, are then used for solving a multi-class prob-lem by the one-versus-one strategy. Although several approaches based on Regions of Interest (ROIs) feature extraction exist, the predictive power of these features has not yet been investigated by comparing filter and wrapper techniques. The findings of this work suggest that (i) the IntraCranial Volume (ICV) normalization can lead to overfitting and can worsen the predictive accuracy on data originated by different studies and (ii) the combined use of a correlation filter and a Random Forest-based filter improves the accuracy of classification.
Keywords: Dementia, MRI, Multinominal classification, Feature selec-tion
?
The author is funded by theEuropean Commission,European Social Fund and Re-gione Calabria. The author had full control of the design of the study, methods used, outcome parameters and results, analysis of data and production of the manuscript.
??
Data used in preparation of this article were obtained from the Alzheimer’s Disease Neuroimaging Initiative (ADNI) database (adni.loni.usc.edu). As such, the inves-tigators within the ADNI contributed to the design and implementation of ADNI and/or provided data but did not participate in analysis or writing of this report. A complete listing of ADNI investigators can be found at: http://adni.loni.usc.edu/wp-content/uploads/how to apply/ADNI Acknowledgement List.pdf.
1
Introduction
Alzheimer’s disease (AD) is one of the most frequent neurodegenerative condi-tion that causes loss of cognitive abilities and memory and, due to its morbidity, it represents a growing health problem. In prodromal stages of AD, patients are usually classified as having an amnestic Mild Cognitive Impairment (MCI), but not all patients affected by MCI will convert in AD. The criteria for distinguish-ing subjects affected by Alzheimer’s disease from Mild Cognitive Impairment are usually based on clinical examination and neuropsychological assessment [1], but analyses of MRI neuroimages have been proposed for the early diagnosis of these two diseases too [2].
Approaches for extracting features from MRI neuroimages are usually based on different type of features from MRIs: the voxel-based approach considers the probability maps of different tissue, the vertex-based approach considers the vertex-level on the cortical surface and the ROI-based approach typically includes only the hippocampus volume and/or shape [3].
A major challenge is related to the discovery of the best subset of biomarkers that could improve the accuracy in discriminating AD from MCI. Furthermore, an important drawback is the lack of a general solution that is independent from the acquisition methods, the scanners, the pre-processing techniques of the neu-roimages and the software used for this purpose. The CADDementia challenge1 was launched with the aim of comparing computer-aided diagnosis methods for dementia based on MRI brain data. In the context of the challenge, this study proposes a fully automated method based on advanced feature selection tech-niques over the statistics generated by FreeSurfer [4], a tool for performing the segmentation and reconstruction of MRI neuroimages.
The use of FreeSurfer statistics for an analogue problem was evaluated in [3], where the authors adopted a given subset of predictors according to domain knowledge and based only on a linear regression criterion. On the contrary, this study applies and combines a number of data-driven methods for estimating the prediction power of features by sequentially applying and combining feature selection techniques on the three binary classification problems: controls versus ADs, controls versus MCIs and ADs versus MCIs. The binary models are eval-uated in terms of estimated accuracy and the best three models are combined into a finalone-versus-one multi-class classification.
Section 2 describes the adopted MRI datasets from the CADDementia chal-lenge and the Alzheimer’s disease Neuroimaging Initiative (ADNI) database and how they have been processed for extracting ROI features. A detailed description of the proposed method is provided in Section 3. Section 4 reports the results of feature selection, binary classification and multi-class classification. Finally, Section 5 presents some conclusions and directions of future work.
1
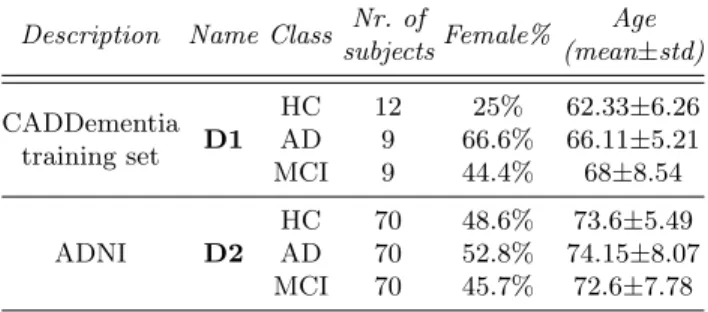
Table 1.Descriptive statistics of the CADDementia and ADNI data sets. Age values (years) are mean±standard deviation and include both female and male subjects.
Description Name Class Nr. of
subjectsFemale% Age (mean±std) CADDementia training set D1 HC 12 25% 62.33±6.26 AD 9 66.6% 66.11±5.21 MCI 9 44.4% 68±8.54 ADNI D2 HC 70 48.6% 73.6±5.49 AD 70 52.8% 74.15±8.07 MCI 70 45.7% 72.6±7.78
2
MRI Datasets and Feature Generation
Given a set of MRI brain images, the classification task considered in this work, consists in building a multinominal classification model over the three classes AD, MCI and healthy control subjects (HC). A pre-processing step is used to generate a set of features from each MRI image. Feature extraction from MRIs is performed by means of FreeSurfer2[4]. In particular, the FreeSurferrecon-all
script is applied with the option hippo-subfields to obtain cortical surface-based measures, cortical and subcortical volume-surface-based measures and volumes of the hippocampus subfields. The features used in this study consists of 45 volumes of subcortical structures, 34 mean thickness and 34 cortical volumes for each hemisphere, and 8 hippocampus volume subfields for each hemisphere, for a total of 197. Including the diagnosis, gender and age the total number of features per subject is 200. FreeSurfer tools store the generated features in a number of files organised per subject and per study. In order to manage the feature generation and selection task, we have adopted the Konstanz Information Miner (KNIME)3, a popular data analytics framework, and have developed
K-Surfer4 [5], a novel KNIME plugin for a fully automated extraction of selected
features from the numerous FreeSurfer output files. The characteristics of the data sets used in this work are reported in Table 1 and briefly discussed in the following sections.
2.1 The CADDementia dataset (D1)
The CADDementia challenge provides two sets of MRI scans, which include subjects from different studies. The competition training data is a small labelled data set. The competition testing data is a larger unlabelled data set. Hence,
2 http://freesurfer.net 3
http://www.knime.org
4
for the aim of this work, only the competition training data are used to evalu-ate the classification models. We will refer to this dataset asD1, which consists of 30 MRI scans (T1w and acquired by 3T scanners) of controls, without any dementia syndrome, Alzheimer’s disease (AD) affected patients and Mild Cogni-tive Impairment (MCI) affected patients. Additional information about the data characteristics, can be found on the official web site of the competition. Feature generation from the CADDementia MRIs was performed by using FreeSurfer 5.3.
2.2 The ADNI dataset (D2)
The Alzheimer’s Disease Neuroimaging Initiative (ADNI) is an international project that collects and validates neurological data such as MRI and PET images, genetics or cognitive tests. Besides imaging resources, ADNI provides cortical reconstruction and volumetric segmentation generated by FreeSurfer.
For the aim of this work, a subset of the ADNI data has been selected to match the characteristics of the CADDementia data. Only MRIs acquired by 3T scanners, weighted in T1 and processed by FreeSurfer, have been selected. The selected data include those subjects (a) diagnosed as HC, AD and late Mild Cognitive Impairment (late MCI) that (b) completely passed the quality test, and include (c) onlyNon-Accelerated T1 scans related to the baseline visit. Data entries with missing values have been excluded.
Among all available subjects complying with the above constraints, the three class groups have been randomly sampled in order to obtain a balanced dataset. This dataset, which we refer to as D2, consists of 210 subjects (70 for each class).
3
Feature Selection and Classification Model Inference
This study employs a fully automatic feature selection approach and considers all the 197 volume and thickness features generated by FreeSurfer as described in the previous section: no manual feature selection is applied, e.g. by exploiting a priori clinical and/or domain knowledge.
High dimensionality of the data may affect the computational performance (processing time) and, worse, it may lead to a wrong estimation and identifica-tion of the relevant predictors. Feature selecidentifica-tion can reduce dimensionality, thus mitigating performance issues and improving the classification accuracy.
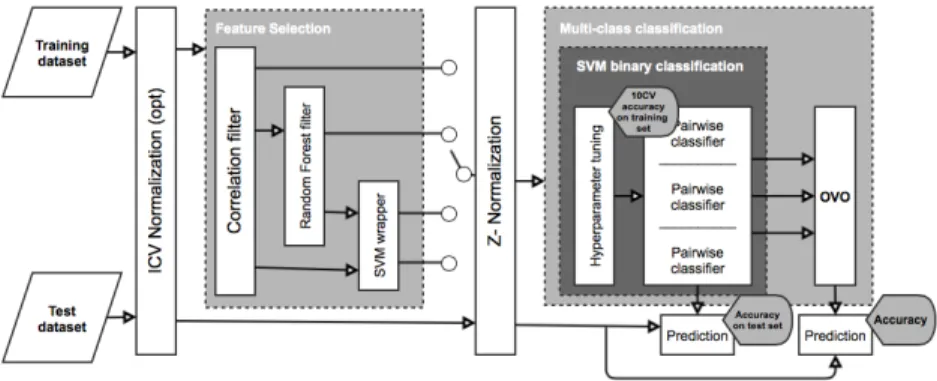
Finding an optimal solution to the feature selection problem would require an exhaustive search over the feature subsets and is intractable. A suboptimal feature selection is typically solved with heuristic methods. Several techniques exist [6]: filters methods are applied independently from the chosen classification method, wrappers methods are strictly associated to the classification method, and embedded methods are performed within the classification process. In this work two filter methods and a wrapper method have been combined to improve the accuracy of the subsequent classification process. The overall data analysis workflow is shown in Figure 1 and is described in the next section.
Fig. 1.Diagram of the adopted workflow based on a combination of feature selection techniques.
3.1 The data analysis workflow
The adopted workflow is composed by five steps (Figure 1): (i) IntraCranial Volume normalization; (ii) Feature Selection with three techniques; (iii) Z-Score normalization; (iv) binary classification and (v) multi-class classification.
The core of the proposed method consists in sequentially applying a Correla-tion filter, a Random Forest (RF) filter and a Support Vector Machines (SVM) wrapper on the training dataset, to identify a subset of features that provides the highest binary classification accuracy. Four different combinations of these feature selection techniques are considered and tested.
ICV normalization•The aim of the IntraCranial Volume (ICV) normal-ization is to take into account differences between subjects in ROIs due to the size of the head and to the gender. It is performed by dividing each volumetric feature by the total intracranial volume of the subject. This normalization is widely used in the literature [7]. The proposed workflow has also been tested without it, as it could hide subtle differences in small areas.
Correlation-based filter • This filter discards any feature that is highly correlated to a feature already selected. A correlation constrain|r|<0.7 is typ-ically adopted, although more restrictive (0.4) and less restrictive (0.85) thresh-olds have also been used [8]. Since no conclusive knowledge about correlation filtering of dementia predictors exists, correlated features have been removed considering a very conservative threshold of 0.90.
Filter•A drawback associated with correlation-based filters is that they do not take into account the relations between features, which can actually improve the classification performance when considered together. One commonly-used data mining technique for filtering is Random Forests (RF), which is able to measure the importance of features w.r.t. the classification outcome, thanks to
the hierarchical decision tree structure that can model non-linear associations. A random forest-based filter is applied after removing highly correlated features and the features with an importance greater than 0.50 are selected.
Wrapper•As stated in [6], filters are tipically faster compared to wrappers, they can effectively reduce space dimensionality and they overcome overfitting. However, filters are independent from the chosen learning algorithm and take into account the prediction power of individual features, not of subsets of fea-tures. Wrapper methods solve this issue, searching the space for those subsets that provide the highest prediction accuracy. The Recursive Feature Elimina-tion (RFE) method [9] performs backward feature eliminaElimina-tion, with the aim of sequentially and iteratively removing the most irrelevant features. In this study, RFE has been applied with an SVM radial predictor as a filter.
Z-Normalization• A Z-score transformation is applied before performing classification to prevent that range differences in the features could have a neg-ative effect.
Binary classification• Many classification methods have been applied to neuroscience data. Among those, it has been shown that Support Vector Ma-chines (SVM) overcome the limitations of other techniques and have been suc-cessfully applied to discriminate a variety of neurological conditions [10]. SVMs are based on kernel functions, interpreted as a measure of similarity between two inputs. In this study a Radial Basis kernel is used. A 10−f old cross-validation method is used for evaluating the accuracy of classification and for finding the optimal cost (C) hyperparameter of the SVM classification model. Multiple SVM models are generated from the training dataset and are applied to the test dataset to compute the prediction accuracy on the three pair-wise classification problems.
Multi-class classification•In general, distinguishing between two classes is an easier task and the most common strategy for multi-class classification is based on the aggregation of binary classifiers. The one-versus-one (OVO) method divides the problem into a number of binary problems equal to all possi-ble combinations of pairs of classes [11]. The final output of the OVO method is derived from the probabilities calculated by each binary classifier as reported in ascore matrix. Different aggregation techniques can be used, such as theVoting Strategy (VOTE) or the Weighted Voting strategy (WV). In this study, since no previous work has been done to determine the most appropriate aggregation strategy in the case of dementia, the VOTE method has been chosen for its simplicity and robustness [11]. The binary models with the highest accuracy are used for the multi-class classification. Where different models presented similar accuracy, the one with a smaller number of features is preferred.
4
Results
Three binary problems, HCvsAD, HCvsMCI and ADvsMCI, have been inves-tigated by applying the proposed approach. Considering the four alternative feature selection combinations, eight SVM models are generated for each binary
problem, four with ICV normalization and four without it. The best binary clas-sification models are finally combined to provide a multinominal clasclas-sification.
4.1 Binary classification
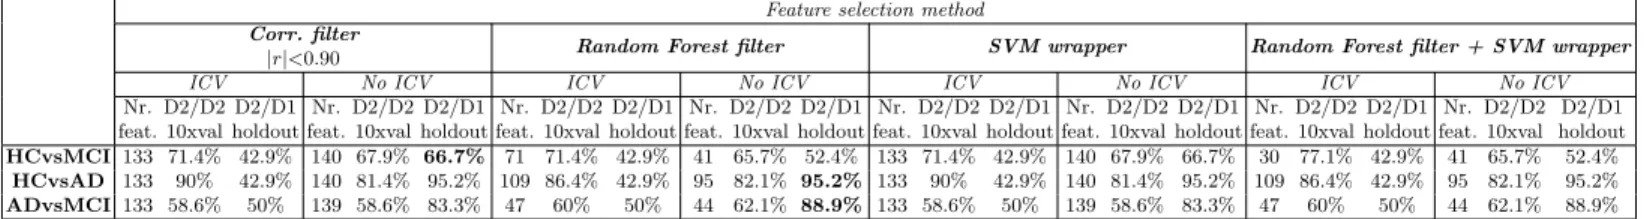
ADNI data (D2) are used for training the binary models and their accuracy is estimated with both ADNI data (10-fold cross validation) and CADDementia data (D1). The detailed results for the binary problems are reported in Table 3. The accuracy for the two cases with and without ICV normalization are provided. The highest accuracies on the ADNI data (D2) for each binary classification problems resulted to be as follows.
1) HCvsMCI: 77.1% with ICV normalization, RF filter + SVM wrapper; 2) HCvsAD: 90% with ICV normalization and Corr. filter; 3) ADvsMCI: 62.1% with no ICV normalization and RF filter.
The accuracy on the CADDementia data (D1) is computed with a simple hold-out method and the highest values were obtained without ICV normaliza-tion in all the three binary problems.
1) HCvsMCI: 66.7% with no ICV normalization and Corr. filter; 2) HCvsAD: 95.2% with no ICV normalization and RF filter; 3) ADvsMCI: 88.9% with no ICV normalization and RF filter.
4.2 Multi-class classification
The three best binary classification models have been chosen in terms of the highest accuracy on D1 and are indicated in bold in Table 3. These models were used for performing the multi-class classification (OVO). In particular, where equal accuracy has been obtained, the model with less features has been preferred. Where the number of features is equal too, it has been preferred the model with less steps applied. The multi-class accuracy is computed with and without ICV normalization. In the case of ICV normalization, the chosen models are: for HCvsMCI RF+wrapper (42.9%), for HCvsAD RF filter (42.9%), for ADvsMCI RF filter (50%). The chosen models with no ICV normalization are: HCvsMCI Corr. filter (66.7%), HCvsAD RF filter (95.2%), ADvsMCI RF filter (88.9%).
These models are used to compute the prediction probabilities on D1 and to generate a score matrix. The VOTE strategy applied to the score matrix of each test data entry provides the final multinominal classification. The best accuracy of 70% was obtained withNo ICV, while ICV normalization seems to introduce a significant degradation in the classification process with an accuracy of only 30%.
The training dataset (D2) and the test data set (D1) originated from dif-ferent studies and, in this work, have not been combined to train the models: the predictive models obtained from D2 have been tested on D1 to provide an indication of the level of generalisation that can be achieved when dealing with heterogeneous data sources.
4.3 Computation time
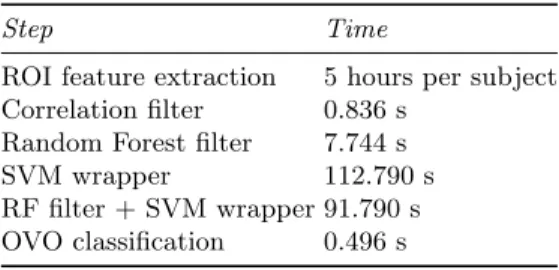
The average computation time for each stage of the proposed algorithm is re-ported in Table 2. The processing, filtering and analysis of the datasets was performed on a 2.4GHz Intel Core i7 with 8GB RAM running Mac OS X 10.7.5. Apart from the preprocessing time for the ROI features generation from MRIs, the most expensive phase of the process is the application of the SVM wrapper (119.790s). Less time is taken for the SVM wrapper applied after the RF filter (91.790s) because of the fewer number of features.
Table 2.Mean computation time for each step of the proposed approach.
Step Time
ROI feature extraction 5 hours per subject Correlation filter 0.836 s
Random Forest filter 7.744 s
SVM wrapper 112.790 s
RF filter + SVM wrapper 91.790 s OVO classification 0.496 s
5
Conclusions
The present study was designed for searching the best subsets of ROI features extracted by FreeSurfer from brain MRIs, by applying advanced methods for fea-ture selection. The main goal was to obtain the highest accuracies on three binary problems, HC vs MCI, HC vs AD and AD vs MCI so to maximize the accuracy of multi-class classification by OVO strategy. The proposed workflow sequentially applies a correlation filter, a Random Forest filter and a Support Vector Machines wrapper on the data with and without IntraCranial Volume normalization. The findings suggest that (i) ICV normalization can lead to overfitting and worse accuracy and (ii) even though the SVM wrapper is more complex and slower than the Random Forest filter, it does not provide better accuracy. However in order to provide conclusive results, a more extensive analysis is required.
One limitation of the proposed method is that the same correlation and variable importance threshold has been used for each binary problem, while, due to the subtle differences between AD and MCI, distinct values may help to improve the overall accuracy.
Thus, further work is required in order to determine the best thresholds for the correlation filter and the best variable importance value for the Random Forest filter for each binary sub-problems independently.
References
1. Frank Jessen, Steffen Wolfsgruber, Birgitt Wiese, Horst Bickel, Edelgard M¨osch, Hanna Kaduszkiewicz, Michael Pentzek, Steffi G Riedel-Heller, Tobias Luck, An-gela Fuchs, et al. Ad dementia risk in late mci, in early mci, and in subjective memory impairment. Alzheimer’s & Dementia, 10(1):76–83, 2014.
2. Yue Cui, Wei Wen, Darren M. Lipnicki, Mirza Faisal Beg, Jesse S. Jin, Suhuai Luo, Wanlin Zhu, Nicole A. Kochan, Simone Reppermund, Lin Zhuang, Pradeep Reddy Raamana, Tao Liu, Julian N. Trollor, Lei Wang, Henry Brodaty, and Permin-der S. Sachdev. Automated detection of amnestic mild cognitive impairment in community-dwelling elderly adults: A combined spatial atrophy and white matter alteration approach. NeuroImage, 59(2):1209 – 1217, 2012.
3. R´emi Cuingnet, Emilie Gerardin, J´erˆome Tessieras, Guillaume Auzias, St´ephane Leh´ericy, Marie-Odile Habert, Marie Chupin, Habib Benali, and Olivier Colliot. Automatic classification of patients with Alzheimer’s disease from structural MRI: A comparison of ten methods using the ADNI database. NeuroImage, 56(2):766 – 781, 2011. Multivariate Decoding and Brain Reading.
4. Anders M Dale, Bruce Fischl, and Martin I Sereno. Cortical surface-based analysis: I. segmentation and surface reconstruction. Neuroimage, 9(2):179–194, 1999. 5. Alessia Sarica, Giuseppe Di Fatta, and Mario Cannataro. K-Surfer: A KNIME
extension for the management and analysis of human brain MRI FreeSurfer/FSL data. In Proceedings of the International Conference on Brain Informatics and Health, Special session on Neuroimaging Data Processing Strategies, Warsaw, Poland, 11–14 August 2014, in press, LNAI. Springer.
6. Isabelle Guyon and Andr´e Elisseeff. An introduction to variable and feature selec-tion. J. Mach. Learn. Res., 3:1157–1182, March 2003.
7. Randy L Buckner, Denise Head, Jamie Parker, Anthony F Fotenos, Daniel Mar-cus, John C Morris, and Abraham Z Snyder. A unified approach for morphometric and functional data analysis in young, old, and demented adults using automated atlas-based head size normalization: reliability and validation against manual mea-surement of total intracranial volume. Neuroimage, 23(2):724–738, 2004.
8. Carsten F. Dormann, Jane Elith, Sven Bacher, Carsten Buchmann, Gudrun Carl, Gabriel Carr´e, Jaime R. Garc´ıa Marqu´ez, Bernd Gruber, Bruno Lafourcade, Pe-dro J. Leit˜ao, Tamara M¨unkem¨uller, Colin McClean, Patrick E. Osborne, Bj¨orn Reineking, Boris Schr¨oder, Andrew K. Skidmore, Damaris Zurell, and Sven Laut-enbach. Collinearity: a review of methods to deal with it and a simulation study evaluating their performance. Ecography, 36(1):27–46, 2013.
9. Isabelle Guyon, Jason Weston, Stephen Barnhill, and Vladimir Vapnik. Gene selection for cancer classification using support vector machines.Machine learning, 46(1-3):389–422, 2002.
10. Mario Cannataro, Pietro Hiram Guzzi, and Alessia Sarica. Data mining and life sciences applications on the grid. Wiley Interdisciplinary Reviews: Data Mining and Knowledge Discovery, 3(3):216–238, 2013.
11. Mikel Galar, Alberto Fern´andez, Edurne Barrenechea, Humberto Bustince, and Francisco Herrera. An overview of ensemble methods for binary classifiers in multi-class problems: Experimental study on one-vs-one and one-vs-all schemes.Pattern Recognition, 44(8):1761 – 1776, 2011.
Table 3.Results of the binary classification: training performed on D2 and accuracy estimated on D2 (D2/D2) and D1 (D2/D1). Best results on D1 are indicated in bold.
Feature selection method Corr. filter
|r|<0.90 Random Forest filter SVM wrapper Random Forest filter + SVM wrapper
ICV No ICV ICV No ICV ICV No ICV ICV No ICV
Nr. feat. D2/D2 10xval D2/D1 holdout Nr. feat. D2/D2 10xval D2/D1 holdout Nr. feat. D2/D2 10xval D2/D1 holdout Nr. feat. D2/D2 10xval D2/D1 holdout Nr. feat. D2/D2 10xval D2/D1 holdout Nr. feat. D2/D2 10xval D2/D1 holdout Nr. feat. D2/D2 10xval D2/D1 holdout Nr. feat. D2/D2 10xval D2/D1 holdout HCvsMCI133 71.4% 42.9% 140 67.9% 66.7% 71 71.4% 42.9% 41 65.7% 52.4% 133 71.4% 42.9% 140 67.9% 66.7% 30 77.1% 42.9% 41 65.7% 52.4% HCvsAD 133 90% 42.9% 140 81.4% 95.2% 109 86.4% 42.9% 95 82.1% 95.2% 133 90% 42.9% 140 81.4% 95.2% 109 86.4% 42.9% 95 82.1% 95.2% ADvsMCI133 58.6% 50% 139 58.6% 83.3% 47 60% 50% 44 62.1% 88.9% 133 58.6% 50% 139 58.6% 83.3% 47 60% 50% 44 62.1% 88.9%