See related Commentary on page 813
Comparison of Next-Generation Sequencing
Panels and Platforms for Detection and
Veri
fi
cation of Somatic Tumor Variants for
Clinical Diagnostics
Maksym Misyura,*Tong Zhang,* Mahadeo A. Sukhai,* Mariam Thomas,* Swati Garg,* Suzanne Kamel-Reid,*yzxand Tracy L. Stockley*yz
From the Advanced Molecular Diagnostics Laboratory,* Princess Margaret Cancer Centre, and the Department of Laboratory Genetics,yLaboratory
Medicine Program, University Health Network, Toronto, Ontario; and the Departments of Laboratory Medicine and Pathobiologyzand Medical Biophysics,x
University of Toronto, Toronto, Ontario, Canada
CME Accreditation Statement:This activity (“JMD 2016 CME Program in Molecular Diagnostics”) has been planned and implemented in accordance with the Essential Areas and policies of the Accreditation Council for Continuing Medical Education (ACCME) through the joint providership of the American Society for Clinical Pathology (ASCP) and the American Society for Investigative Pathology (ASIP). ASCP is accredited by the ACCME to provide continuing medical education for physicians.
The ASCP designates this journal-based CME activity (“JMD 2016 CME Program in Molecular Diagnostics”) for a maximum of 36AMA PRA Category 1 Credit(s). Physicians should claim only credit commensurate with the extent of their participation in the activity.
CME Disclosures:The authors of this article and the planning committee members and staff have no relevantfinancial relationships with commercial interests to disclose. Accepted for publication
June 3, 2016.
Address correspondence to Tracy L. Stockley, Ph.D., Genome Diagnostics, Depart-ment of Laboratory Genetics, University Health Network, 200 Elizabeth St, Room 11E-454, Toronto, ON, Canada M5G 2C4. E-mail:tracy.stockley@ uhn.ca.
Use of next-generation sequencing to detect somatic variants in DNA extracted from formalin-fixed, paraffin-embedded tumor tissues poses a challenge for clinical molecular diagnostic laboratories because of variable DNA quality and quantity, and the potential to detect low allele frequency somatic variants difficult to verify by nonenext-generation sequencing methods. We evaluated somatic variant detection performance of the MiSeq and Ion Proton benchtop sequencers using two commercially available panels, the TruSeq Amplicon Cancer Panel and the AmpliSeq Cancer Hotspot Panel Version 2. Both the MiSeq-TruSeq Amplicon Cancer Panel and Ion Proton-AmpliSeq Cancer Hotspot Panel Version 2 were comparable in terms of detection of somatic variants and allele frequency determination using DNA extracted from tumor tissue. Concordance was 100% between the panels for detection of somatic variants in genomic regions tested by both panels, including 27 variants present at low somatic allele frequency (<15%). Use of both the MiSeq and Ion Proton platforms in a combined workflow enabled detection of potentially actionable variants with importance for patient diagnosis, prognosis, or treatment in 49% (305/621) of cases. Overall, a combined workflow using both platforms enabled successful molecular profiling of 96% (621/644) of tumor samples, and provided an approach for verification of somatic variants not amenable to verification by Sanger sequencing (<15% variant allele frequency).(J Mol Diagn 2016, 18: 842e850;http://dx.doi.org/10.1016/j.jmoldx.2016.06.004)
In clinical molecular diagnostic laboratories, use of next-generation sequencing (NGS) assays for detection of somatic variants in solid tumors has great potential to improve patient diagnosis, prognosis, and treatment based on identified tu-mor variants.1 However, tumor molecular profiling by NGS remains challenging in clinical diagnostics because of the diverse types of tumor samples received by clinical
laboratories and the resultant range of nucleic acid quality and quantity derived from such samples. Most DNA samples used in clinical testing for detection of solid tumor somatic variants are obtained from formalin-fixed, paraffin-embedded (FFPE)
Supported by the Princess Margaret Cancer Foundation. Disclosures: None declared.
jmd.amjpathol.org The Journal of Molecular Diagnostics, Vol. 18, No. 6, November 2016
2016 CME
tumor tissue because of the ubiquitous use of FFPE for pa-thology review.2Quality of nucleic acid extracted from FFPE samples is adversely affected by several factors, including, but not limited to, tissue age,fixation time, and tumor size.3 Nucleic acid quantity may be limited by both tumor sam-pling method (such as fine-needle aspiration4) and tumor cellularity.1,5,6As a result, a major challenge of testing FFPE tumor samples by NGS-based assays for clinical diagnostics is ensuring that most samples can be successfully analyzed using clinically validated assays and method.
Somatic variants with impact on patient care may be pre-sent at a wide range of variant allele frequencies (0% to 100%) because of tumor heterogeneity and clonal architec-ture.7Because of the range of variant allele frequencies, and particularly the need to detect variants at low allele fre-quencies (<15%), detection of somatic variants in tumors necessitates high read depth in genomic regions of interest.8 Although NGS testing of nucleic acid extracted from tumor samples using commercially available targeted gene panels is readily accessible to clinical diagnostic laboratories, the challenges presented by varying DNA quality and quantity remain to be resolved. We addressed this challenge by describing a clinical diagnostic approach to maximize testing of FFPE tumor samples using two targeted NGS panels on different sequencing platforms using different chemistries, the TruSeq Amplicon Cancer Panel (ACP; Illumina, San Diego, CA), analyzed on the MiSeq benchtop sequencer, and the AmpliSeq Cancer Hotspot Panel Version 2 (CHP; Thermo-Fisher, San Diego, CA), analyzed on the Ion Proton benchtop sequencer. The NGS amplicon-based panels used in this study cover similar sets of genes and are commonly used in clinical molecular diagnostic laboratories for somatic variant detection in FFPE tumor samples. We demonstrate in this study that a combined workflow using both NGS panels and platforms increases diagnostic yield of low quality or low quantity DNA samples from FFPE tumor tissue. In addition, we show that the use of two NGS platforms based on inde-pendent sequencing chemistries9allows comparison of results from both NGS platforms to use as an orthogonal verification method for low allele frequency tumor somatic variants that are not amenable to verification by Sanger sequencing.
Materials and Methods
Tumor, Blood, and Cell Line Samples
The retrospective platform comparison portion of this study used DNA extracted from 53 FFPE tumor (Supplemental Figure S1) and matched blood samples (106 samples total), which were received in the laboratory (Advanced Molecular Diagnostics Laboratory, University Health Network, Toronto, ON, Canada). DNA from all 53 cases (106 samples) was analyzed using both the MiSeq-ACP (Illumina) and the Ion Proton-CHP Version 2 (ThermoFisher). Two DNA samples isolated from well-characterized HapMap cell lines, NA19878 and NA19240 (Coriell, Camden, NJ), were also tested on both
platforms. Variant calls obtained from a mixed dilution series of the NA19878 and NA19240 cell lines ranging from 1:1 to 1:99 were used to determine variant allele frequency sensitivity of the two platforms and panels. The prospective portion of this study, assessing combined workflow, included 644 consecu-tive FFPE samples received in the laboratory between October 2014 and June 2015. Of the 644 samples, DNA from 418 tumors was analyzed by the MiSeq-ACP, 179 tumor DNA samples were analyzed by the Ion Proton-CHP, 24 samples were analyzed by both assays, and 23 samples had insufficient DNA to be sequenced on either platform.
DNA Extraction and Quality Assessment
For extraction of DNA from FFPE tumor samples, hema-toxylin and eosinestained slides were prepared from FFPE tumor and reviewed by board-certified pathologists to define tumor regions and percentage of nucleated tumor cells (median, 57%; range, 10% to 99%). Tumor regions were macrodissected from 10 to 15 unstained slides for DNA extraction, or punch cores (1 to 21-mm core) taken from FFPE blocks. Collected FFPE tissue was deparaffinized using xylene, followed by protein digestion using Proteinase K, and DNA extracted using either standard phenol chlo-roform methods for FFPE samples or the QIAamp Micro kit (Qiagen, Germantown, MD).
DNA quality assessment was performed by quantitative PCR, using the FFPE QC Template Standard DNA and QC Primer Set (Illumina), with usable DNA samples having a
DCt value of <3.2. Each quantitative PCR (Invitrogen Platinum SYBR Green; ThermoFisher) was performed on the ABI 7900 Real-Time PCR machine (ThermoFisher). DNA quantity was determined by Qubit quantification using the Qubit dsDNA HS Assay Kit (ThermoFisher).
Library Preparation and Sequencing
The TruSeq ACP (Illumina) includes 212 amplicons covering regions of 48 genes and a total genomic region of 35.8 kb (Supplemental Table S1). Sixteen tumor and normal pairs (ie, 32 samples total) were multiplexed per run. Library preparation used 250 ng of DNA with the TruSeq Custom Amplicon Kit (Illumina), followed by sequencing on the MiSeq benchtop sequencing platform using the MiSeq Re-agent Kit version 2 (Illumina) with paired end sequencing with read lengths of 150 base pairs. For somatic variant detection on the MiSeq-ACP, the following quality control metrics (based on manufacturer’s recommendations) were considered optimal: cluster density of 900 to 1200 k/mm2, cluster passing filter percentage >90%, >90% of reads greater than or equal to Q30 quality score, and total output
>4 Gb (Supplemental Figure S2).
The AmpliSeq CHP Version 2 (ThermoFisher) includes 207 amplicons covering regions of 50 genes and a total genomic region of 22 kb (Supplemental Table S1). A total of 16 to 20 tumor/normal pairs (ie, 32 to 40 samples total)
were multiplexed per run. Library preparation used 10 ng of input DNA with the Ion AmpliSeq Kit Version 2.0 and AmpliSeq Cancer Panel Version 2 primers (ThermoFisher), followed by sequencing on the Ion Proton benchtop sequencing platform using the P1 chip and 111- to 184-bp read length. For somatic variant detection on the Ion Proton-CHP, the following quality control metrics (based on manufacturer’s recommendations) were considered optimal: enrichment percentage, >90%; 20% to 30% polyclonal beads; low-quality reads <20%; and overall usable reads
>55% (Supplemental Figure S3).
Data Analysis
For samples tested on the TruSeq Amplicon Cancer Panel, FASTQ outputfiles were analyzed by the MiSeq Reporter software package version 2.4 (Illumina) and uploaded to NextGENe version 2.3.1 (Softgenetics, State College, PA) for alignment to reference genome hg19 (National Center for Biotechnology Information Build 37) and variant call-ing. For samples tested on the Ion Proton, FASTQfiles were downloaded from the Torrent Suite Browser v4.4 (Ther-moFisher). Two independent software analysis programs were used for alignment to reference genome hg19 (Na-tional Center for Biotechnology Information Build 37) and variant calling: Ion Reporter software version 4.2 (Ther-moFisher) and NextGENe version 2.3.1 using default variant filter settings: one allowable mismatched base; 50 allowable ambiguous alignments; seed of 30 bases; move step offive bases; matching base85%; hidden unmatched ends; mutation percentage, 5% to 100%; and single-nucleotide polymorphism allele count of 3. The following variant calling settings were used in NextGENe: median score threshold 20, called base number of each read 25, trim or reject read 3, paired reads data, maximum of uncalled bases3, and bases with score16. Variants were filtered with exclusion of variants with a population frequency>1% in the 1000 Genomes database
(IGSR: The International Genome Sample Resource,http://
www.1000genomes.org, last accessed June 27, 2015) and
exclusion of synonymous variants. Missense variants, in-frame insertions or deletions, and in-frameshifts in the re-gions covered by each panel were included for analysis. Calls with variant allele frequency of 5% (the laboratory established limit of detection) and coverage of 500were considered to be of high enough quality to be interpreted and potentially reported. Authenticity of individual calls was manually assessed by a certified clinical laboratory technologist to exclude potential artifacts, and to ensure real calls were not missed because of poor quality (Supplemental Figure S4).
All statistical analyses were performed in the R pro-graming environment10using custom scripts. Bland-Altman analysis was performed as previously described,11and bias was calculated using the one-sample t-test with a null hypothesis of 0.
Orthogonal Methods
Orthogonal non-NGS methods used for verification of variants included Sanger sequencing, custom amplifi cation-refractory mutation system (ARMS) analysis,12custom re-striction fragment length polymorphism (RFLP) analysis,13 and/or a 279 custom laboratory-designed genotyping assay using matrix-assisted laser desorption/ionization time of
flight (MassArray, Agena Biosciences, San Diego, CA).14 Sanger sequencing was performed using a custom library of primers covering variants of interest amplified using the ProFlex PCR System (ThermoFisher), and sequenced on 3500XL Genetic Analyzer (ThermoFisher) using the Big-Dye Terminator v3.1 Cycle Sequencing Kit (ThermoFisher).
Results
Comparison of the MiSeq-ACP and the Ion Proton-CHP
Platforms
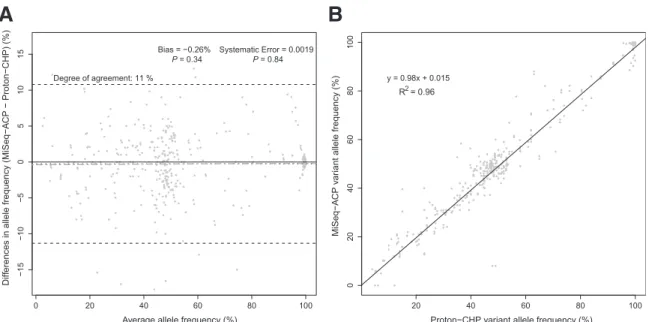
To compare variant calling results of the MiSeq-ACP to the Ion Proton-CHP, wefirst determined the bias, systematic error, and the degree of agreement between the two methods, as assessed using variant allele frequency values of 53 tumor normal pairs on both platforms. Comparison used the Bland-Altman method,11,15 a statistical analysis approach for comparing quantitative and semiquantitative methods. There was no bias or systematic error detectable, and the degree of agreement of 11% was found between the Ion Proton-CHP and the MiSeq-ACP (Figure 1A). Based on the linear regression analysis of the concordant calls made by the two platforms, the two assays demonstrated similar allele frequency measurements, as indi-cated by theR2value of 0.96 (Figure 1B). Therefore, both the MiSeq-ACP and the Ion Proton-CHP demonstrated comparable performance with respect to variant allele frequency calling.
In the context of Bland-Altman analysis, degree of agreement and bias can be used as quantitative representa-tions of precision and accuracy, respectively, provided theoretical measurements are known a priori. We determined precision and accuracy for detection of variants in the Hap-Map cell lines NA12878 and NA19240 in a dilution series, as described in Materials and Methods. The NA12878 and NA19240 samples have been extensively sequenced and documented in the GeT-RM Coordination Project (http:// www.cdc.gov/clia/Resources/GetRM, last accessed August 20, 2014), with information on high-quality variants (defined by GeT-RM as having been identified using two distinct technologies) available for use in comparisons. Using Bland-Altman analysis, the precision of variant allele frequency calling was comparable between the MiSeq-ACP and the Ion Proton-CHP, with differences from expected of4.4% and
8.7% for the MiSeq-ACP and the Ion Proton-CHP, respectively, based on cell line dilution series results (Supplemental Figure S5). The accuracy of both platforms was also comparable, as indicated by the calls made by the MiSeq-ACP and the Ion Proton-CHP being 1.7% and 0.41%
away from the reference values, respectively, as calculated from the dilution series (Supplemental Figure S5).
Detection and Veri
fi
cation of Somatic Variants by
MiSeq-ACP and Ion Proton-CHP
Orthogonal methods used to verify variant results from NGS included Sanger sequencing and laboratory-developed as-says, including a custom matrix-assisted laser desorption/ ionization time-of-flight recurrent mutation genotyping assay for 279 variants (MassArray, Agena Biosciences), and custom ARMS and RFLP assays for individual recurrent mutations. Verification of variants from NGS-based assays using orthogonal methods presents challenges because of limited regions or mutations tested by certain orthogonal methods and the need for verification of somatic variants at low allele frequencies in tumors, which is difficult to ach-ieve below 10% to 15% allele frequency by methods such as Sanger sequencing. Because of these limitations, variants used to evaluate somatic variant detection for the MiSeq-ACP and the Ion Proton-CHP were subdivided into two subgroups based on variant allele frequency, a low allele frequency subgroup (5% to 15% allele frequency) and a high allele frequency subgroup (>15% allele frequency). Only variants potentially useful for drug treatment decisions and prognosis were verified in this study.
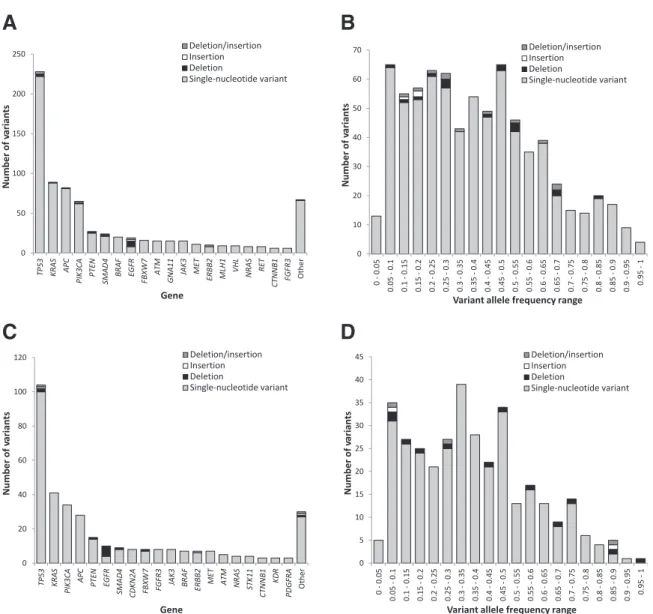
Detection of somatic variants by the MiSeq-ACP was evaluated based on 749 variants detected in DNA extracted from 442 FFPE samples. Variants were distributed across a range of variant allele frequencies and genes (Figure 2, A and B). Variants detected included single-nucleotide vari-ants (n Z 719) and small insertions and/or deletions (n Z30) (Figure 2A), with 133 variants falling in the low allele frequency subgroup (5% to 15% allele frequency) and
616 in the high allele frequency subgroup (>15% allele frequency) (Figure 2B). For verification by non-NGS orthogonal methods, 39 low allele frequency variants and 33 high allele frequency variants were selected. All 33 high allele frequency variants detected by the MiSeq-ACP were successfully confirmed by an orthogonal method, but only 34 (87%) of 39 low allele frequency variants detected by the MiSeq-ACP were able to be confirmed by a non-NGS orthogonal method (Table 1).
Similarly, detection of somatic variants by the Ion Proton-CHP was evaluated based on 346 variants detected in DNA extracted from 204 FFPE samples. Variants were distributed across a range of variant allele frequencies and genes (Figure 2, C and D). Variants detected included single-nucleotide variants (n Z 329) and small insertions and/or deletions (n Z17) (Figure 2C), with 67 variants falling in the low allele frequency subgroup (<15% allele frequency) and 279 in the high allele frequency subgroup (>15% allele frequency) (Figure 2C). For verification by non-NGS orthogonal methods, 26 low allele frequency variants and 22 high allele frequency variants were selected. All 22 high allele frequency variants detected by the Ion Proton-CHP were confirmed by an orthogonal method; however, only 23 (88%) of 26 low allele frequency variants detected by the Ion Proton-CHP were confirmed using non-NGS orthogonal methods (Table 1).
The availability of two independent NGS-based plat-forms made it possible for us to compare the ability of an alternative NGS platform to act as an orthogonal method for verification of somatic variants detected at low variant allele frequency levels in tumor tissue (5% to 15% variant allele frequency) by the initial NGS platform. We performed this comparison using a retrospective set of 53 normal tumor pairs (106 samples) with 190 variants tested by both NGS
0 20 40 60 80 100 − 15 − 10 − 50 5 10 15
Average allele frequency (%)
Diff
erences in allele frequency (MiSeq
− A CP − Proton − CHP) (%) Degree of agreement: 11 % Bias = −0.26% P = 0.34 Systematic Error = 0.0019P = 0.84
A
20 40 60 80 100 0 204 06 08 0 10 0Proton−CHP variant allele frequency (%)
MiSeq
−
A
CP v
ar
iant allele frequency (%)
B
y = 0.98x + 0.015 R2 = 0.96
Figure 1 Variant allele frequency detection between the Ion Proton-Cancer Hotspot Panel (CHP) and the MiSeq-Amplicon Cancer Panel (ACP) was compared according to Bland-Altman (A) and linear regression (B) analyses of concordant calls. The values for degree of agreement (black dashed lines), bias (black dotted line), and systematic error (gray line) are shown, including thePvalues for the presence of bias and systematic error.
platforms, including 27 low and 163 high allele frequency variants (Table 1). In comparison of high allele frequency variants with variant allele frequency >15%, 100% (nZ163) of variants were detected by both NGS platforms (Table 1), identical to the verification rate by non-NGS orthogonal methods for high allele frequency variants.
However, the confirmation rate of 27 low allele frequency variants (5% to 15%) was also 100% based on the results from the two NGS platforms, in contrast to results of verification by non-NGS orthogonal methods where the rate was 87% to 88% for variants between 5% and 15% variant allele frequency. The two NGS platforms were able to
Table 1 Concordance of Variant Detection between NGS and Non-NGS Orthogonal Methods, for Variants Detected at Low or High Variant Allele Frequencies
Variant allele frequency Orthogonal*/MiSeq-ACPy Orthogonal/Proton-CHPy MiSeq-ACP/Proton-CHPy
5%e15% 34/39 (87) 23/26 (88) 27/27 (100)
>15% 33/33 (100) 22/22 (100) 163/163 (100)
*Orthogonal methods included amplification-refractory mutation system, restriction fragment length polymorphism, or a custom matrix-assisted laser desorption/ionization time-of-flight panel (seeMaterials and Methods).
yFractions represent number of variants confirmed by an orthogonal method/the total number of variants detected by NGS and tested by orthogonal
methods. Percentages are given in parentheses.
ACP, Amplicon Cancer Panel; CHP, Cancer Hotspot Panel Version 2; NGS, next-generation sequencing.
0 50 100 150 200 250 TP53 KRAS APC PI K3CA PTEN SMAD4 BR AF EGF R FBXW 7 AT M GNA11 JAK 3 MET ERBB 2 MLH1 VHL NR AS RET CTNN B1 FGFR3 Oth er Number of va rian ts Gene Deletion/insertion Insertion Deletion Single-nucleotide variant 0 10 20 30 40 50 60 70 0 - 0. 05 0.05 - 0.1 0.1 - 0.15 0.15 - 0.2 0.2 - 0.25 0.25 - 0.3 0.3 - 0.35 0.35 - 0.4 0.4 - 0.45 0.45 - 0.5 0.5 - 0.55 0.55 - 0.6 0.6 - 0.65 0.65 - 0.7 0.7 - 0.75 0.75 - 0.8 0.8 - 0.85 0.85 - 0.9 0.9 - 0.95 0.95 - 1 Number of va rian ts
Variant allele frequency range
Deletion/insertion Insertion Deletion Single-nucleotide variant 0 20 40 60 80 100 120 TP53 KRA S PIK
3CA APC PTEN EGFR
SMAD4 CDKN2A FBXW 7 FGFR3 JAK 3 BR AF ERBB2 MET AT M NR AS ST K11 CTNN B1 KDR PDGFRA Oth er Number of va rian ts Gene Deletion/insertion Insertion Deletion Single-nucleotide variant 0 5 10 15 20 25 30 35 40 45 0 - 0. 05 0.05 - 0.1 0.1 - 0.15 0.15 - 0.2 0.2 - 0.25 0.25 - 0.3 0.3 - 0.35 0.35 - 0.4 0.4 - 0.45 0.45 - 0.5 0.5 - 0.55 0.55 - 0.6 0.6 - 0.65 0.65 - 0.7 0.7 - 0.75 0.75 - 0.8 0.8 - 0.85 0.85 - 0.9 0.9 - 0.95 0.95 - 1 Number of va rian ts
Variant allele frequency range
Deletion/insertion Insertion Deletion Single-nucleotide variant
A
B
D
C
Figure 2 A total of 749 and 346 variants detected by the MiSeq-Amplicon Cancer Panel (AandB) and the Ion Proton-Cancer Hotspot Panel (CandD) were distributed across a range of genes and variant allele frequencies. Variants listed as other were detected in one of the following genes:RET,AKT1,CDH1,ERBB4,GNA11, IDH2,KIT,MLH1,NOTCH1,RB1,ABL1,FGFR2,HRAS,IDH1,MPL,SMARCB1,SMO,GNAQ,STK11,CSF1R,FLT3,KDR,PDGFRA,FGFR1,HNF1A,PTPN11, andSMAD4.
detect and verify variants as low as 5% variant allele fre-quency by concordance between the two platforms. Furthermore, the two NGS platforms also demonstrated 100% concordance for 38 previously tested negative sam-ples (data not shown), indicating that no platform-specific false-positive variants were identified down to 5% variant allele frequencies when comparing variant results between the two platforms.
Integration of Ion Proton-CHP and MiSeq-ACP into a
Single Work
fl
ow Using DNA Quality and Quantity of
Clinical Samples
Variation in extracted nucleic acid quality and quantity from FFPE tumor samples is a major challenge faced by clinical diagnostics laboratories using NGS to detect somatic vari-ants. Sample age and storage conditions have a significant effect on extracted DNA quality and quantity and affect suitability for analytic methods,1,5,6 and yet are typically outside the purview of the clinical laboratory receiving such samples for analyses. In addition, the tumor size and nucleated tumor cell content (tumor cellularity) in FFPE regions from which DNA is extracted affect the somatic variant allele frequency in analyses. To manage this
variability and to optimize NGS testing for DNA derived from FFPE samples, we developed a single workflow combining both MiSeq (Illumina) and Ion Proton (Ther-moFisher) NGS sequencing platforms to maximize data quality and increase the overall diagnostic yield from FFPE samples for tumor profiling (Figure 3). In our workflow, samples were stratified according to quantity before the quality assessment. Because of a lower acceptable limit of DNA quantity and quality suitable for testing on the Ion Proton, very low quantity samples (1 to 10 ng/mL) and low quantity samples (10 to 40 ng/mL), or high quantity samples (>40 ng/mL) with low quality values (quantitative PCRDCt
>3.2) are able to be tested by the Ion Proton-CHP. Of the 644 consecutive FFPE samples received during this study, 23 had insufficient DNA for testing by either platform. Of the remaining 621 samples, 442 met DNA quality/quantity criteria for testing by the MiSeq-ACP. The remaining 179 samples did not meet DNA quality/quantity criteria for the MiSeq-ACP but were successfully sequenced using the Ion Proton-CHP. In addition, 24 samples that met quality and quantity criteria for testing by the MiSeq-ACP but yielded inconclusive results were also repeated successfully on the Ion Proton-CHP. Therefore, inclusion of both the MiSeq-ACP and Ion Proton-CHP into an integrated workflow
All FFPE samples (n = 644) Insufficient DNA (n = 23) High DNA quanty* (n = 463) Low DNA quanty† (n = 74)
Very low DNA quanty‡(n = 84) Low quality§ (n = 27) High quality ¶ (n = 436) High quality¶ (n = 6) Low quality§ (n = 68) MiSeq (n = 442) Sample successful (n = 418) Sample inconclusive (n = 24) Insufficient sample (n = 23) Proton (n = 203) DNA quan ty Sequencing DNA quality
Figure 3 Integration of the MiSeq-Amplicon Cancer Panel (ACP) and the Ion Proton-Cancer Hotspot Panel (CHP) sequencing platforms into a single workflow. Four hundred forty-two samples were sequenced by the MiSeq-ACP. Two hundred three cases were sequenced by the Ion Proton-CHP because of low quantity and/or quality, including 24 samples that yielded inconclusive results by the MiSeq-ACP because of borderline quality and/or quantity. DNA quantity:
allowed successful analysis of 96% (621 of 644) FFPE tumor samples.
Clinical Impact of the Combined MiSeq-ACP and Ion
Proton-CHP Work
fl
ow
To demonstrate the impact on clinical significance and diagnostic yield from use of an integrated workflow with two NGS platforms for FFPE tumor profiling, the variants detected by the combined workflow were interpreted for clinical significance, as described by Sukhai et al.16 Poten-tial actionability of variants was determined based on prognostic, diagnostic, predictive, or therapeutic informa-tion conferred by those variants at the primary tumor site provided. Overall, 380 potentially actionable variants (ie, variant classes 1, 2, and 3A, as per Sukhai et al16) were detected on the combined workflow, with 211 of 442 samples sequenced by the MiSeq-ACP containing 258 potentially actionable variants, and 94 of 203 samples sequenced by the Ion Proton-CHP containing 122 poten-tially actionable variants (Table 2). Overall, the combined workflow detected at least one potentially actionable somatic variant in 49% (305 of 621 samples) of tested FFPE tumor samples.
Discussion
We evaluated the combined use of two targeted NGS gene panels of similar gene content, designed for molecular profiling of solid tumors, to detect variants of clinical importance for oncology: the 50-gene CHP designed for the ThermoFisher (Ion Torrent PGM, Ion Proton) benchtop sequencers and the 48-gene ACP designed for the Illumina (MiSeq, NextSeq 500) benchtop sequencers. Both NGS panels and platforms as used in this study demonstrated comparable performance in detection of somatic variants from DNA samples extracted from FFPE tissue across multiple genes and a wide range of variant allele
frequencies. This comparability information is useful for clinical laboratories considering choice of NGS platforms and making decisions about implementing NGS for somatic variant testing, as most clinical diagnostic laboratories validate and use only one NGS platform because of work-load and cost demands to maintain more than one NGS platform in a clinical diagnostic laboratory setting.
In our laboratory, we first established the 48-gene ACP on the Illumina sequencers as our primary somatic tumor molecular profiling assay, and for this historical reason used the Illumina ACP assay as the primary test in our combined workflow (Figure 3). Our laboratory subsequently estab-lished the 50-gene CHP on the ThermoFisher sequencers, specifically to meet the need to test samples with lower DNA quality and quantity, as described inResults. Because the library preparation without automation and data analysis steps of the Ion Proton-CHP platform were more labor intensive than the MiSeq-ACP (Supplemental Table S2and
Supplemental Figure S4), high quality/quantity samples in this study werefirst sequenced using the MiSeq-ACP, with the Ion Proton-CHP used for reflex testing. Although most clinical laboratories may not establish and maintain two NGS platforms, there are insights from our study that are relevant to clinical somatic variant analysis. The combined workflow using the two NGS panels/platforms maximized clinical impact of tumor molecular profiling by managing potential limitations in quantity and quality of DNA extracted from FFPE tissue samples received for routine molecular diagnostic testing. As well, the availability of two NGS platforms using independent sequencing chemistries was useful for variant confirmation in cases with multiple variants, and for validation of large panels where single-gene orthogonal testing methods are not available or are prohibitively costly. In addition, use of two similar NGS panels on different sequencing platforms enabled verifi ca-tion of 100% (n Z 27) potentially clinically important somatic variants in the 5% to 15% variant allele frequency range, which were problematic to verify by non-NGS methods, such as Sanger sequencing.17
Orthogonal methods, such as Sanger sequencing, are often used to verify a discordant result; however, the dif-ferences in bioinformatics algorithms are often ignored as a source of discrepancies. For the Ion CHP-Proton platform, using two separate bioinformatics analyses (Ion Reporter, NextGENe) to ensure high quality of data was determined to be necessary at the expense of increasing the overall post-sequencing results review time and cost (Supplemental
Figure S4). The data for each run were examined by a
certified technologist before interpretation of results to identify potential artifacts, and to ensure real calls of lower quality were not missed (Supplemental Figure S4). As a result of manual review, the decision to use NextGENe as an independent bioinformatics pipeline was made to resolve minor differences between the bioinformatics pipelines. The presence of low-frequency (<10% variant allele frequency) deletions and insertions in the homopolymer regions was
Table 2 Summary of Variants, Including Potential Actionability, Detected by the MiSeq-ACP and the Proton-CHP
Variable
Test method
MiSeq-ACP Proton-CHP Total Total samples sequenced 442 203 621* Samples with potentially
actionable variants (classes 1e3A)
211 94 305
Total No. of variants by class
Class 1 103 52 155 Class 2 76 32 108 Class 3A 79 38 117 Other 245 110 355
*Twenty-four samples that failed or yielded inconclusive results on the MiSeq-ACP were successfully sequenced on the Ion Proton-CHP.
evident in the Ion CHP-Proton data analyzed by NextGENe. Interestingly, the same issue was not observed using the stock Ion Reporter bioinformatics pipeline. As noted in another validation study,18the newer versions of the stock Thermo Life bioinformatics pipeline are able to overcome calling spurious homopolymer insertions/deletions. Using two bioinformatics pipelines was necessary to ensure correct calling of insertions/deletions by the Ion CHP-Proton platform.
Based on our data, DNA extracted from 28% (nZ179 of 644) of FFPE samples did not meet quality and quantity re-quirements to be analyzed using the MiSeq-ACP. The addi-tion of the Ion Proton-CHP to the workflow allowed our laboratory to obtain potentially clinically important infor-mation from additional 15% (nZ94) of samples received for analysis by NGS. Furthermore, 4% (nZ24) of samples that yielded inconclusive results on the MiSeq-ACP because of low quality and/or quantity of DNA were successfully sequenced on the Ion Proton-CHP (Figure 3). Recently, a new system for sequencing on the Illumina platform, the TruSeq Nano DNA Library Preparation Kit and the NeoPrep System, has been developed to enable testing of low quantity DNA samples on the Illumina NGS platform19; however, these re-agents were not available at the time of this study.
Orthogonal testing is crucial for clinical diagnostic lab-oratories because it allows one to provide variant verifi ca-tion for validaca-tion studies and it is used in situaca-tions where the technical performance of a particular NGS test may not be sufficient to confidently report the final result without confirmation.20 For tumor molecular profiling by NGS methods, this is particularly important for somatic variants that occur at low levels in the tumor tissue (defined in this study as <15% allele frequency). Since potentially impor-tant variants can be present at low variant allele frequencies because of tumor heterogeneity and low tumor cellu-larity,21,22robust detection of such variants is essential in a diagnostic setting. Sufficiently sensitive methods of somatic variant detection, such as ARMS12 and RFLP,13 may be available for recurrent mutation hot spot locations, such as
BRAF V60012 and KRAS G12,13 but do not have the genomic region coverage capability of Sanger sequencing. However, use of Sanger sequencing for verification of somatic variants is restricted by a lower limit of variant detection of approximately 10% to 15% allele frequency. Since the Ion Proton-CHP and MiSeq-ACP combinations use independent sequencing chemistries,9one of these two sequencing platforms can be considered as an alternative orthogonal method of variant confirmation for variants identified by the other NGS platform. For example, variants present at low levels in somatic tissue, for which more sensitive orthogonal methods (ARMS and RFLP) are not readily available, can be confirmed by an alternative inde-pendent NGS platform. Furthermore, this approach allows for confirmation of cases with multiple variants or validation of large panels also not easily achieved using single-mutation tests or Sanger sequencing.
Our results are in agreement with previous findings regarding comparable performance of different NGS assays and platforms. Several previous studies examined the performance of multiple NGS platforms across a diverse set of applications and found that sequence tech-nologies manufactured by ThermoFisher and Illumina produce comparable results.23e26 Sequencing platforms from both ThermoFisher and Illumina have been evaluated for potential uses in clinical microbiology,23 germline variant detection,25 and prenatal testing.26,27 Our results now provide evidence that both the MiSeq and Ion Proton can be reliably used in an integrated workflow in a clinical diagnostic setting for somatic variant detection and
veri-fication of low-level somatic variants on DNA extracted from FFPE tumor samples.
Conclusions
The MiSeq and the Ion Proton sequencing platforms showed equal performance in detection of somatic variants in DNA derived from FFPE tumor samples using amplicon-based commercial panels (ACP and CHP, respectively). The Ion Proton-CHP was able to analyze low quantity/quality DNA samples not suitable for sequencing on the MiSeq-ACP. Overall in the clinical molecular diagnostic laboratory setting, the combination of both NGS platforms allowed successful analysis of 96% of DNA samples extracted from FFPE samples while maximizing data quality and detection of actionable somatic variants for patient prognosis, treat-ment, and management. Furthermore, use of two NGS platforms allowed verification of multiple somatic variants lower than the threshold for verification by Sanger sequencing (<15% somatic allele frequency). Our data thus confirm comparability of NGS platforms with different chemistries, the utility of comparison of data from two NGS platforms for variant verification during assay validation, and allowingflexibility in testing of suboptimal material and verification of multiple variants of low allelic frequency for somatic testing.
Acknowledgment
We thank the Princess Margaret Cancer Foundation for research support.
Supplemental Data
Supplemental material for this article can be found at
http://dx.doi.org/10.1016/j.jmoldx.2016.06.004.
References
1. Meldrum C, Doyle MA, Tothill RW: Next-generation sequencing for cancer diagnostics: a practical perspective. Clin Biochem Rev 2011, 32:177
2. Cree IA, Deans Z, Ligtenberg MJL, Normanno N, Edsjö A, Rouleau E, Solé F, Thunnissen E, Timens W, Schuuring E, Dequeker E, Murray S, Dietel M, Groenen P, Van Krieken JH; Eu-ropean Society of Pathology Task Force on Quality Assurance in Molecular Pathology, Royal College of Pathologists: Guidance for laboratories performing molecular pathology for cancer patients. J Clin Pathol 2014, 67:923e931
3. Simon R, Roychowdhury S: Implementing personalized cancer geno-mics in clinical trials. Nat Rev Drug Discov 2013, 12:358e369 4. Kizys MM, Cardoso MG, Lindsey SC, Harada MY, Soares FA,
Melo MCC, Montoya MZ, Kasamatsu TS, Kunii IS, Giannocco G: Optimizing nucleic acid extraction from thyroidfine-needle aspiration cells in stained slides, formalin-fixed/paraffin-embedded tissues, and long-term stored blood samples. Arq Bras Endocrinol Metabol 2012, 56:618e626
5. Bennett NC, Farah CS: Next-generation sequencing in clinical oncology: next steps towards clinical validation. Cancers 2014, 6:2296e2312 6. Ulahannan D, Kovac M, Mulholland P, Cazier J, Tomlinson I:
Tech-nical and implementation issues in using next-generation sequencing of cancers in clinical practice. Br J Cancer 2013, 109:827e835 7. Ding L, Ley TJ, Larson DE, Miller CA, Koboldt DC, Welch JS,
Ritchey JK, Young MA, Lamprecht T, McLellan MD: Clonal evolu-tion in relapsed acute myeloid leukaemia revealed by whole-genome sequencing. Nature 2012, 481:506e510
8. Ding L, Wendl MC, McMichael JF, Raphael BJ: Expanding the computational toolbox for mining cancer genomes. Nat Rev Genet 2014, 15:556e570
9. Mardis ER: Next-generation sequencing platforms. Annu Rev Anal Chem 2013, 6:287e303
10. Team RC: R: A Language and Environment for Statistical Computing. Vienna, Austria:, R Foundation for Statistical Computing, 2012. ISBN 3-900051-07-0, 2014
11. Martin Bland J, Altman D: Statistical methods for assessing agreement between two methods of clinical measurement. Lancet 1986, 327: 307e310
12. Newton C, Graham A, Heptinstall L, Powell S, Summers C, Kalsheker N, Smith J, Markham A: Analysis of any point mutation in DNA: the amplification refractory mutation system (ARMS). Nucleic Acids Res 1989, 17:2503e2516
13. Lievre A, Bachet JB, Le Corre D, Boige V, Landi B, Emile JF, Côté JF, Tomasic G, Penna C, Ducreux M: KRAS mutation status is predictive of response to cetuximab therapy in colorectal cancer. Cancer Res 2006, 66:3992e3995
14. Thomas RK, Baker AC, DeBiasi RM, Winckler W, LaFramboise T, Lin WM, et al: High-throughput oncogene mutation profiling in human cancer. Nat Genet 2007, 39:347e351
15. Bland JM, Altman DG: Comparing methods of measurement: why plotting difference against standard method is misleading. Lancet 1995, 346:1085e1087
16. Sukhai MA, Craddock KJ, Thomas M, Hansen AR, Zhang T, Siu L, Bedard P, Stockley TL, Kamel-Reid S: A classification system for
clinical relevance of somatic variants identified in molecular profiling of cancer. Genet Med 2016, 18:128e136
17. Tsiatis AC, Norris-Kirby A, Rich RG, Hafez MJ, Gocke CD, Eshleman JR, Murphy KM: Comparison of Sanger sequencing, pyrosequencing, and melting curve analysis for the detection of KRAS mutations: diagnostic and clinical implications. J Mol Diagn 2010, 12: 425e432
18. Singh RR, Patel KP, Routbort MJ, Reddy NG, Barkoh BA, Handal B, Kanagal-Shamanna R, Greaves WO, Medeiros J, Aldape KD, Luthra R: Clinical validation of a next-generation sequencing screen for mutational hotspots in 46 cancer-related genes. J Mol Diagn 2013, 15:607e622
19. Gleeson FC, Kipp BR, Kerr SE, Voss JS, Graham RP, Campion MB, Minot DM, Tu ZJ, Klee EW, Lazaridis KN: Kinase genotype analysis of gastric gastrointestinal stromal tumor cytology samples using targeted next-generation sequencing. Clin Gastroenterol Hepatol 2015, 13:202e206
20. Choffnes ER, Sparling PF, Hamburg MA, Lemon SM, Mack A: Global Infectious Disease Surveillance and Detection: Assessing the ChallengeseFinding Solutions, Workshop Summary. Washington, DC, National Academies Press, 2007
21. Walter MJ, Shen D, Ding L, Shao J, Koboldt DC, Chen K, Larson DE, McLellan MD, Dooling D, Abbott R, Fulton R, Magrini V, Schmidt H, Kalicki-Veizer J, O’Laughlin M, Fan X, Grillot M, Witowski S, Heath S, Frater JL, Eades W, Tomasson M, Westervelt P, DiPersio JF, Link DC, Mardis ER, Ley TJ, Wilson RK, Graubert TA: Clonal architecture of secondary acute myeloid leukemia. N Engl J Med 2012, 366:1090e1098
22. Park SY, Gönen M, Kim HJ, Michor F, Polyak K: Cellular and genetic diversity in the progression of in situ human breast carcinomas to an invasive phenotype. J Clin Invest 2010, 120:636e644
23. Loman NJ, Misra RV, Dallman TJ, Constantinidou C, Gharbia SE, Wain J, Pallen MJ: Performance comparison of benchtop high-throughput sequencing platforms. Nat Biotechnol 2012, 30:434e439 24. Quail MA, Smith M, Coupland P, Otto TD, Harris SR, Connor TR,
Bertoni A, Swerdlow HP, Gu Y: A tale of three next generation sequencing platforms: comparison of Ion Torrent, Pacific Biosciences and Illumina MiSeq sequencers. BMC Genomics 2012, 13:341 25. Boland J, Chung C, Roberson D, Mitchell J, Zhang X, Im K, He J,
Chanock S, Yeager M, Dean M: The new sequencer on the block: comparison of Life Technology’s Proton sequencer to an Illumina HiSeq for whole-exome sequencing. Hum Genet 2013, 132: 1153e1163
26. Chen S, Li S, Xie W, Li X, Zhang C, Jiang H, Zheng J, Pan X, Zheng H, Liu JS: Performance comparison between rapid sequencing platforms for ultra-low coverage sequencing strategy. PLoS One 2014, 9:e92192
27. Jeon YJ, Zhou Y, Li Y, Guo Q, Chen J, Quan S, Zhang A, Zheng H, Zhu X, Lin J: The feasibility study of non-invasive fetal trisomy 18 and 21 detection with semiconductor sequencing platform. PLoS One 2014, 9:e110240