Durham Research Online
Deposited in DRO:
13 July 2016
Version of attached le:
Accepted Version
Peer-review status of attached le:
Peer-reviewed
Citation for published item:
Watson, Christopher and Li, Frederick W. B. and Godwin, Jamie L. (2013) 'Predicting performance in an introductory programming course by logging and analyzing student programming behaviour.', in Proceedings of the 2013 IEEE 13th International Conference on Advanced Learning Technologies (ICALT 2013).
Piscataway, NJ: IEEE Computer Society, pp. 319-323.
Further information on publisher's website:
http://dx.doi.org/10.1109/ICALT.2013.99Publisher's copyright statement: c
2013 IEEE. Personal use of this material is permitted. Permission from IEEE must be obtained for all other uses, in
any current or future media, including reprinting/republishing this material for advertising or promotional purposes, creating new collective works, for resale or redistribution to servers or lists, or reuse of any copyrighted component of this work in other works.
Additional information: Outstanding Paper Award.
Use policy
The full-text may be used and/or reproduced, and given to third parties in any format or medium, without prior permission or charge, for personal research or study, educational, or not-for-prot purposes provided that:
• a full bibliographic reference is made to the original source
• alinkis made to the metadata record in DRO
• the full-text is not changed in any way
The full-text must not be sold in any format or medium without the formal permission of the copyright holders. Please consult thefull DRO policyfor further details.
Durham University Library, Stockton Road, Durham DH1 3LY, United Kingdom Tel : +44 (0)191 334 3042 | Fax : +44 (0)191 334 2971
Predicting Performance in an Introductory Programming Course
by Logging and Analyzing Student Programming Behavior
Christopher Watson, Frederick W.B. Li and Jamie L. Godwin
School of Engineering and Computing Sciences University of Durham
Durham, United Kingdom
{christopher.watson, frederick.li, j.l.godwin}@durham.ac.uk
Abstract— The high failure rates of many programming courses means there is a need to identify struggling students as early as possible. Prior research has focused upon using a set of tests to assess the use of a student’s demographic, psychological
and cognitive traits as predictors of performance. But these traits are static in nature, and therefore fail to encapsulate changes in a student’s learning progress over the duration of a course. In this paper we present a new approach for predicting
a student’s performance in a programming course, based upon analyzing directly logged data, describing various aspects of their ordinary programming behavior. An evaluation using data logged from a sample of 45 programming students at our University, showed that our approach was an excellent early predictor of performance, explaining 42.49% of the variance in coursework marks – double the explanatory power when compared to the closest related technique in the literature.
Keywords- Learning Analytics, Prediction, CS1, Behavior.
I. INTRODUCTION
Due to a reputation for high failure rates [1], predicting a
student’s performance in a first programming course is a well studied problem, and over the past fifty years, various predictors have been proposed. Early work mainly used standardized aptitude tests to predict performance [2]. As programming became more widespread, researchers (1980-90) began to explore a greater range of cognitive [3], psychological [4], and demographic [5] predictors. Researchers over the past two decades (1990-2010) extended prior work by exploring similar factors [6][7] and the predictive potential of new innovations in pedagogy [8][9].
However a limitation of studies to date is their tendency to use lengthy tests that often yield inconsistent results. Given potentially high enrollment numbers, the use of tests to gather predictive data can take a considerable amount of time for an instructor to process. Even if a test was indicative of performance, by the time it was processed, it may be too late for students to withdraw, or for instructors to intervene to prevent students from failing [7]. The criteria used for prediction is the main limitation of prior studies. Whilst cognitive, psychological, behavioral, or demographic traits may be indicative of performance, they are not directly related to the regular programming behavior of a student, or the programming tasks which they are required to perform. Because of these reasons, the indirect criteria used by prior studies fails to reflect changes in the learning progress and/or the learning behavior of a student over time.
There is a need to explore new predictors of performance, which are not based upon indirect criteria, but are instead based upon criteria which can be automatically measured, and directly reflect changes in a student’s learning progress.
As well as being able to identify weaker students, such predictors could be used to drive an expert system [10][11] –
providing weaker students with appropriate pedagogical interventions when required. A suitable measure could be based upon profiling a student by logging data describing various aspects of their ordinary programming behavior. Whilst recent research has provided visualizations of such data to instructors so that a manual intervention could be made [12], only [13] has attempted to collectively quantify several aspects of programming behavior into a predictor of performance. Jadud [13] proposes an algorithm called the Error Quotient (EQ) (revised in [14]). The algorithm uses a scoring function based upon the amount of errors a student encountered and how successive compilation failures in a session compare in terms of error message, location, and edit location. An overall score (range 0-1) for a student's performance during a session is computed by averaging the score of a set of successive compilation events. Higher EQ is indicative of weaker students. Although previously used by several studies [11][15][16], the EQ was shown to be a weak predictor of performance. This could be due to several methodological flaws concerning the incompleteness and inaccuracy of the approach, which we attempt to address and expand upon in our work (Sec. V). Our contributions include x A unique approach for predicting performance based
upon how a student responds to different types of error compared to their peers (proposing time as a predictor). x A substantial improvement in terms of explanatory
power and predictive accuracy by addressing the shortcomings of the main related approach [13][14].
II. ABOUT THE DATASET USED INTHIS STUDY
To explore possible predictors of achievement, we used a sample of students who studied the 2012/2013 Introduction to Programming (IP) course at our university. Programming behavior was directly logged by using an extension for the BlueJ IDE. Each time a student compiled their code on a university PC the extension would log a snapshot of their program source code along with the event type (success or fail), timestamp, error message reported and line number if applicable. Similar data was collected for invocations. As the use of final exams has been criticized as a means to
accurately measure programming ability [9], we use a student's overall coursework mark as the reference criterion of this study. This consisted of a weighting of their marks on a mid-term exam (25%), project (25%), practical exam (40%), and weekly lab exercises (10%).
A total of 45 students (42 male) provided us with consent to use their logged data. 7 students indicated they had prior programming experience, but the majority indicated that the longest program they had written prior to course commencement was a medium length program (<2000 lines). Although data was logged over the duration of the course, due to the nature of student assignment work which involved intentionally propagating errors into source code, we restrict our analysis to the data gathered from 14 sessions (Term 1: weeks 3-9, Term 2: weeks 12-18).
III. THE WATWIN ALGORITHM
The uniqueness of our algorithm is to incorporate a scoring approach, where a student is relatively penalized based upon the amount of time that they take to resolve a specific type of error, compared to the resolve times of their peers. In the first stage of our algorithm, logged programming behavior is used to construct a set of successive compilation-event
pairings, so that a student’s responses to different errors can
be analyzed. This requires constructing consecutive pairings for each file that a student has attempted to compile, and estimating the amount of time a student has spent working on an error. In the second stage, each pairing is scored by assigning penalties based upon aspects of behavior which previous and our own research has identified as indicative of weaker performing students. Our algorithm is outlined as:
Input: A set of student programming logs (compilation and invocation) for all files a student compiled during a session.
1. Prepare a set of compilation parings using the process presented in Sec. III (A).
2. Quantify Programming Behavior
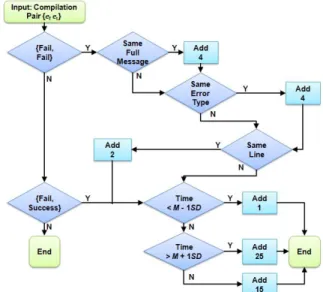
- Score each compilation pairing produced from (1) by using the scoring algorithm (Fig. 1).
- Normalize each score by dividing by 35 (the maximum possible score for each pairing).
- Average the normalized scores of all pairings.
Output: The mean average of all pairings (in the range 0-1),
which is taken as the student’s Watwin score for the session. A score of 0 indicates that the student encounters no errors over a session. A score of 1 indicates that every compilation ended in an error, and that the student spent substantially
longer than their peer’s between successive compilation
events. The closer the score is to 0, the stronger the student.
A. Preparing a Set of Compilation Pairings
1) Pair Construction.For each file that a student attempted to compile during a session first construct a tuple of pairings {{e1,e2}, {e2,e3},...,{en-1,en}}, using the compilation events
associated with a file, ordered by timestamp. A naïve way to construct pairings would be to use the natural order that events occurred during a session. But this would fail to take
into account the possibility of a student working on multiple files simultaneously, and can lead to an inaccurate representation of their programming behavior. For example, in a pairing {ef,et} where ef and et represent compilations of
two distinct files, if the event type of ef was ‘fail’ and the
type of etwas ‘success’, then the pairing {ef, et} would
incorrectly convey the student resolved the error ofef.
2) Pair Pruning. Identify and remove all pairings {ef,et}
where the code snapshots of ef and etare identical. These
cases can be caused by a ‘compile project’ feature of development software, and can artificially inflate the total number of compilation pairings. To take into account superficial changes which may have been made between compilations, such as adding comments or modifying layout, we first remove comments from the snapshots of ef
and et by using a regex expression. A standardized layout is
then applied to the snapshots and compared for a match. If the snapshots are identical then {ef, et} is removed. Also
remove pairings where the event type of efwas ‘success’.
3) Filtering Commented and Deletion Fixes. Whilst deleting and commenting code blocks can yield compliable files, these strategies provide little evidence of a student’s
understanding of how to repair the actual fault. These actions can also be performed quickly; therefore the time taken to resolve an error in this manner may not be representative of the time taken to resolve using an actual fix. Deletion fixes are detected by computing the diff ratio between the snapshots of ef and et. If the count of insertions
and changes = 0, and deletes > 0, then the pair is removed.
Commented fixes are detected and removed by extracting the region of code surrounding the error location of ef, and
using a regex expression to determine if the same fragment has only become commented in the snapshot of et.
4) Error Message Generalization. Error messages within each compilation event pairing {ef, et} are generalized by
removing all identifier information. This allows us to build a profile for different classes of error, rather than for single specific messages. For example, “unknown class - Pet”
becomes generalized to “unknown class”.
5) Time Estimation.The final step involves estimating the amount of time that a student has spent working on each compilation pairing {ef, et}. The simplest approach would
be to directly compute the difference between timestamps of
ef and et. But as our pairings are constructed on a per-file
basis, this would fail to take into account whether a student has spent time working on other files between ef and et. We
therefore first construct a combined sequence of invocation and compilation events {h1,h2, .., hk-1,hk} for all files in a
session, ordered by timestamp. For every {ef, et}, if there
exists an hi, such that the timestamp of ef> hi> et, we
estimate the time spent on {ef,et} as the difference between
the timestamps of etand hi. The assumption is that a student
has stopped working on the source of ef, and has instead
only worked on the source code associated with hi.
320 320 320 320
B. Quantifying Ordinary Programming Behavior
1) Identifying Appropriate Predictors. Before developing a
mechanism to meaningfully quantify a student’s behavior, we first had to determine which aspects could indicate they were struggling to produce syntactically valid code. Prior research by [13] suggests that behavior exhibited by weaker students includes producing compilation pairings where both events result in compilation failures, have the same generalized message, and have the same error location. [15] found significant correlations between types of compilation pairings and performance where both events resulted in compilation failure and marginal correlations for pairings with the same message. Using our dataset we performed similar studies by correlating the average number of specific types of pairings which a student produced during a session, with performance. Significant correlations were found the average number of pairings whose both event types were compilation failures (r(45)= -.43, p<.01), the average number of pairings where the generalized error message was the same (r(45)=-.47, p<.01) and the average number of pairings where the generalized error messages were different (r(45)=-.39, p<.01). Correlations were also found between average number of pairings with the same error location (r(45)= -.26, p<.01). Our findings are consistent with [13] and [15], indicating that stronger programmers are associated with making less repeated errors, and will usually succeed in resolving an error in the next compilation.
A predictor which previous research [2-9][13-16] has not explored is the amount of time which a student takes to resolve an error. Research by [17] showed that the resolve times of certain types of errors vary based upon student ability; however, they did not use this variable to predict performance. We also hypothesized that in addition to having a higher frequency of errors; weaker students would also take longer to resolve errors than stronger students. After first removing outliers using the 2MADe rule [18], we
found a strong significant correlation between a student’s
mean resolve time and performance (r(45)= -.53, p<.01), which would seem to confirm our hypothesis. Because of this, we have incorporated resolve time as a predictor in our scoring model. However, different types of error can be more difficult for a student to resolve than others. Grouping the resolve times into 7 distinct classes of error (syntax, computation, identifiers, scope, exceptions, inheritance, abstraction) [11], a non-parametric Kruskal-Wallis test [18] confirmed that resolve times were significantly different between different classes of error (χ2(6)=1512.88, p<.01).
2) Scoring Programming Behavior. Based upon these findings, instead of considering the amount of time that a student takes to resolve any error, we consider the time they take to resolve a generalized type (Sec. III A(4)) of error, in comparison to a distribution of resolve times of their peers. As these distributions are generally positively skewed, we use the robust 2MADe approach [18] to remove outliers, and
apply a penalty based upon where a student’s resolve time
lies in the distribution. If their resolve time is more than one deviation below the mean, then they have resolved an error much faster than their peers - so we apply a low penalty. If a student's resolve time is more than one deviation above the mean, then they have resolved an error much slower than their peers - apply a higher penalty. Otherwise, apply a mid-range penalty. The main advantage of scoring students in this manner is that we can implicitly take into account the relative difficulty of different types of error. For instance, suppose a student resolved a GUI error in 30 seconds. Compared to their peers, this may be a good time, and the student would incur a low penalty. However, if they took 30 seconds to resolve a ';' expected error, then compared to their peers, this may be a bad time, and the student would incur a higher penalty. After scoring all pairings using the scoring algorithm (Fig. 1), the scores of all pairings are normalized and averaged to produce a Watwin score.
3) Deriving Fair Penalties. The penalties assigned in the scoring algorithm (Fig. 1) were not determined through random guesswork. We first experimented by weighting the penalties of each component based upon the strengths of their correlations with performance. But, this produced a narrow range of Watwin scores, and we felt that a better spread of individuals was required. We therefore carried out a brute-force search of the space surrounding the parameters we had originally chosen. The regression models generated were ranked based upon their explanatory power, and penalties were then determined by repeated random sub-sampling of the strongest 100,000 results. Although not yielding the strongest possible explanatory model for our dataset, the derived parameters had the advantage of spreading the Watwin scores whilst simultaneously reducing
the deviation between a student’s session scores. Along with
the cross-validation we performed (Sec. IV), this supports the generalizability of our approach to independent datasets.
Figure 1. Watwin Scoring Algorithm. Neither the components included nor penalties assigned were the result of random guesswork, but were based upon previous, and our own research. Sec. III B(1) and Sec. III B(3).
321 321 321 321
IV. RESULTS AND EVALUATION
To evaluate the effectiveness of our algorithm as a predictor
of a student’s programming performance, we performed a
linear regression, using a student’s Watwin score as the
independent variable, and their overall coursework mark as the dependent variable. We also considered the ability of Watwin as a classifier of student performance, based upon undergraduate degree boundaries set at our university (first >=70%, second 50-69%, third 40-49%, and fail: <40%).
An inspection of the scatter graph showed a linear
relation existed between a student’s Watwin scores and
performance, and that there were no significant outliers present. Residual independence was confirmed by the Durbin-Watson statistic (2.11), and the normality of residual distribution confirmed by an inspection of a histogram and
P-P plot. We found that a linear regression based upon a
student’s Watwin score could significantly predict
performance, F(1, 43)= 31.77, p<.01, explaining 42.49% of the variance in coursework marks (a strong effect [19]). The final RMSE of the model was low at 6.91% and the final accuracy of the predictive classifier was 75%. Further validation of our model using leave-one-out cross validation yielded a mean R2 of .4204 (SD=.013), RMSE of 7.09% (SD=.12), and classification accuracy of 75% (SD=1.30), indicating a good level of consistency with the full model.
However, it is important to consider how our algorithm performs, in terms of accuracy and explanatory power over the duration of a course. Interestingly, previous work [2-9] [13-16], used all available data to drive their predictive models. But predicting a student’s failure at the end of a course leaves little time for an instructor intervention. Therefore for each session in both datasets, we computed a regression and the classification accuracy, using only the data which had been logged up to, or during the session.
We found that after 4 sessions, accuracy had risen into
the 60’s range, and after 5 sessions accuracy leveled off and
stayed in the 70’s range consistently over the duration of the
course. However, measures of accuracy are reliant upon the underlying classification used. A more interesting analysis is to compare how the explanatory power of the regression changes over time. As can be seen from Fig. 2, by the end of the first term (week 9), a substantial percentage of the variance in coursework marks could be explained by our algorithm (30%), which rose to over 40% by the end of the second term. The average explanatory power of the algorithm was high, explaining 30.05% (SD=15.97) of the variance in performance. This confirms that our approach is data driven, and performs less well when data is scarce.
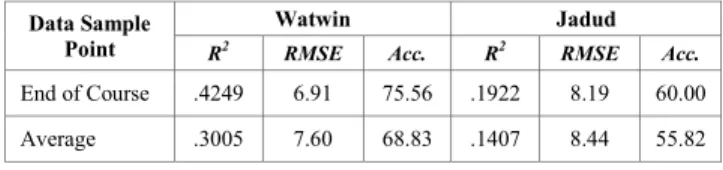
TABLE I. RESULTS FORWATWIN ANDJADUDPREDICTION MODELS
Data Sample Point
Watwin Jadud
R2 RMSE Acc. R2 RMSE Acc.
End of Course .4249 6.91 75.56 .1922 8.19 60.00 Average .3005 7.60 68.83 .1407 8.44 55.82
Figure 2. Explanatory Power of Watwin and Jadud During The Course
V. COMPARISON TOJADUD’SERROR QUOTIENT
A. Addressing the Methodological Weaknesses
The major methodological flaw of Jadud's Error Quotient [13] concerns the method used to construct a set of pairings. In Jadud's work, a set of consecutive compilation pairings are created by using events in the order that they occurred during a session. As previously discussed, this approach is flawed, as it assumes that either students only work on a single source file, or work on multiple files in a linear manner. However, we have found that students do not work in this way, and switching between files is common. Using our dataset we built 45,001 compilation pairings using Jadud's method. We found that 13,490 pairings (29.98%) were based upon compilation events from two different files. This has serious implications for the validity of the approach. For instance, when examining pairings having event types in the form {fail, success}, we found that 2,138 (24.13%) were based upon events from two different files. Almost 25% of the cases indicated that a student had resolved an error, whereas in reality, they had simply compiled a different file. We addressed this shortcoming by constructing pairings on a per-filename basis, allowing us to more accurately profile student behavior based upon the evolution of code across distinct files.
Also, by constructing compilation pairings on a per-session basis, it is possible for the source code similarity to be calculated using the source of two distinct files meaning that extra compilation pairings will be included in the filtered set. There are no measures taken to check superficial changes made to source code can be incorrectly flagged as semantic changes. The flaws of the preparation and filtering methods have implications for the validity of the scoring
algorithm used. In Jadud’s approach, pairings having event
types in the form {fail, success} will score 0. But, it is possible that a large percentage of these pairings are invalid (30% in our dataset). As a student’s error quotient is
averaged using the sum of every pair from a session, having a large amount of invalid 0 scoring pairings can lower a
student’s EQ, and inaccurately reflect their performance. Finally, there are the fundamental differences between the Watwin and Jadud approaches to consider. Whilst we
found that a student’s mean error resolve time strongly
322 322 322 322
correlated with performance (r(45)= -.53), Jadud’s approach
does not incorporate any scoring of behavior based upon this dimension. It also fails to take the type of error into account, and scores all errors equally. Very recent research [17] and this paper have both shown that students will find different types of error more difficult to resolve than others. Our uniqueness is to take these factors into account by relatively penalizing students based upon the amount of time they took to resolve an error, in comparison to a distribution of normal behavior defined by their peers.
B. Evaluation of Performance
We applied Jadud’s algorithm to our datasets. Consistent
with previous findings [13-17], we found Jadud’s EQ to be
a weak predictor of performance, and that a student’s error
quotient could explain less than half of the variance in performance, compared to their Watwin scores (Table 1). As can be seen from Fig 2 whilst the explanatory power of the EQ improves over time, it eventually levels off and remains a consistently weak predictor, only explaining between 15%-20% of the variance in performance over the final weeks of the course. This is also confirmed by the low standard deviations of average R2 values of the EQ values (Table 1). In contrast, the explanatory power of the Watwin scores consistently increases over the duration of the course, and is a strong early predictor, explaining almost 30% of the variance in performance after 5-6 sessions of data has been collected. To explore the effect of the previously outlined
methodological weaknesses of Jadud’s algorithm, we ran
Jadud’s algorithm using pairings built using the Watwin
algorithm. We found an increase in the explanatory power
of Jadud’s model (R2= .26 (+.07)), suggesting that whilst an appropriate preparation technique can improve explanatory power, alone, it is not enough to match the performance of our scoring approach where students are relatively penalized based upon their resolve times and programming behavior.
VI. CONCLUSION ANDFUTURE WORK
In this paper we presented Watwin, a dynamic algorithm designed to predict student performance in a programming course. Unlike prior work [2-9] which mainly used indirect criteria to predict performance, our approach is based upon analyzing directly logged, quantitative data describing
aspects of a student’s ordinary programming behavior. This allows prediction of performance to evolve over time – reflecting changes in the student’s learning progress without
the need to use multiple tests that often yield inconsistent results. The originality of our algorithm is to incorporate a method, where a student is relatively penalized based upon the amount of time they took to resolve an error, in comparison to a distribution of normal behavior defined by the resolve times of their peers. We addressed the methodological weaknesses of the closest related approach [13-14], and an evaluation has shown that our approach is a good predictor of performance, even early in a course. Future work will aim to further validate our approach using
data gathered from an independent sample of students, to identify more characteristics of programming behavior that are indicative of weaker students through the use of multivariate statistical [20] and data mining techniques [21], and to apply our algorithm within an expert system to select and supply appropriate compiler feedback to students [11].
REFERENCES
[1] J. Bennedsen, and M.E. Caspersen. “Failure rates in introductory programming.” SIGCSE Bulletin. pp. 32-36. vol. 39, June 2007. [2] C.K. Capstick, J.D. Gordon and A. Salvadori. “Predicting
Performance by University Students in Introductory Computing
Courses.” SIGCSE Bulletin. pp. 21-29, vol. 7, Sept. 1975.
[3] R.J. Barker and E.J. Unger. “A predictor for success in an
introductory programming class based upon abstract reasoning
development.” SIGCSE Bulletin. pp. 154-158, vol. 15, Feb. 1983. [4] K.L. Whipkey. “Identifying predictors of programming skill.”
SIGCSE Bulletin. pp. 36-42, vol. 16, Dec. 1984.
[5] V.L. Sauter. “Predicting computer programming skill.” Computers & Education. pp. 299-302, vol. 10, Sept. 1986.
[6] W.W.F. Lau and A.H.K. Yuen. “Modelling programming
performance: beyond the influence of learner characteristics.”
Computers & Education. pp. 1202-1213, vol. 57, Aug. 2011. [7] S. Bergin and R. Reilly. “Predicting introductory programming
performance: a multi-institutional, multivariate study”. Computer Science Education. pp. 303-323, vol. 16, Dec. 2006.
[8] P.R. Ventura, Jr. “Identifying predictors of success for an objects-first
CS1.” Computer Science Education. pp. 223-243, vol. 15, Sept. 2005. [9] J. Bennedsen and M.E. Caspersen. “Abstraction ability as an indicator
of success for learning object-orientated programming?” SIGCSE Bulletin. pp. 39-43, vol. 38, June 2006.
[10] C. Watson, F. Li, and R.W.H. Lau. “Learning programming
languages through corrective feedback and concept visualisation.” in
Proc. ICWL, 2011, pp. 11-20, Springer.
[11] C. Watson, F. Li, and J.L. Godwin. “BlueFix: Using Crowd-Sourced Feedback to Support Programming Students in Error Diagnosis and
Repair” in Proc. ICWL, 2012, pp. 228-239, Springer.
[12] C. Murphy, G. Kaiser, K. Loveland and S. Hasan. “Retina: helping students and instructors based on observed programming activities.”
SIGCSE Bulletin. pp. 178-182, March 2009.
[13] M.C. Jadud. “Methods and Tools for Exploring Novice Compilation Behavior”, in Proc. ICER, 2006, pp. 73-84, ACM.
[14] M.M.T. Rodrigo, E. Tabanao, E. M. Lahoz, M.C. Jadud. “Analyzing Online Protocols to Characterize Novice Java Programmers”, Philippine Journal of Science, pp. 177-199, vol. 138, Dec. 2009. [15] M.M.T. Rodrigo et al., “Affective and behavioral predictors of novice
programmer achievement.” SIGCSE Bulletin, pp. 156-160, vol 41, Sept. 2009.
[16] E.S. Tabanao, M.M.T. Rodrigo, and M.C. Jadud. “Predicting at-risk
Novice Java Programmers through the Analysis of Online Protocols”,
in Proc ICER, 2011, pp. 85-92, ACM.
[17] P. Denny, A. Luxton-Reilly and E. Tempero. “All Syntax Errors are Not Equal”. in Proc ITiCSE, 2012, pp. 75-80, ACM.
[18] R.R. Wilcox. Fundamentals of Modern Statistical Methods: Substantially Improving Power and Accuracy. Springer, 2010. [19] J. Cohen. Statistical Power Analysis for the Behavioral Sciences.
Hillsdale, NJ: Lawrence Erlbaum, 1988.
[20] J.L. Godwin, P. Matthews and C. Watson. “On the use of robust
multivariate statistical methods for the prognosis of wind turbine pitch faults.” in Proc. COMADEM, 2013, to be published.
[21] J.L. Godwin, P. Matthews and C. Watson. “Classification and
detection of electrical control system faults through SCADA data
analysis.” Chemical Engineering Transactions, 2013, to be published.
323 323 323 323