EFFICIENT TEXT CLASSIFICATION WITH LINEAR
REGRESSION USING A COMBINATION OF
PREDICTORS FOR FLU OUTBREAK DETECTION
Ali Al Essa
Under the Supervision of
Dr. Miad Faezipour
DISSERTATION
SUBMITTED IN PARTIAL FULFILMENT OF THE REQUIRMENTS FOR THE DEGREE OF DOCTOR OF PHILOSOHPY IN COMPUTER SCIENCE
AND ENGINEERING THE SCHOOL OF ENGINEERING
UNIVERSITY OF BRIDGEPORT CONNECTICUT
EFFICIENT TEXT CLASSIFICATION WITH LINEAR
REGRESSION USING A COMBINATION OF
PREDICTORS FOR FLU OUTBREAK DETECTION
c
EFFICIENT TEXT CLASSIFICATION WITH LINEAR
REGRESSION USING A COMBINATION OF
PREDICTORS FOR FLU OUTBREAK DETECTION
ABSTRACT
Early prediction of disease outbreaks and seasonal epidemics such as Influenza may reduce their impact on daily lives. Today, the web can be used for surveillance of diseases. Search engines and Social Networking Sites can be used to track trends of different diseases more quickly than government agencies such as Center of Disease Control and Prevention (CDC). Today, Social Networking Sites (SNS) are widely used by diverse demographic populations. Thus, SNS data can be used effectively to track disease outbreaks and provide necessary warnings. Although the generated data of microblogging sites is valuable for real time analysis and outbreak predictions, the volume is huge. Therefore, one of the main challenges in analyzing this huge volume of data is to find the best approach for accurate analysis in an efficient time. Regardless of the analysis time, many studies show only the accuracy of applying different machine learning approaches. Current SNS-based flu detection and prediction frameworks apply conventional machine learning approaches that require lengthy training and testing, which is not the optimal solution for new outbreaks with new signs and symptoms.
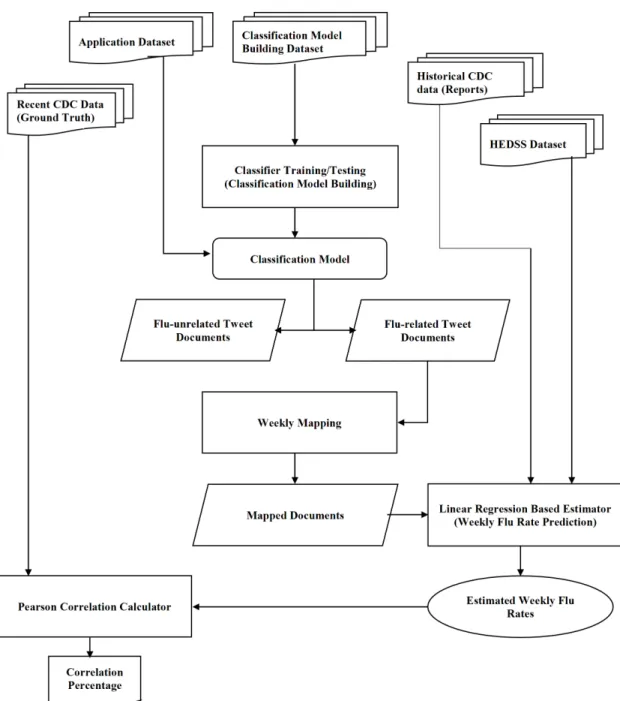
The aim of this study is to propose an efficient and accurate framework that uses SNS data to track disease outbreaks and provide early warnings, even for newest outbreaks ac-curately. The presented framework of outbreak prediction consists of three main modules: text classification, mapping, and linear regression for weekly flu rate predictions. The text classification module utilizes the features of sentiment analysis and predefined keyword
occurrences. Various classifiers, including FastText and six conventional machine learning algorithms, are evaluated to identify the most efficient and accurate one for the proposed framework. The text classifiers have been trained and tested using a pre-labeled dataset of flu-related and unrelated Twitter postings. The selected text classifier is then used to
classify over 8,400,000 tweet documents. The flu-related documents are then mapped on
a weekly basis using a mapping module. Lastly, the mapped results are passed together with historical Center for Disease Control and Prevention (CDC) data to a linear regression module for weekly flu rate predictions.
The evaluation of flu tweet classification shows that FastText together with the
ex-tracted features, has achieved accurate results with an F-measure value of 89.9% in
addi-tion to its efficiency. Therefore, FastText has been chosen to be the classificaaddi-tion module to work together with the other modules in the proposed framework, including the linear regression module, for flu trend predictions. The prediction results are compared with the available recent data from CDC as the ground truth and show a strong correlation of 96.2%.
To
My wonderful father and mother My loving wife
My charming children, Eithar, Albatool, and Hussain For their unconditional love, trust, and unending inspiration
ACKNOWLEDGEMENTS
I praise God who has provided me this opportunity and has granted me the capabil-ities to complete my studies successfully. This dissertation comes to its conclusion due to the assistance, guidance and trust of several people. I would like to thank all of them.
I owe my deepest sense of gratitude to my esteemed advisor Dr. Miad Faezipour for her thoughtful guidance, valuable comments, and for the freedom I was granted during the whole period of my Ph.D. researches. I am honored that my work has been supervised by her. She is professional and supportive. I sincerely thank Dr. Faezipour for her time, and help.
I would like to offer my sincere thanks to Dr. Abdel-shakour Abuzneid, Dr. Jeongkyu Lee, Dr. Xingguo Xiong, and Dr. Saeid Moslehpour for serving on my supervisory com-mittee, taking the time to evaluate this dissertation, and providing their valuable feedback and comments.
My thanks are also to Professors Charles Campbell, and Camy Deck from the Tutor-ing and LearnTutor-ing Center for their proofreadTutor-ing of this document.
Most importantly, my deepest gratitude and sincere thanks are to my wonderful fam-ily for their understanding, encouragement, and inspiration. I am especially grateful to my parents, who always believe in me, for their love and trust. My grateful thanks are also to my loving and caring wife Sahar, and my three lovely children Eithar, Albatool, and Hus-sain for their love and everlasting inspiration. Finally, I would like to express my sincere thanks to my sisters and brothers and also my friends for their positive influence.
TABLE OF CONTENTS
ABSTRACT . . . iv
ACKNOWLEDGEMENTS . . . vii
TABLE OF CONTENTS . . . .viii
LIST OF TABLES . . . xi
LIST OF FIGURES . . . xii
ABBREVIATIONS . . . xiv
CHAPTER 1: INTRODUCTION . . . 1
1.1 Research Problem and Scope . . . 4
1.2 Motivation Behind the Research . . . 5
1.3 Contributions of the Proposed Research . . . 6
CHAPTER 2: BACKGROUND AND LITERATURE SURVEY . . . 8
2.1 Introduction . . . 8
2.2 Article Selection Methodology and Related Work . . . 8
2.3 Methods . . . 10
2.3.1 Text Mining . . . 11
2.3.2 Graph data mining . . . 13
2.3.3 Topic Models . . . 15
2.3.4 Machine Learning Techniques . . . 19
2.3.5 Math/Statistical Based Models . . . 28
2.3.6 Mechanistic disease models . . . 32
2.3.7 Detection Based on Filtered Keywords and Documents . . . 35
2.4 Discussion . . . 37 2.5 Challenges . . . 42 2.5.1 Data Collection . . . 42 2.5.2 Data Size . . . 42 2.5.3 Language . . . 42 2.5.4 Heterogeneity . . . 42 2.5.5 Sampling bias . . . 43
2.5.6 Dataset Consistency . . . 43 2.5.7 User Location . . . 43 2.5.8 Proxy Population . . . 43 2.5.9 Spams . . . 44 2.5.10 Evaluation . . . 44 2.6 Concluding Remarks . . . 44
CHAPTER 3: RESEARCH METHODOLOGY . . . 45
3.1 Data Collection and Preparation . . . 48
3.1.1 Classification Model Data . . . 48
3.1.2 Application Dataset . . . 49
3.1.3 CDC ILINet Data . . . 49
3.1.4 Data of Hospital Emergency Department Syndromic Surveillance (HEDSS) System . . . 50
3.2 Preprocessing . . . 50
3.3 Feature Extraction . . . 51
3.3.1 Textual Features . . . 52
3.3.2 Stylometric features . . . 53
3.3.3 Topic–related keywords based features . . . 53
3.3.4 Sentiment based features . . . 53
3.4 Classification Model Building - Training and Testing . . . 55
3.4.1 FastText . . . 55
3.4.2 Conventional Machine Learning Classifiers . . . 55
3.5 Mapping . . . 58
3.6 Weekly Flu Rate Estimation . . . 60
3.6.1 Linear Regression Model . . . 61
3.6.2 Other Regression Models . . . 61
CHAPTER 4: IMPLEMENTATION AND TESTING . . . 63
4.1 Flu Post Classification . . . 64
4.2 Performance Metrics . . . 65
4.2.1 Text Classification . . . 65
4.2.2 Flu Rate Estimation . . . 66
CHAPTER 5: RESULTS . . . 67
5.1 Classification Results . . . 67
5.2 Weekly Flu Rate Estimation Results . . . 71
CHAPTER 6: DISCUSSION AND VALIDATION . . . 73
6.1 Computational Complexity . . . 73
6.2 Statistical Power Analysis . . . 74
REFERENCES . . . 80
LIST OF TABLES
Table 2.1 Summary of the used data sets in the reviewed studies . . . 39
Table 2.2 Summary of the reviewed methods and techniques . . . 40
Table 2.3 Journal/Conference backgrounds of the reviewed studies . . . 41
Table 5.1 Performance of classifiers . . . 69
Table 5.2 Summary of the reviewed flu posts classifiers (Relevant / Flu-Irrelevant) . . . 70
Table 5.3 Performance of Flu rate estimator using different regression models . 71
LIST OF FIGURES
Figure 2.1 Articles selection process . . . 11
Figure 2.2 A method to monitor ILI and identify communities in Social Media . 14 Figure 2.3 Health state transition diagram . . . 18
Figure 2.4 A framework for Influenza outbreak detection . . . 25
Figure 2.5 The process of Neural Networks based detection . . . 26
Figure 2.6 SNEFT architecture . . . 31
Figure 3.1 Proposed framework overview . . . 46
Figure 3.2 Methodology for text classification of flu tweets . . . 47
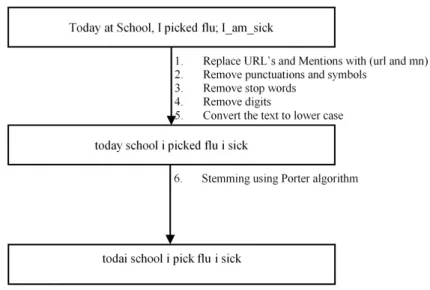
Figure 3.3 Text preprocessing . . . 51
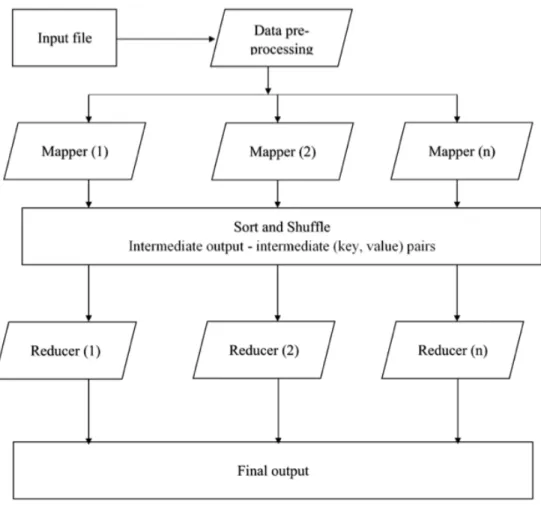
Figure 3.4 General flow of Hadoop MapReduce programming approach . . . . 59
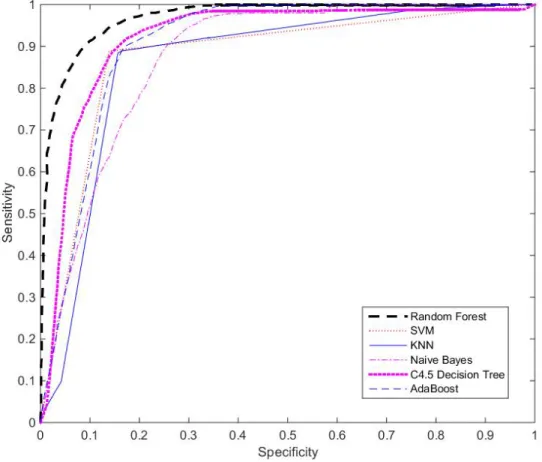
Figure 5.1 Performance comparison using ROC . . . 68
Figure 5.2 FastText performance using different sets of features . . . 69
Figure 5.3 Correlation between the proposed framework and CDC ILI rate us-ing different regression models . . . 72
Figure 5.4 Correlation between the proposed framework and CDC ILI rate . . . 72
Figure A.1 Correlation between the proposed framework and CDC ILI rates (Nov. 2018) . . . 95
Figure A.2 Correlation between the proposed framework and CDC ILI rates
ABBREVIATIONS
ACFAutocorrelation function
ARMAAuto regression moving average
ATAMAilment topic aspect model
BOW Bag-Of-Words
CDCCenter for Disease Control and Prevention
CNICChina Nation Influenza Center
EDEmergency Departments
EAKFEnsemble Adjustment Kalman Filter
FNFalse Negative
FPFalse Positive
FTFastText
HEDSSData of Hospital Emergency Department Syndromic Surveillance
HFSTMHidden Flu-State from Tweet Model
IDFInverse Document Frequency Weighting
IDSCInfection Disease Surveillance Center
ILINetInfluenza Like Illness Surveillance Network
KNNK-Nearest Neighbors
MIMutual Information
MNMentions
MSEMean Square Error
NLTK Natural Language Processing Toolkit
RFRandom Forest
RMSERoot Mean Squared Error
ROCReceiver Operating Characteristic
RT Retweets
SIRSSusceptible Infections Recovered Susceptible
SNEFTSocial Network Enabled Flu Trends
SNSSocial Networking Sites
SVMSupport Vector Machine
SVRSupport Vector Regression
TFTerm Frequency Weighting
TF-IDFTerm Frequency-Inverse Document Frequency
TNTrue Negative
CHAPTER 1: INTRODUCTION
Public health is an important issue. Health care providers must be updated about the public health and disease outbreaks affecting their communities in order to take correct ac-tions at the right time. To produce outbreak reports, typical disease surveillance systems
de-pend on official statistics based on patient visits [1]. In the U.S., these reports are produced
by the Center for Disease Control and Prevention (CDC) to inform healthcare providers about certain disease outbreaks such as Influenza outbreaks. CDC publishes flu-related reports using the United States Influenza Like Illness Surveillance Network (ILINet) that gathers flu-related information of outpatients from hundreds of healthcare providers around the U.S. ILINet shows accurate results in detecting flu outbreaks, but it is costly and takes a long time to issue the required reports. It is crucial for any disease surveillance system to collect related data and provide the reports as early as possible to prevent the spread of the disease. To this end, many solutions have been proposed to generate earlier outbreak
warnings. Examples include volumes of telephone calls, over-the-counter drug sales [1],
search engine logs [2,3,4,5,6,7], and SNS data that can be used for real-time analysis for
better services [8,9, 10,11,12,13,14,15]. When comparing the different resources used
for surveillance, such as search engine logs, SNS data is more descriptive and available to the public. Since SNS provides detailed demographic information, the collected data can be used to simulate the spread of disease outbreaks with temporal analysis.
Social Networking Sites (SNS) are tools that include big data about users and their shared thoughts and ideas, in addition to real-time data of users’ conversations and statuses.
The amount of data, aside from the growth of SNS users, represents the important role of
SNS in real-time analysis and predictions in many areas [16, 17]. These areas include
traffic [18, 19, 20,21], disaster prediction [22, 23,24, 25, 26], management [27, 28, 29],
networking [30,31], news [32,33, 34,35, 36], and many more. In the public health area,
SNS provides an efficient resource to conduct disease surveillance and a communication
tool to prevent disease outbreaks [37].
Based on our survey of disease outbreak detection models using social media data, we found that most studies and models were developed to detect Influenza outbreaks from SNS such as seasonal Influenza and the swine Influenza. The developed models can po-tentially be deployed for other disease outbreak detections and predictions. Although pre-diction and detection terms are used interchangeably throughout the study, the terms have different definitions. Flu detection refers to the process of discovering flu trends or flu cases that have already occurred. On the other hand, flu prediction collects data to pre-dict flu trends. Furthermore, the term nowcasting refers to the process of prepre-dicting flu cases that have happened in real time, which surveillance systems overlook. Because of the surveillance system limitations, the need for new techniques and models, such as Google Flu Trend (GFT), is necessary in order to predict non-reflected flu cases. This nowcasting process is integrated into report revisions before the final reports are issued. Aside from nowcasting, the process of forecasting is used to predict actual flu cases in the future.
In this study, we relied on the Twitter microblog to conduct minute-by-minute anal-ysis in order to track the high frequency of posted messages. We present a framework to track Influenza trends through Twitter postings. The framework includes preprocess-ing, feature extraction, Twitter documents classification, documents weekly-mapppreprocess-ing, and weekly flu rate predictions. The preprocessing phase includes stemming and removal of stop words and ineffective characters, which are non-alphanumeric tokens. Then, the pre-processed data is used to extract features to be passed to a tweet classifier to distinguish
between flu-related tweets and unrelated ones. The flu-related documents are then mapped on a weekly basis. Finally, the mapped results are passed together with historical CDC data to an estimator for flu trend predictions.
The Twitter Microblogging site is used in this study because it is the most widely used Social Networking Site (SNS). It is an efficient resource to track trends for several reasons. First, the high frequency of posted messages helps to perform minute–by–minute analysis. Second, compared with search engine logs, Twitter posts are more descriptive and available for the public. In addition, more analysis can be performed by analyzing the users’ profiles such as demographic data and specific details. Third, users of Twitter are of diverse ages, not only young people, but also middle aged, and technology savvy older
population [15].
The generated data of SNS is valuable for real-time analysis and outbreak predic-tions, but its volume is huge. Therefore, one of the main challenges in analyzing this huge volume of data is to find the best approach for accurate analysis in an efficient time. Current Twitter-based flu detection and prediction frameworks apply conventional machine learn-ing approaches that require lengthy trainlearn-ing and testlearn-ing which is not the optimal solution to be used for a new outbreak with new signs and symptoms. Regardless of the analysis time, many studies only report the accuracy of different machine learning approaches. Thus, more efficient solutions are required for accurate results with less processing time. In this study, we demonstrate that using FastText can enhance the efficiency of Twitter-based flu outbreak prediction models. Originally, FastText became an efficient text classifier that was proposed by Facebook. FastText performs more quickly than deep learning classifiers for training and testing procedures and produces comparably accurate results. The FastText classifier can train more than a billion words in about ten minutes and then predict multiple
1.1 Research Problem and Scope
SNS postings can be seen as triggers for different event prediction such as disease outbreaks. Discovering knowledge from the posts for flu surveillance models requires an efficient approach of text processing. It includes gathering the related text (posts) about the disease and then issuing necessary reports at an early stage that is crucial for outbreak prevention. Since the gathered data is unstructured, the first step is to preprocess the un-structured content in order to analyze the data and produce the results in an understandable way. The second step is feature extraction, which is a key to performance enhancement. The third step is knowledge extraction, using machine learning techniques for text classi-fication that includes model training and testing. A post on a microblogging site is then classified into either related or unrelated classes, for example;
Related: I’m sick, I got flu yesterday.
Unrelated:I’m sick of school.
Our literature survey indicates that most of the existing frameworks use conventional
machine learning classifiers [39]. These approaches require long time for the training
pro-cess. A new outbreak may require retraining the used prediction model with its new signs and symptoms in order to consider the related posts. Thus, such approaches are not optimal solutions for new deadly flu outbreaks.
The proposed framework using FastText classifier together with the extracted fea-tures, which have not been previously used for Twitter-based flu surveillance models, aims to extract related posts faster with a comparable accuracy. Thus, it can be used for ur-gent cases to stop the spread of a new deadly outbreak. Improving the efficiency, along with the accuracy of text classification, is important for text-based surveillance systems for
generating early reports.
The scope of this study is to present an accurate and efficient FastText-based frame-work to generate Influenza trend predictions from Twitter. In addition to the typical textual features, the proposed framework utilizes the features of text sentiment analysis and the occurrences of predefined topic keywords to distinguish between flu-related tweets and un-related ones to be passed together with historical CDC data to an estimator module for weekly flu rate predictions.
1.2 Motivation Behind the Research
Seasonal Influenza and flu can be a serious problem that may lead to death. About
250,000 to 500,000 deaths occur worldwide each year because of flu [40]. Public health
care providers must be updated about the seasonal flu or any other outbreak to take the required actions for their communities. Getting an early warning will help to prevent the spread of flu in the population. Typically, health care providers take the required action to the public after getting reports of flu from the Center for Disease Control and Preven-tion (CDC). This center collects data from health care providers to monitor Influenza–Like Illness (ILI) and publishes the reports. This takes one to two weeks’ delay, causing the
required warning to come late to the provider’s attention [40]. The providers need to be
warned at the earliest time in order to take the appropriate actions to prevent the spread of flu. Therefore, many solutions have been proposed to provide the warning as early as pos-sible. These include monitoring web search queries like Google Flu Trend, monitoring call volume to advice lines, and monitoring the sales of drugs and flu shots taken by patients.
In addition, textual and structural data mining techniques [37] have been used to track the
flu activity in Social Networking Sites (SNS). However, the literature survey shows that the existing SNS–based models include conventional techniques of post classification with
efficient post classifier that is crucial for any SNS based model.
1.3 Contributions of the Proposed Research
Since the SNS-based flu prediction models rely on post classifications, it is still a challenging task that requires more investigation for better predictions. The aim of this research is to propose a framework with an efficient classifier for better Influenza predic-tions using the data of Social Networking Sites and historical CDC reports as predictors. It classifies flu–related posts using important text features, such as sentiment analysis fea-tures, and then the related posts are passed together with historical CDC data to a linear regression module for better weekly flu rate predictions. The contributions of this study include the following:
• Sentiment analysis of the analyzed posts as an additional feature is considered to
improve the accuracy of the classification results.
• Simple keywords related to the disease as part of the additional features are also
considered to improve the accuracy of the classification results.
• The Term Frequency–Inverse Document Frequency (TF–IDF) weighting technique
to weigh textual features is considered to improve the accuracy of flu tweet classi-fications.
• FastText classifier is fine–tuned in this work to improve the accuracy and efficiency
of tweet classification. FastText cuts the required time for classification model train-ing and testtrain-ing. This is very useful for critical diseases that need immediate action such as Ebola and Corona.
• In addition, six conventional supervised classification methods are evaluated
evalu-ated classifiers include Random Forest, Naïve Bayes, SVM, C4.5 Decision Tree, K-nearest neighbors (KNN), and AdaBoost. The preprocessed labeled dataset was used to train and test the classifiers using 10–fold cross validation as the experimen-tal setting.
• A weekly flu rate estimator based on the linear regression model is proposed. It
considers a combination of predictors that includes the classification results and the historical ILI rates.
CHAPTER 2: BACKGROUND AND LITERATURE
SURVEY
2.1 Introduction
The focus of this chapter is to survey the existing tools, techniques, frameworks, and methods of predicting Influenza trends in social media data. The studied methods evaluate the Twitter posts that have keywords related to Influenza for faster detection in an effort to achieve and maintain healthier communities.
This chapter is organized as follows. The Article Selection Methodology and Related Work Section first presents the method of article selection and evaluation for this review in addition to the related work. The Method Section, then, demonstrates comprehensively different methodologies and techniques of Influenza trends detection from social media data. The Discussion Section presents a discussion and comparison among all the proposed existing methodologies. Then, the Challenges Section discusses the challenges of using social media data for detection processes. Finally, concluding remarks of the literature survey are presented.
2.2 Article Selection Methodology and Related Work
This literature survey aims to review the published work in the past recent years that use social media data such as Twitter to detect Influenza. Relevant articles were collected
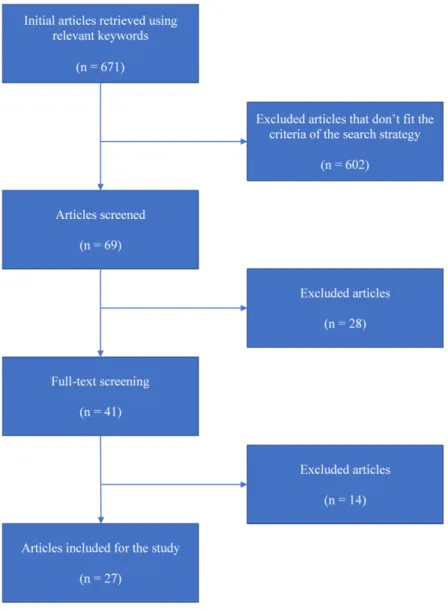
from various resources and publishers including IEEE, ACM, BMC, and MDPI. Different keywords were used to collect the relevant articles such as "Influenza trend prediction using social media data." During the collection process the initial number of retrieved articles was 671. The selection process was based on certain criteria such as:
• Being relevant to flu outbreak detection and prediction
• Analyzing social media data in the detection and prediction process
• Being in English Language.
Based on the selection criteria, 602 articles were excluded by reviewing the titles and the abstract of the retrieved articles. Initially, the selected articles were reviewed entirely. Out of 69 of the selected articles, 41 articles satisfied all the criteria. The final number of selected articles that were considered for this review was 27 articles. The other 14 articles
were insufficient. Figure2.1summarizes the process of the article selection.
Several prediction and detection models that use other web data, such as Google Flu Trend (GFT), have been published in the literature for flu outbreak prediction and detection. Some of these models, such as PROFET, are included in this review to clarify that they can potentially work with the available social media data. Some other publications in the literature present flu surveillance related tools and web applications that don’t use social media data for flu detections and predictions. Some of these applications and tools are listed below:
• FluNearYou (https://flunearyou.org/): FluNearYou [41] is a web application that
uses weekly surveys to collect health status of individuals in addition to the data obtained from CDC and GFT. By using the data from the three sources, the appli-cation shows the spread of the disease in the form of maps and charts.
• Influenzanet (http://www.Influenzanet.eu): Influenzanet [42] is a web application
more than 30,000 contributors of Internet volunteers. Volunteers are asked to report their status weekly.
• FluOutlook (https://fluoutlook.org/): FluOutlook [43] is a web application that shows
forecasts of the current flu season in North America and Europe in form of maps and charts. Reports are updated weekly using CDC reports. FluOutlook is based on the compartmental epidemic model.
• Columbia Prediction of Infectious Diseases (http://cpid.iri.columbia.edu/): Columbia
Prediction of Infectious Diseases is a web application that shows forecasts of sea-sonal flu in curve charts. It also shows the current ILI counts in the US in a map
format [44].
• HealthMap (https://www.healthmap.org/): HealthMap is an infectious disease
mon-itoring system. It uses unstructured reports of the infectious diseases from multiple sources in the Internet, filters them, classifies, and visualizes information about
im-portant identified disease outbreaks [45].
2.3 Methods
There are many ways to discover knowledge and predict flu trends from Twitter data. This Section glances at various existing techniques. The studies for this review were selected to include the existing methods and techniques applied to SNS data for earlier Influenza outbreak prediction. The studied methods and techniques are within the past recent years that fall under one of the main categories of graph data mining, text mining, topic models, machine learning, math/statistical models, or mechanistic models.
Figure 2.1: Articles selection process
2.3.1 Text Mining
Different studies show that various data mining methods can be employed to extract
knowledge and detect different trends from big data such as social media data [46, 47, 1,
48,49,50,51].
Text mining is a process that uses unstructured data (text) to discover intended in-formation. Text mining techniques extract knowledge from unstructured data while data mining extracts data from structured databases. This makes it more difficult than
struc-tured data mining. Text mining can be used to discover Influenza trends from social media
data [37].
2.3.1.1 Co–occurrences Analysis
Co–occurrences analysis can be used to discover how frequent certain keywords are used in a document. This analysis helps in finding related social media posts for better flu trend predictions. In addition, more analysis could be conducted using co–occurrences
analysis such as medicine misuse analysis. Daniel Scanfeld et al. [52] demonstrated
an-tibiotic misuse analysis using co–occurrences and categorization methods on social media data. Their study has also shown that social networks can be used by patients to share health information. For that reason, these kinds of networks could be used to gather knowl-edge to explore potential misuse of medicine. This indicates that the co–occurrences and categorization methods, along with the known flu symptoms and treatment can be used to predict flu trends in Social Networking Sites.
2.3.1.2 Historical Pattern Analysis
Since history may repeat itself, future events can be predicted using patterns of
histor-ical events such as search queries or social media posts. Kira Radinsky et al. [53] proposed
a method named PROFET that predicts future news based on patterns of historical events collected from Google trends services. These services use large number of search queries.
PROFET algorithm extracts information from large number of web resources and analyzes the past events pattern in order to predict future news. It uses Google Hot Trends, which is used to obtain the important events, and Google Related Trends for the related events. It also uses Google Trends Chart to find peaks for an event. PROFET consists of several steps:
simplicity, only the important and related events are considered for further pro-cesses.
• The algorithm identifies a vector D to represent an ordered set of days: D=<
d1,d2, ...,dn>.
• The algorithm defines a binary vector for each eventwi:g(wi) =<d1i,d2i, . . . ,din>.
This vector is used to indicate that the eventwiappeared whendij=1. The Google
Trends Chart is used to find peaks for each eventwi.
• The algorithm predicts the terms or events that may peak inkdays.
• The algorithm returns a list of candidate terms with associated weights. The event
with a stronger weight is the event with a higher chance of happening in the future
withinkdays.
This algorithm together with the available social media data can help in predicting flu trends in social media. The patterns of the historical social media posts can be used as an extra parameter for any machine learning framework for better predictions.
2.3.2 Graph data mining
This technique is a process of discovering knowledge in structured data using graph-ical representation and graph theories. Courtney D. Corley et al. showed how graph based data mining can be used to discover flu affected communities and also to detect anomalies
for better trend predictions [37].
Corley et al. [37] developed a framework based on text and graph mining. Figure
2.2 shows the general overview of their proposed framework. The framework monitors
Influenza–Like Illness (ILI) mentioned in social media. It employs different data min-ing methods: text minmin-ing, link (graphical) minmin-ing, and structural data minmin-ing methods. The text mining method is used to identify flu trends by extracting information from large
collection of texts from social media web. The link analysis is used to find the targeted communities. A community is represented as a collection of vertices and edges (V, C). The targeted community can be identified using the Girvan–Newman algorithm (GN) that helps
to identify clusters of potential communities in the studied social media [37]. The
cluster-ing process in this framework is based on content type and publisher (the first responder). The graph–based analysis technique is also used for further detection of possible anomalies (unusual occurrences) and informative substructure that could increase ILI. The results of the proposed framework show high correlation between flu–related posts and CDC weekly reports. The Girvan–Newman algorithm can be applied to any graph for the clustering process. It is composed of several steps that should be iterated to identify clusters as com-munities. After each iteration, the remaining components in the graph are considered as a cluster/community. Finding targeted communities using this method helps in optimizing the public health responses.
2.3.3 Topic Models
2.3.3.1 Ailment Topic Aspect Model (ATAM) and Latent
Dirich-let Allocation Models
ATAM is a topic model that associates words with their hidden topics. Michael J.
Paul et al. [54] showed that the ATAM model can be used to discover health topics posted
by users in Twitter. The model is designed to discover more than a single disease. It is based on a probabilistic topic model called LDA (Latent Dirichlet Allocation) that associates words to hidden topics in a text such as a Twitter post and then discovers latent (hidden) structures in the data. Each hidden topic in any document is defined by a multinomial distribution over its words. Applying posterior inference (parameter learning) will return the topics with the words, which frequently co–occur with them. LDA gives topics related to disease, but it doesn’t indicate a specific ailment clearly. For example, surgery could be discovered as a treatment, but LDA doesn’t identify clearly whether it is for an injury or cancer. In addition to the topic model, the authors developed a structural model that uses symptoms and treatments to discover ailments.
ATAM can be used to associate symptoms, treatments, and general words with an ailment (disease). An ailment comprises of treatments, symptoms and general words. The model could associate a disease with its symptoms and treatment using Social Networking Sites. The authors use 1.6 million tweets to train the model. The model is a low cost
alternative to track public health trends. The study [54] has shown that the ATAM model
can discover more ailments than LDA. It produces more detailed analysis and tracks disease rate that matches the statistics published by the government (CDC).
2.3.3.2 Enhanced Topic Models (ATAM+)
Paul et al. [55] proposed a variant version of ATAM model called ATAM+. It is
pub-lic health to predict specific diseases such as Influenza among other things. The model is improved by using prior knowledge, reports resulting from several new applications, cor-relating behavioral risk factors with ailments, and analyzing correlation of symptoms and treatments with ailments. The improved process consists of selecting 20 diseases and then collecting articles related to these diseases based on prior knowledge, and in the second step, the words in the articles were paired with the selected diseases. The results of the im-proved model show high quantitative correlation with government data (CDC) in detecting the flu trend using social media.
The study shows that by using ATAM+, the following could be learned from Twitter:
• Syndromic Surveillance: ATAM+ is able to discover and learn several aspects of
public health, not only flu or just specific diseases from Twitter. The correlation between the results of the improved model and flu rate produced by CDC is high (0.958).
• Geographical Behavioral Risk Factor: This shows how the model can be used to
mine public health information based on geographical region. In comparison with the ATAM model, it has been shown that the ailments discovered by the enhanced model (ATAM+) have higher correlation with the risk factors run by CDC. For example, the correlation between cancer and tobacco use is (0.648) using ATAM+ whereas the correlation is (0.320) using ATAM. This demonstrates that the ATAM+ outperforms ATAM.
• Ailment Tracking over Time and Geography: ATAM+ model can be used to mine
data over time and different locations.
• Symptoms and Medication Analysis: The analysis of symptoms and treatment–
especially for people who don’t go to health care providers–needs a large popula-tion sample size. Therefore, SNS is a better alternative to perform symptoms and
treatment analysis using ATAM+. The ATAM+ is able to detect that the headache is the most common ailment treated by pain relievers. Also it shows that Tylenol is the most popular pain reliever on the market.
• Antibiotic usage Analysis: Medicine usage analysis such as antibiotic misuse could
be performed using ATAM+.
2.3.3.3 Hidden Flu–State from Tweet Model – HFSTM (Users
Health States Transition for Better Prediction)
Liangzhe Chen et al. [56] proposed a model called Hidden Flu–State from Tweet
Model (HFSTM) that is able to capture hidden health states of users and the associated transitions by analyzing their tweet posts. The extracted states are used to obtain a better prediction of trends. It aggregates the states of the users in a specific geographical region for better prediction. The proposed model captures not only one tweet post, but also streams of tweet posts of users in order to capture their underlining health status (different health states from tweet posts). The used states for this study are: S (healthy), E (Exposed), I (Infected), and R (Recovered with Immunity).
Most of the other models are coarse–grained because they don’t give any under-standing of how health states change over time. This model links the social activity models and the epidemiological models. This linkage improves the prediction process. The most common Contagion–based epidemiological models are SI, SIR, SEIS. These models are used here to predict the true flu cases by tracking the health states of a person through the lifecycle of the infection.
Unlike the proposed model, the existing topic models (LDA, ATAM+, Makovian, and non-Markov) do not solve the problem of flu state changing. The model uses unsupervised topic modeling that can capture the transition (changes) between consecutive messages of a user.
The study [56] has shown that the HFSTM model can learn meaningful word distri-bution. Each word in the list belongs to one of the three states (S, E, I). It can also learn the
state transition as shown in Figure2.3. The HFSTM model is able to classify the state of
tweets and captures the transitions. It is also capable of predicting flu trends. The results of HFSTM model were compared to the Pan American Health Organization (PAHO) weekly records and the results of other two models: Google Flu Trend (GFT) and the baseline model that is based on word count and linear regression. GFT is a Flu trend prediction system that uses the volume of flu related search queries for the prediction process. Many
studies have been conducted to evaluate and improve GFT [57, 58, 59, 60, 61, 62]. The
study has shown that the HFSTM model is better than the baseline model and is compa-rable with GFT. In some cases, HFSTM outperforms GFT. Results have shown that GFT overestimates the number of flu cases.
2.3.4 Machine Learning Techniques
2.3.4.1 Support Vector Machine (SVM)
Support Vector Machine (SVM) is a supervised learning method. Based on our sur-vey, SVM is the most commonly used machine learning algorithm for the purpose of flu
related posts classifications [63,64,65,66,67].
David A. Broniatowski, et al. [65] proposed a model that consists of three levels
of classification using SVM for better distinction between the actual tweets about flu and the tweets that seem related but are not actually flu tweets (named "chatter" posts). The first classifiers is used to classify the collected posts to health–related/unrelated posts. The second one is used to extract the flu related posts, and the third one is used for infection classifications. The proposed algorithm was tested using a collection of tweets from Sep. 30, 2012 to May 31, 2013 (covering the season flu of 2012–2013) for the NYC location and the USA in general (local and national). To measure the performance, the results of
the proposed algorithm was observed to have correlated with the CDC data (r=0.93) and
also with the data of the Department of Health and Mental Hygiene of New York City
(r=0.88).
It has been shown that the distinction between the infection and awareness tweets enhances the accuracy of the results. The goal of this distinction is to consider the infection
posts only. Alex Lamb, et al. [68] proposed a machine learning based model that
con-sists of two phases of classification to differentiate between the infection and awareness tweets. The accuracy of the model showed high correlation with CDC data using Pearson
Correlation (r=0.9897).
Eiji Aramaki, et al. [64] proposed a framework that consists of two parts. First, a
crawler that works together with Twitter API to collect tweets was used, and then they were filtered for only flu–related ones. Second, an SVM–based classifier was used to extract only the actual Influenza tweets (positive tweets) and exclude the unrelated ones such as
news and questions (negative tweets). The initial dataset for this study was collected from Nov 2008 to June 2010. It included 300 million general tweets. Then, this dataset was filtered using "Influenza" keyword to get a set of only flu related tweets which contained 400,000 tweets. The flu–related dataset was divided into two parts: a training dataset, which contained 5,000 tweets (November 2008) and a test dataset, which contained all the remaining tweets from Dec 2008 to June 2010. The training dataset was assigned to a human annotator to label each tweet as either positive or negative. A tweet is labeled positive if it met two conditions. First, the flu tweet should concern the person who posted the tweet or about another person in a nearby area (maximum an area of the city). If the distance is unknown, the tweet is considered negative. Second, the flu tweet should be an affirmative sentence in the present tense or past tense with maximum period of 24 hours which can be checked using specific keywords such as "yesterday". The SVM classifier was implemented using the Bag–of–Words feature representation. The authors compared the accuracy of the SVM–based classifier with other six different machine learning methods and they found that the SVM was the most accurate method. For the purpose of evaluation, a Pearson Correlation was used to correlate between the results of this framework and the Japanese government data provided by the Infection Disease Surveillance Center (IDSC).
The results of this framework showed high correlation (r=0.89). The results also showed
that news could impact the accuracy of the results. It has been shown that the swine flu related news in 2009 led to poor performance of this method and other methods.
José Carlos Santos, et al. [67] also applied SVM–based classifier to detect flu–like
illness in Portugal using Twitter posts. For the purpose of training and testing, a dataset with 2,704 posts was manually annotated with 650 textual features. A subset of the an-notated dataset was used to train the classifier. The classified tweets together with search queries were applied to a regression model as predictors. The results of the used model was evaluated and compared with the reports provided by Influenzanet: a system that
mon-itors Influenza Like Illness activities in Europe. The highest correlation ratio between the
results of this method and Influenzanet data is 0.89 (r=0.89). The classifier was
imple-mented using the Bag–of–Words feature representation, and the feature selection process was based on a Mutual Information (MI) value that is used to pick the best set of features. Each feature is applied to a true class, and then MI value is assigned to the feature. The value of MI is based on how the feature is related to the true class. A feature with high MI value is more related to the true class.
Nanhai Yang, et al. [66] proposed a SVM–based method to predict flu trends from
Chinese Social Networking Sites in Beijing. The authors claim that this is the first study to predict flu trend from Chinese Social Networking Sites. The collected data for this study included 3,505,110 posts from Sep. 2013 to Dec. 2013. Among those, 5,000 random posts were selected for manual annotation (sick and not sick labels) to be used for training and testing purposes-285 of sick posts and 285 of not sick posts were picked for training. For higher accuracy, word based features were used instead of character based features. Among the four types of word weighting techniques: Boolean weighting, term frequency weight-ing (TF), inverted document frequency weightweight-ing (IDF) and term frequency–inverted doc-ument frequency weighting (TFIDF), the TFIDF method was considered for classification purposes. Different classifiers were compared to decide the best one for the problem. The authors found that SVM was the best for big data problems. This method was able to predict the flu trend five days earlier than the China Nation Influenza Center (CNIC).
Mauricio Santillana, et al. [63] proposed a machine learning–based method that was
capable of predicting flu related activities. In addition to CDC ILI reports that have been used as the ground truth, the method used data from different sources for better results. The sources included Google searches, Google Flu Trends, Twitter posts, hospital visits records collected from AthenaHealth, and a surveillance system called FluNearYou. This study has shown that the results of prediction methods using combined data sources outperform the
results when using a single data source. The method utilizes well–known machine learning algorithms including support vector machine, stacked linear regression and AdaBoost with decision trees regression. The study has also shown that the three algorithms work perfectly together in combining the information from different sources for real time analysis and then better forecasting. It has been shown that this method can predict one week faster than the Google Flu Trend (GFT) with accurate and comparable results.
2.3.4.2 Neural Network
Vasileios Lampos et al. [69] proposed a method to track flu in the population
us-ing Social Networkus-ing Sites. The method analyzed flu–related and flu–symptoms–related keywords in Twitter. The extracted information was converted to flu–score using machine learning techniques. Computing the flu score from Twitter includes several steps. First,
a set of selected keywords M is identified to represent the search keywords to look for in
Twitter posts: mi; wherei∈[1,k]. Second, a set of daily tweets is identified asτ=tjwhere
j∈[1,n]. When the marker mi appears in the tweettj:mi(tj) =1, otherwisemi(tj) =0.
The number of markers appeared intjdivided by the total number of markers is denoted as
s(tj)and calculated using Equation2.1.
S(tj) =∑imi(tj)
k (2.1)
The flu–score of the daily tweet corpus f(τ,M)equals to the sum of all the flu–score
of the tweetss(tj)of that day divided by the total number of the tweetsn(Equation2.2).
f(τ,M) = ∑js(tj)
n =
∑j∑imi(tj)
k×n (2.2)
An extension was made to the previous model in order to make a better prediction of
Health Protection Agency (HPA) flu rate by adding weightwito each markermi(Equation
Sw(tj) =∑iwi×mi(tj)
k (2.3)
Then, the weighted flu scores of all tweets of a day is summed up to get the weighted
flu–score of the daily tweet corpus fw(τ,M)(Equation2.4):
fw(τ,M) = ∑j
sw(tj)
n =
∑j∑iw×mi(tj)
k×n (2.4)
The contribution of the marker mi in the daily tweet flu–score fw is considered as
flu–subscore f(wi)(τ,mi)(Equation2.5):
fwi(τ,mi) =wi×
∑jmi(tj)
k×n (2.5)
Using the flu–subscore fwi(τ,mi), the daily tweet flu–score (Equation2.6) could be
represented as a vector of flu–subscoreFwof all the markers (keywords):
Fw= [fw1(τ,mi), ...,fwk(τ,mk)]T (2.6)
The weightswiof markersmican be learned by:
(1) Initially, the unweighted flu–score vector Fw that is the sum of unweighted flu–
subscore smoothed with 7–point moving average is found (Equation2.7).
F= [f(τ,m1), ...,f(τ,mk)]T (2.7)
(2) The least square linear regression between F from the smoothed version, F from
the expanded one, and smoothed HPA flu rate is performed.
To maximize the correlation with HPA flu rate, Vasileios Lampos et al. [69] also
proposed a method to extract the markers (keywords) automatically. This method consisted of two steps. First, a list of candidates was created by extracting them from trusted web documents related to Influenza. Second, the most informative ones were picked using
the Least Absolute Shrinkage and Selection Operator (LASSO) method that discards the redundant features of the candidates. The use of LASSO method is explained in detail in
[69].
Another machine learning technique that can be used in early trend prediction is neural network. Disease outbreaks can be predicted using Neural Network (NN) based
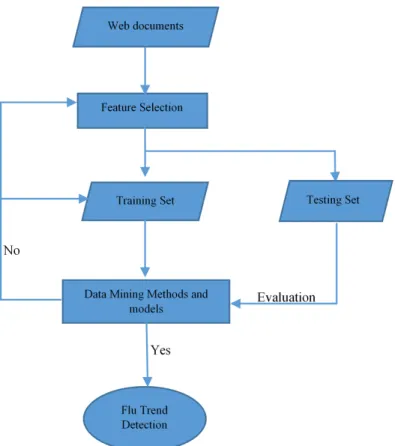
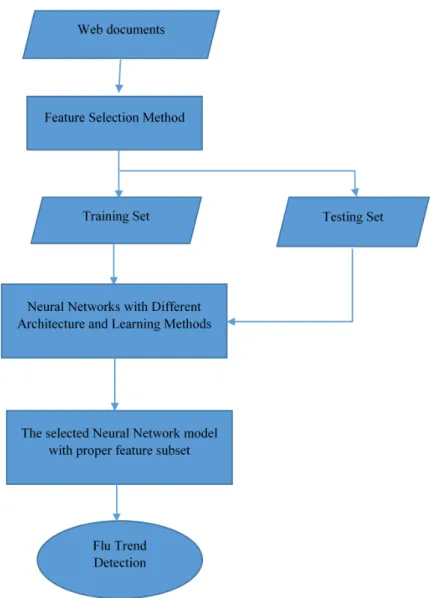
approaches to analyze web data. Wei Xu et al. [70] proposed a model to detect Influenza
outbreaks by analyzing web search queries using a neural network approach. Figures 2.4
and 2.5 show an overview of their proposed approach. This approach consists of several
steps. The first step is to collect data from search engine queries and ILI data from the CDC. The second step is to select features automatically by reducing the dimension of the query and keeping only the most important features. The third step is to find the relationship between the Influenza Like Illness (ILI) and web data (query data) using different NN with different algorithms and architectures to measure the fitness values. The NN used with this model are: NN–GDX (Gradient descent with momentum and adaptive learning rate back propagation), NN–OSS (One–step secant back propagation), and NN–RP (Resilient back propagation). The 10–fold cross validation method is used to validate the different NN algorithms. The fourth step is to select the best NN as a detector using the cross validation method. The fifth step is to use the selected NN (detector) with the best features subset to predict flu activities. The accuracy (ACC) of the results of each NN is measured using
Equation2.8. IfAiare the actual values,Dithe detection values, andNthe number of given
pairs(Ai,Di), then ACC= 1 N N
∑
i=1 Di Ai (2.8) Results show that NN–RP was the best to be used for Influenza detection. NN–RP had the best average of ACC values.Figure 2.4: A framework for Influenza outbreak detection
2.3.4.3 Naïve Bayes
Kenny Byrd, et al. [71] proposed a framework based on Naïve Bayes classifier. The
framework consisted of several steps. The first step was tweets collection with a location filter. The collected tweets were from Oct. 27 to Nov. 30 of 2015. The dataset included a total of 1,848,130 tweets. The used location filter was provided as latitudes and longi-tudes pairs (a comma separated list) to specify a bounding box of a required area. The Google Maps Developer tool was used to determine the bounding boxes of the required areas (cities). For this study, the used location was the area of Ottawa and its surrounding
Figure 2.5: The process of Neural Networks based detection
areas. The second step was flu–related tweets filtration. The used keywords for the filtra-tion process were "sick", "flu" and "cough". The total of filtered tweets were 4,696 posts. The third step was pre–processing which included: stop words elimination, URL’s remov-ing, words stemmremov-ing, and retweets removing. The fourth step was sentiment analysis by applying machine learning techniques for classification (positive, negative, neutral). Three machine learning algorithms were evaluated, and this study found that the highest accuracy method was the Naïve Bayes classifier. The Naïve Bayes classifier was implemented
us-ing the Stanforn core NLP (Natural Language Processus-ing) and trained usus-ing the OpenNLP training dataset which includes 100 annotated tweets. The sentiment analysis is considered accurate when there is a matching between the predicted sentiment polarity with the man-ual assigned opinion of the sentiment. The authors found that Naïve Bayes was the most accurate one with 70% matching.
2.3.4.4 Prediction Market Using Support Vector Machine
Re-gression Algorithm (SVR)
The prediction market is a mechanism that can be used for future prediction based on
creatingshares for an event. People can trade these shares with prices determined by the
market. The prices can be used as probability of the event occurrence. This is considered as one of the optimal prediction solutions, and it is less expensive than other prediction methods. Disease outbreak can be predicted using the prediction market together with the
Support Vector Machine regression algorithm (SVR) using share prices [72]. Joshua
Ritter-man et al. [72] have shown that the prediction of swine flu in 2009 was more accurate when
adding some features extracted from Social Networking Sites to the SVR. The prediction market is modeled in two different ways: internal market and external market.
Internal Market The internal market is based on time series. It uses historical prices for
today’s price prediction. Technically, the prediction for a given dayFnis achieved by using
the average price of the previous dayAvgPn−1divided by the sum of the average prices for
the previous 5 days (Equation2.9).
Fn= AvgPn−1
∑6i=2AvgPn−i
(2.9) The SVR is trained using extra features. The first feature is to use the Short–Term
history featureF(n) =AvgP(n−1)that is the average price of the previous day. It gives a
that is the moving average price, calculated using Equation2.9. This determines a longer period than the first feature. The third extra feature is the Long–Term feature that is the
sum of a vector of binary valuesM, as shown in Equation2.10. The Long–Term feature is
used to indicate the market direction for a long time.
F(n) = n−1
∑
i=0 Mi,Mi= Mi−1+1 ifAvg(Pi)≥Avg(Pi−1) Mi−1−1 ifAvg(Pi)<Avg(Pi−1) (2.10)External Market This way of modeling considers the fundamental products of the
com-pany and the events occurring around the world. The SVR classifier is trained using social media data. By using the social media data, SVR is trained with unigram and bigram features and their frequencies using social media data (i.e. daily counts of unigrams and bigrams). No internal market is given for training. This gave lower performance compared to training with only a subset of data. For better performance, the system should be trained with only relevant data. This can be accomplished by training the SVR with unigrams and bigrams for a specific period of time based on historical context provided to the system. The length of the period is decided by the system using the historical context to determine the news cycle.
Joshua Ritterman et al. [72] have shown that combining the prediction market with
features extracted from Social Networking Sites leads to better results. This demonstrates that social media data played an important role in the 2009 swine flu trend prediction.
2.3.5 Math/Statistical Based Models
2.3.5.1 Autocorrelation Function (ACF)
ACF finds the correlation of the values of the same variables at different times
(xi,x(i+1)). Therefore, this method can be used for disease outbreak predictions. Disease
frequency of disease–content posts using ACF. It compares the averaged disease–related posts per day with the actual number of the same disease posts of that day. Courtney D
Corley et al. [73] proposed a method to track ILI in social media using ACF and to identify
possible web and social media communities [73]. This method tracks a sudden high
fre-quency of flu–content posts using ACF. The method defines a seven-day period as a period cycle for better accuracy and anomaly detection. The period starts on Sundays and ends on Saturdays.
The results of this methodology showed strong correlation with CDC reports. The
Pearson Correlation coefficient is used for evaluation. The value of r was 0.767 with a
confidence level of 95%.
Web Social Media (WSM) community identification and analysis was used as a part of their methodology for better results by using link analysis. Link analysis was also used to identify the first responder or influential user of a community. Only the links between flu posts are considered. The links between a flu–related post and non-flu-related post are not considered in the defined community. Closeness, Betweenness and Page Rank measures were used to rank flu communities to tell how a blog’s influence disseminates flu informa-tion. Blogs with high closeness and page rank can spread flu–information (response) more quickly.
Closeness It is used to find the average of the shortest paths between actorvand the other
reachable actors. It is defined as shown in Equation2.11[74]. Letiand jbe actors,d(i,j)
be the distance function that finds the number of geodesics betweeniand j, and∑Nj=1d(i,j)
be the total distance ofifrom all other actors. Closeness is defined as follows:
Cc(i) = " N
∑
j=1 d(i,j) #−1 (2.11)Betweenness It measures how a blog is central among other blogs. It is defined as shown
in Equation2.12 [74]. Letgjk be the number of geodesics between jandk, andgjk(i)be
the number of geodesics between j andkthat contain actor i. Betweenness is defined by
the following formula:
CB(i) =
∑
j<kgjk(i)
gjk (2.12)
Page Rank It is an eigenvector centrality that measures the importance of a node. It is
defined as shown in Equation 2.13 [73]. Let d=0.85 be a factor, where the pages are
represented using the symbolPn, the set of pages linked toPnis represented usingM(pn),
and the out links on page Pj is represented usingL(pj). Page Rank relationship is shown
as follows: Rpn= 1−d N +d
∑
p j∈M(pn) PR(pj) L(Pj) (2.13)2.3.5.2 Auto Regression Moving Average (ARMA)/SNEFT
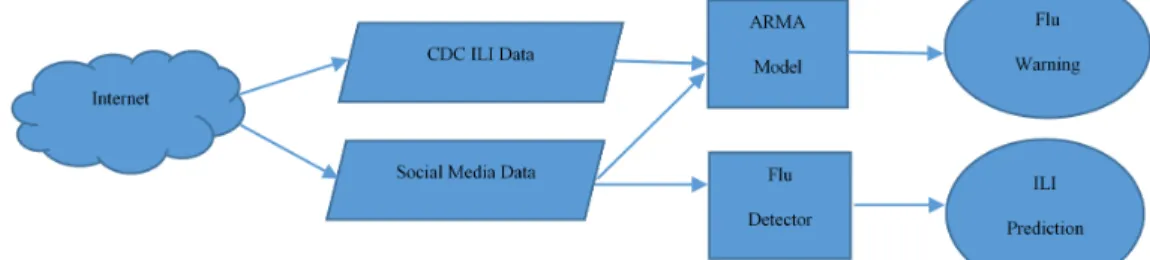
ARMA is a stochastic model that is composed of two forms: Auto Regression (AR) model and Moving Average (MA) model. The AR model is a prediction model. Its output depends linearly on the past values, a random value as an error, and a constant value. The MA model is used to represent the correlation between the past values and the white noise using linear regression.Based on the ARMA model, Harshvardhan Achreckar et al. [40] proposed a
frame-work called Social Netframe-work Enabled Flu Trends (SNEFT) that utilizes the ARMA model and the data obtained from CDC. Both are used in collaboration for better flu prediction
trends. The architecture of the SNEFT framework is shown in Figure2.6. The architecture
Illness (ILI) using CDC data. The second part is used to provide flu warnings using Twitter data. The Auto regression Moving Average (ARMA) model is used to predict ILI incidence as a linear function of current and old Social Network data and historical ILI data (CDC data). The results indicated that Twitter data improved the output of the statistical models that were used for prediction. The SNEFT framework was tested with and without Twitter data together with CDC reports. The study has found that the Twitter data improved the accuracy of the prediction model. Based on the authors’ findings, it is clear that Twitter could provide real time measurement of Influenza activity in the population.
Figure 2.6: SNEFT architecture
2.3.5.3 Numerical–Based Analysis
Sangeeta Grover, et al. [75] proposed a framework to detect flu outbreak with respect
to three stages of epidemics (beginning of epidemic, spread of epidemic, absence of epi-demic) using the Bag–Of–Words (BOW) technique. The BOW is a technique that learns a vocabulary from all the documents, then models each document by counting the number of times each word appears. The implementation of this framework consists of the following steps:
• Collect tweets using Twitter API.
• Build Bag–Of–Words (BOW) for each stage of epidemic (beginning of epidemic, spread of epidemic, absence of epidemic)
• Apply the Swine Epidemic Hint Algorithm (SEHA) on the tweets. The text of
a tweet is tokenized for numerical analysis. The numerical analysis checks how relevant the tweet is to the epidemic stages.
• Classify the tweets into the 3 stages of the epidemics. The classification process is
based on the numerical results from the previous step.
• Evaluate the results of this framework using 6 cross validation of Gaussian
regres-sion and prediction model. The results show that the framework was fairly accurate since the average value of the error rate was about 1.1.
2.3.6 Mechanistic disease models
Mechanistic disease models are used to provide a better understanding of any epi-demic dynamics. Unlike statistical models, the mechanistic models consider different fea-tures to estimate key epidemic parameters such as intensity and severity that impact public
health decision responses [76,77]. Within the various mechanistic models, metapopulation
models, compartmental models, and agent–based models provide information on popula-tion epidemic states and individual progress of an epidemic.
2.3.6.1 Metapopulation models
Metapopulation models, such as Global Epidemic and Mobility (GLEAM) model, are spatial, stochastic, and individual based models that can simulate the spread of epi-demic diseases at worldwide scale. The model divides the world into smaller regions defin-ing subpopulation networks and connections between the subpopulation that represent the
Qian Zhang, et al. [77] proposed a seasonal flu forecasting framework based on mechanistic disease model (GLEAM). The framework was validated and tested by compar-ing the results from the framework with the official government data in the U.S., Italy, and Spain in the 2014–2015 season and 2015–2016 season. The framework is a combination of the social media data, official surveillance data and mechanistic modeling approach. It consists of three stages. In the first stage, data from official surveillance systems and Twit-ter is used for model initialization. A set of English ILI–related tweets for a given region is used as an initial condition of relative flu incidences and as an input for the framework. The data from official surveillance systems is used to evaluate the coefficient of determi-nation of the used ILI search keywords. The second stage consists of exploring important parameters: population, infectious period and the effective reproduction number (number of infected individuals in a region). The third stage is parameter selection and prediction. The study has shown that the framework provides reliable results for epidemic intensity and peak timing up to six weeks in advance. The accuracy of the framework showed high
correlation with official surveillance data using Pearson Correlation (the highestrvalue is
0.98 for the flu prediction with one week in advance).
2.3.6.2 Compartmental models
Compartmental models define the rate at which individuals move between defined compartments and divide the population into subpopulation based on disease states. Exam-ples include Susceptible- Infectious-Recovered (SIR) and
Susceptible-Infections-Recovered-Susceptible (SIRS) [79].
Liangzhe Chen et al. [56] proposed a model called Hidden Flu–State from Tweet
Model (HFSTM) based on the concept of epidemiological compartmental models. It ana-lyzes a stream of a user’s tweets and captures the disease states and the associated transi-tions.
Jeffrey Shaman, et al. [44] proposed a framework that predicts a seasonal flu us-ing the compartmental model (SIRS) along with common used techniques in numerical weather predictions. Epidemic disease dynamics are non-linear that are similar to weather dynamics. The non-linearity of the epidemics makes the prediction systems sensitive to the initial and current conditions. Like any non-linear system, it is possible that the error rate of the system will grow with further uses that leads to inaccurate results. To overcome the growth of error rates with the non-linear systems, data assimilation techniques such as filtering are used to update and adjust the system using the latest available observations. The applied data assimilation method in the presented framework is the Ensemble Adjust-ment Kalman Filter (EAKF) method for the updating process using weekly observations obtained from Google Flu Trend (GFT). This method combines the weekly GFT observa-tions with the Susceptible Infecobserva-tions Recovered Susceptible (SIRS) model. The EAKF is a recursive filtering technique to estimate the state of the model using a combination of the observations and the evolving ensemble of the model simulations. The framework was validated and then used to perform simulation of Influenza prediction in the New York City for the 2004–2005 and 2007–2008 flu seasons. The study has shown that the proposed framework is able to predict the peak timing up to seven weeks in advance.
2.3.6.3 Agent–Based models
Agent–based models define entities (agents) that interact with each other and the sur-rounding environment based on specific rules. These models provide better understanding of the change of individual behaviors during an epidemic which help in outbreak
predic-tions [79].
Suruchi Deodhar, et al. [80] developed a large scale web application called
Flu-Caster for flu epidemic forecasting using agent–based models. This model can distinguish FluCaster from other available systems. It produces fine–grained results that helps decision
makers in performing detailed analysis. For example, filtering the results of the flu forecast by a specific location for a specific age sub–population in a specific time can be provided by this model. FluCaster was implemented using CDC surveillance data and Google Flu Trend (GFT).
2.3.7 Detection Based on Filtered Keywords and Documents
Simple flu related keywords can be used to produce accurate results with a high correlation with CDC weekly reports. The method of selecting search keywords is very important. It impacts the accuracy of the results. Selecting keywords based on correlation with national statistics may cause inaccurate results. For example, the "flu shot" term has a high correlation, but it does not necessarily reflect the spread of flu. It could be just a general discussion about it or an advertisement. Therefore, a document classifier to remove spurious matches (such as advertisements) can be used to get more accurate results
and reduce the error rates [38]. Aron Culotta [38] presented a method of correlating the
keywords with ILI rates from CDC. Let P be the ILI symptoms reported by providers,
W ={w1,w2, ...,wk} be the set of keywords, Dbe a document collection, Dw be a set of
documents that at least contain a keyword inW,B1andB2be coefficients,ebe error terms,
andQ(w,D) =|Dw|/|D|be a query fraction, then
log(P) =B1(log(Q(w,D)) +B2+e (2.14)
Removing spurious keywords such as a keyword within government announcements and advertisements may also help produce better results and improve the correlation with
ILI reports. Aron Culotta [38] also proposed a document classifier that can be used for
document filtration. It labels the messages as ILI related or not. Then, the classifier cal-culates the probability of the ILI reporting messages. This classifier should be trained
the limited memory quasi–Newton method for large scale optimization (L–BFGS). Details
of the L–BFGS method and its implementation are discussed in [81]. Let yi be a binary
random variable where (1) is a positive document and (0) otherwise,xi=
xi j be a vector
of random values where xi j is the number of times word j appears in document i, Dbe a
document collection,θ can be computed using L–BFGS gradient descent [81]
P(yi=1|xi;θ) = 1
1+e(−xi.θ) (2.15)
The filtration process was combined with regression in Equation2.14by considering
two kinds of classifying methods: soft classification and hard classification. The soft
clas-sification findsQs(W,D)of positive documents using Equation2.16. This method assigns
the probability as a weight to each matched document inDw. The hard classification finds
Qh(W,D) by considering and counting only the documents with probability of positive
class>0.5 using Equation 2.17. Afterwards, the valueQ(w,D)is substituted in Equation
2.14.
Qs(W,D) = ∑di∈DwP(yi=1|xi;θ)
|D| (2.16)
Qh(W,D) = ∑di∈Dw(P(yi=1|xi;θ)>0.5)
|D| (2.17)
The results show strong correlation for most of the picked keywords (e.g. flu, cough, sore throat, and headache). Comparing the results with another study’s results by Lampose
and Christianini (2010) [69] has shown that the results are competitive and yield less
com-plexity. This concludes that flu trends could be predicted in a population by using simple methods.