Open Access
Research article
Comparative genome mapping of the deer mouse (Peromyscus
maniculatus) reveals greater similarity to rat (Rattus norvegicus)
than to the lab mouse (Mus musculus)
Clifton M Ramsdell*
1, Adrienne A Lewandowski
2, Julie L Weston Glenn
2,
Paul B Vrana
3, Rachel J O'Neill
4and Michael J Dewey
2Address: 1Department of Genetics and the Carolina Center for Genome Sciences, University of North Carolina, Chapel Hill, North Carolina 27599, USA, 2Peromyscus Genetic Stock Center, Department of Biological Sciences, University of South Carolina, Columbia, SC 29208, USA,
3Department of Biological Chemistry, School of Medicine, University of California Irvine, Irvine, CA 92799-1700, USA and 4Department of Molecular and Cell Biology, University of Connecticut, Storrs 06269, USA
Email: Clifton M Ramsdell* - [email protected]; Adrienne A Lewandowski - [email protected]; Julie L Weston Glenn - [email protected]; Paul B Vrana - [email protected]; Rachel J O'Neill - [email protected]; Michael J Dewey - [email protected]
* Corresponding author
Abstract
Background: Deer mice (Peromyscus maniculatus) and congeneric species are the most common
North American mammals. They represent an emerging system for the genetic analyses of the physiological and behavioral bases of habitat adaptation. Phylogenetic evidence suggests a much more ancient divergence of Peromyscus from laboratory mice (Mus) and rats (Rattus) than that separating latter two. Nevertheless, early karyotypic analyses of the three groups suggest
Peromyscus to be exhibit greater similarities with Rattus than with Mus.
Results: Comparative linkage mapping of an estimated 35% of the deer mouse genome was done
with respect to the Rattus and Mus genomes. We particularly focused on regions that span synteny breakpoint regions between the rat and mouse genomes. The linkage analysis revealed the Peromyscus genome to have a higher degree of synteny and gene order conservation with the Rattus genome.
Conclusion: These data suggest that: 1. the Rattus and Peromyscus genomes more closely
represent ancestral Muroid and rodent genomes than that of Mus. 2. the high level of genome rearrangement observed in Muroid rodents is especially pronounced in Mus. 3. evolution of genome organization can operate independently of more commonly assayed measures of genetic change (e.g. SNP frequency).
Background
The cricetid genus Peromyscus constitutes the most abun-dant and speciose group of North American mammals. Though superficially similar in appearance to rats and
mice, deer mice represent a more distantly related lineage. Mouse and rat are thought to have diverged from each other ~10–12 million years ago (mya) while they last shared a common ancestor with the deer mouse (P.
man-Published: 26 February 2008
BMC Evolutionary Biology 2008, 8:65 doi:10.1186/1471-2148-8-65
Received: 18 October 2007 Accepted: 26 February 2008 This article is available from: http://www.biomedcentral.com/1471-2148/8/65
© 2008 Ramsdell et al; licensee BioMed Central Ltd.
This is an Open Access article distributed under the terms of the Creative Commons Attribution License (http://creativecommons.org/licenses/by/2.0), which permits unrestricted use, distribution, and reproduction in any medium, provided the original work is properly cited.
iculatus) lineage ~25 mya [1]. The P. maniculatus species
complex is a series of semi-interfertile populations span-ning nearly every habitat on the continent and is conse-quently an emerging tool for the study of natural mammalian genetic variation. Facilitating such research is the existence of captive stocks derived from individual populations. Utilizing two of these stocks, we have devel-oped a comparative genomic map for the deer mouse to further research of this genus and to provide insight into the genome rearrangements seen in rats, mice, and other mammals.
Comparative genomic analyses can reveal substantial amounts of information about the biology and evolution of species and are one of the keys to deciphering the roles that genomic structure and organization play in areas such as development, gene expression, and speciation. These analyses, however, are limited to portions of the genomes that have been mapped in all the species being compared and may be compromised by uncertainty of gene orthology and order between any two species. Although whole-genome sequences are available for many species, proper genome annotation is difficult and typically requires additional resources (e.g. meiotic link-age and radiation hybrid cell maps) [2]. As a result, both cytogenetic methods and genetic linkage mapping are still essential tools for the analysis of genomic organization. While cytogenetic methods are effective for discerning large regions of chromosomal homology and conserved synteny, linkage maps are able to detect rearrangements of gene order within these fragments and pinpoint the loca-tions of synteny breakpoints. Such detailed genomic com-parisons require ordered linkage maps that include orthologous Type I (gene coding) loci to provide land-marks that can be identified in the genomes of multiple species. Comparative analyses using such a combined approach may reveal many more chromosomal rearrange-ments and novel synteny groups.
Two of the most complete mammalian genomic maps are associated with the most used biomedical models, the rat (Rattus norvegicus) and mouse (Mus musculus), which both belong to the rodent family Muridae. Rodentia is the larg-est mammalian order, containing > 2000 of the ~4600 recognized species and the murids constitute the majority of these [3]. Murid genomes analyzed to date not only show more rapid nucleotide mutation rates [1,4] but also higher rates of chromosomal rearrangement than other mammals. Murid chromosomal divergence rates are esti-mated to be one rearrangement per million years; ten times the rate for most mammalian genomes [5,6]. Fur-thermore, such events are punctuated over time rather than having a steady-state mutation pattern [7]. This ele-vated rate of rearrangement has resulted in greater
karyo-typic divergence between rat and mouse than between much more distantly related species (e.g., humans vs. domestic cats) [8] and has hampered reconstructions of ancestral rodent and mammalian genomes [9-12]. As a result, interpreting the evolutionary trajectory of chromo-some segments between these model organisms and humans has proven difficult [13]. An outgroup to the two mapped murid genomes that is less divergent than human could alleviate these problems by aiding in the construc-tion of a more accurate ancestral rodent genome.
Here we describe the initial results of the first intermedi-ate-density comparative genomic map for the deer mouse covering an estimated 35% of the deer mouse genome. These data suggest the deer mouse genomic organization more closely resembles that of rat than mouse, despite the much more recent common ancestor shared by the latter two species. Considered with cytogenetic data [14] and ancestral karyotype reconstructions [10,12], our analysis further suggests that the deer mouse and Rattus genomes have undergone fewer large scale rearrangements than
Mus.
Results and Discussion
Design
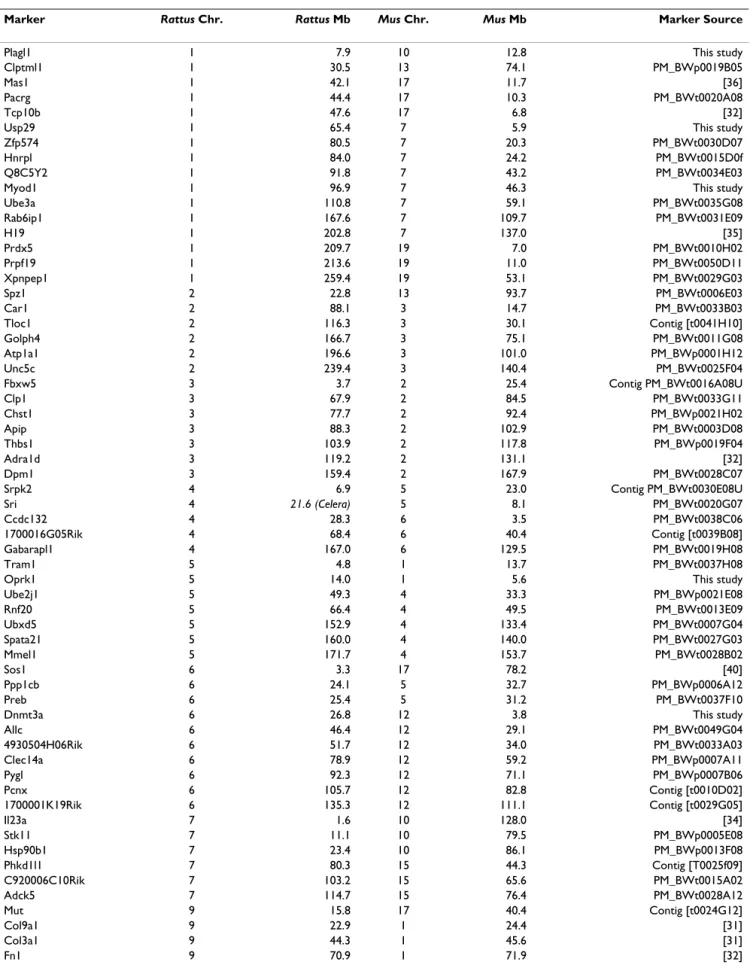
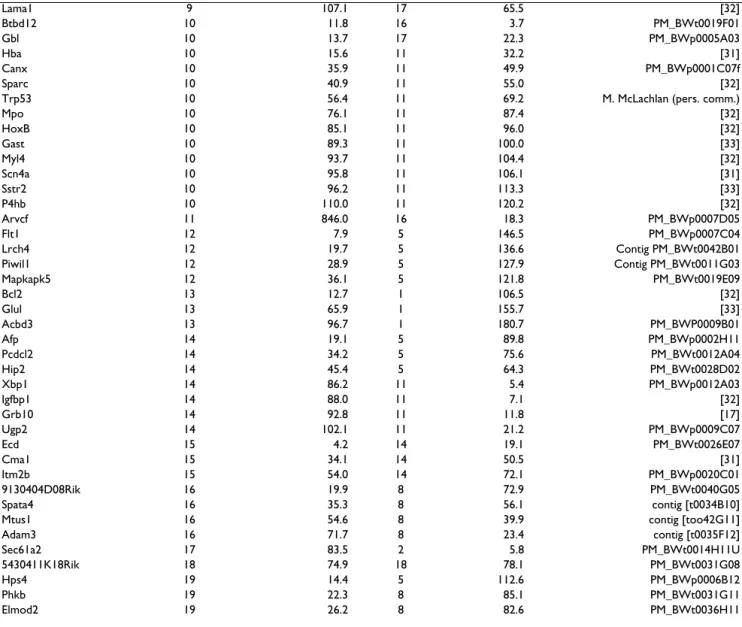
We employed a standard backcross design for these stud-ies utilizing P. maniculatus bairdii stock derived from Washtenaw Co. MI (BW) and P. polionotus stock derived from Ocala Nat'l forest in Florida (PO). While neither population is completely inbred, both originated from a limited number of founders and have been maintained as closed colonies. Thus, identifying fixed differences between the two (e.g., SNPs) was typically not difficult. Map construction for P. maniculatus was conducted using both the Rattus and Mus maps as references [15,16] and using assays designed to span rat-mouse synteny break-points. We use the term breakpoint when referring to a break between linkage groups as defined by Pevzner and Tesler [13]. In all, we have genotyped 103 Type I gene markers from 18 different Rattus chromosomes on our backcross panels. Table 1 presents the complete list of markers used in our mapping study, their respective loca-tions in the mouse and rat genomes, and the source of the primer sequences. The figures presented here though, focus on the markers around the breakpoint regions between Mus and Rattus genomes that are informative for this comparative analysis.
Our backcross panels facilitated linkage of markers at dis-tances ranging from 1.2 cM to 35.8 cM. There are a few instances, however, where marker co-segregation occurs. These may be due to recombination "cold-spots", seg-mental inversions between the BW and PO strains, or
sim-Table 1: Markers utilized in this study, their positions in the Rattus and Mus genomes, and their source.
Marker Rattus Chr. Rattus Mb Mus Chr. Mus Mb Marker Source
Plagl1 1 7.9 10 12.8 This study
Clptml1 1 30.5 13 74.1 PM_BWp0019B05
Mas1 1 42.1 17 11.7 [36]
Pacrg 1 44.4 17 10.3 PM_BWt0020A08
Tcp10b 1 47.6 17 6.8 [32]
Usp29 1 65.4 7 5.9 This study
Zfp574 1 80.5 7 20.3 PM_BWt0030D07
Hnrpl 1 84.0 7 24.2 PM_BWt0015D0f
Q8C5Y2 1 91.8 7 43.2 PM_BWt0034E03
Myod1 1 96.9 7 46.3 This study
Ube3a 1 110.8 7 59.1 PM_BWt0035G08 Rab6ip1 1 167.6 7 109.7 PM_BWt0031E09 H19 1 202.8 7 137.0 [35] Prdx5 1 209.7 19 7.0 PM_BWt0010H02 Prpf19 1 213.6 19 11.0 PM_BWt0050D11 Xpnpep1 1 259.4 19 53.1 PM_BWt0029G03 Spz1 2 22.8 13 93.7 PM_BWt0006E03 Car1 2 88.1 3 14.7 PM_BWt0033B03 Tloc1 2 116.3 3 30.1 Contig [t0041H10] Golph4 2 166.7 3 75.1 PM_BWt0011G08 Atp1a1 2 196.6 3 101.0 PM_BWp0001H12 Unc5c 2 239.4 3 140.4 PM_BWt0025F04 Fbxw5 3 3.7 2 25.4 Contig PM_BWt0016A08U Clp1 3 67.9 2 84.5 PM_BWt0033G11 Chst1 3 77.7 2 92.4 PM_BWp0021H02 Apip 3 88.3 2 102.9 PM_BWt0003D08 Thbs1 3 103.9 2 117.8 PM_BWp0019F04 Adra1d 3 119.2 2 131.1 [32] Dpm1 3 159.4 2 167.9 PM_BWt0028C07 Srpk2 4 6.9 5 23.0 Contig PM_BWt0030E08U Sri 4 21.6 (Celera) 5 8.1 PM_BWt0020G07 Ccdc132 4 28.3 6 3.5 PM_BWt0038C06 1700016G05Rik 4 68.4 6 40.4 Contig [t0039B08] Gabarapl1 4 167.0 6 129.5 PM_BWt0019H08 Tram1 5 4.8 1 13.7 PM_BWt0037H08
Oprk1 5 14.0 1 5.6 This study
Ube2j1 5 49.3 4 33.3 PM_BWp0021E08 Rnf20 5 66.4 4 49.5 PM_BWt0013E09 Ubxd5 5 152.9 4 133.4 PM_BWt0007G04 Spata21 5 160.0 4 140.0 PM_BWt0027G03 Mmel1 5 171.7 4 153.7 PM_BWt0028B02 Sos1 6 3.3 17 78.2 [40] Ppp1cb 6 24.1 5 32.7 PM_BWp0006A12 Preb 6 25.4 5 31.2 PM_BWt0037F10
Dnmt3a 6 26.8 12 3.8 This study
Allc 6 46.4 12 29.1 PM_BWt0049G04 4930504H06Rik 6 51.7 12 34.0 PM_BWt0033A03 Clec14a 6 78.9 12 59.2 PM_BWp0007A11 Pygl 6 92.3 12 71.1 PM_BWp0007B06 Pcnx 6 105.7 12 82.8 Contig [t0010D02] 1700001K19Rik 6 135.3 12 111.1 Contig [t0029G05] Il23a 7 1.6 10 128.0 [34] Stk11 7 11.1 10 79.5 PM_BWp0005E08 Hsp90b1 7 23.4 10 86.1 PM_BWp0013F08 Phkd1l1 7 80.3 15 44.3 Contig [T0025f09] C920006C10Rik 7 103.2 15 65.6 PM_BWt0015A02 Adck5 7 114.7 15 76.4 PM_BWt0028A12 Mut 9 15.8 17 40.4 Contig [t0024G12] Col9a1 9 22.9 1 24.4 [31] Col3a1 9 44.3 1 45.6 [31] Fn1 9 70.9 1 71.9 [32]
ply the interval distance may be below our mapping panel resolution.
Mapping of loci from Rattus Chrs 10 and 14
Our previous analysis of the Peromyscus genome using loci from Mus Chr 11 [17] indicated that there are two separate deer mouse linkage groups. ZOO-FISH data by Mlynarski et al. (submitted, BMC Evolutionary Biology) also sup-ported this conclusion. These linkage groups correspond to Rattus Chrs 10 and 14 and the resulting chromosomal breakpoint is shared with the Rattus genome relative to the Mus genome (Figure 1). This breakpoint is also shared in other species, including human, chimpanzee, dog, and pig [11,18]. This conserved similarity led us to consider whether the deer mouse genome might share a higher degree of chromosomal similarity with Rattus than to Mus.
To explore this possibility, we expanded the existing link-age groups using loci whose orthologs lie on Rattus Chrs 10 and 14 but are not located on Mus Chr 11 (Figure 1). For the Rattus Chr 10 homology group, we generated markers for Btbd12 and Gbl, which correspond to regions of Mus Chr 16 and 17, respectively. Single loci for each segment were sufficient because the Mus Chrs 16 and 17 segments are small and most of Rattus Chr 10 is homolo-gous with Mus Chr 11. We found both markers to be clearly linked to the terminal locus from Rattus Chr 10,
Xbp1, with very high LOD scores (>30) indicating rat
genome homology. However, all three markers co-segre-gated. At a distance of only 1.9 Mb in the Rattus genome, these markers are likely to be closer in the deer mouse than our panel is able to resolve.
Lama1 9 107.1 17 65.5 [32] Btbd12 10 11.8 16 3.7 PM_BWt0019F01 Gbl 10 13.7 17 22.3 PM_BWp0005A03 Hba 10 15.6 11 32.2 [31] Canx 10 35.9 11 49.9 PM_BWp0001C07f Sparc 10 40.9 11 55.0 [32]
Trp53 10 56.4 11 69.2 M. McLachlan (pers. comm.)
Mpo 10 76.1 11 87.4 [32] HoxB 10 85.1 11 96.0 [32] Gast 10 89.3 11 100.0 [33] Myl4 10 93.7 11 104.4 [32] Scn4a 10 95.8 11 106.1 [31] Sstr2 10 96.2 11 113.3 [33] P4hb 10 110.0 11 120.2 [32] Arvcf 11 846.0 16 18.3 PM_BWp0007D05 Flt1 12 7.9 5 146.5 PM_BWp0007C04 Lrch4 12 19.7 5 136.6 Contig PM_BWt0042B01 Piwil1 12 28.9 5 127.9 Contig PM_BWt0011G03 Mapkapk5 12 36.1 5 121.8 PM_BWt0019E09 Bcl2 13 12.7 1 106.5 [32] Glul 13 65.9 1 155.7 [33] Acbd3 13 96.7 1 180.7 PM_BWP0009B01 Afp 14 19.1 5 89.8 PM_BWp0002H11 Pcdcl2 14 34.2 5 75.6 PM_BWt0012A04 Hip2 14 45.4 5 64.3 PM_BWt0028D02 Xbp1 14 86.2 11 5.4 PM_BWp0012A03 Igfbp1 14 88.0 11 7.1 [32] Grb10 14 92.8 11 11.8 [17] Ugp2 14 102.1 11 21.2 PM_BWp0009C07 Ecd 15 4.2 14 19.1 PM_BWt0026E07 Cma1 15 34.1 14 50.5 [31] Itm2b 15 54.0 14 72.1 PM_BWp0020C01 9130404D08Rik 16 19.9 8 72.9 PM_BWt0040G05 Spata4 16 35.3 8 56.1 contig [t0034B10]
Mtus1 16 54.6 8 39.9 contig [too42G11]
Adam3 16 71.7 8 23.4 contig [t0035F12] Sec61a2 17 83.5 2 5.8 PM_BWt0014H11U 5430411K18Rik 18 74.9 18 78.1 PM_BWt0031G08 Hps4 19 14.4 5 112.6 PM_BWp0006B12 Phkb 19 22.3 8 85.1 PM_BWt0031G11 Elmod2 19 26.2 8 82.6 PM_BWt0036H11
* Mb denotes the physical position in megabases on the Rattus and Mus chromosomes [15, 16]. ** Markers beginning in PM_BW or contig are EST clones developed at the Peromyscus Genetic Stock Center (Weston Glenn et al., submitted BMC Genomics).
Using a similar strategy, we also expanded the Rattus Chr 14 homology group using two loci from Mus Chr 5 that have orthologs on Rattus Chr 14, Afp and Hip2. Similar to both Rattus and Mus genomes, Afp and Hip2 are linked in the deer mouse at a distance of 33.6 cM (LOD = 4.4) (Fig-ure 1). Similar only to the Rattus genome though, we found linkage in the deer mouse between Hip2 and the
Mus Chr 11 marker Xbp1 at a distance of 19.0 cM (LOD =
11.1) (Figure 1). The marker intervals for this group were larger than those of the Rattus Chr 10 markers and allowed us to map 83.0 Mb (~82%) of Rattus Chr 14 in the deer mouse with only a few markers. Our results again show a greater similarity between Peromyscus genome organization and the Rattus genome than either to the Mus genome.
The high degree of Rattus genome similarity that we found for these two deer mouse linkage groups warranted
exam-ination of additional informative regions where synteny breakpoints occur between the Mus and Rattus genomes. While not comprehensive for every chromosome, this strategy accelerated our examination of chromosome evo-lution for the deer mouse genome and helped determine the best reference genome for future deer mouse genome mapping.
Mapping the Informative Regions of Rattus Chr 1
We next chose markers that spanned Rattus Chr 1, focus-ing our efforts within the regions surroundfocus-ing the break-points between Mus Chrs 7, 17, 10, and 19 (Figure 2).
Comparison of the organization of genes on Rattus Chr 1, and Mus Chrs 7, 10, 17, and 19, with the linkage of their orthologous genes in Peromyscus
Figure 2
Comparison of the organization of genes on Rattus Chr 1, and Mus Chrs 7, 10, 17, and 19, with the linkage of their orthologous genes in Peromyscus. The break in the continuity of the Peromyscus linkage groups indicates a lack of detectable linkage between the groups.
Comparison of the organization of genes on Rattus Chrs 14 and 10, and Mus Chrs 5, 11, 16, and 17, with the linkage of their orthologous genes in Peromyscus
Figure 1
Comparison of the organization of genes on Rattus Chrs 14 and 10, and Mus Chrs 5, 11, 16, and 17, with the linkage of their orthologous genes in Peromyscus. The break in the con-tinuity of the Peromyscus linkage groups indicates a lack of detectable linkage between the groups.
Within the Mus Chr 17 homology segment, we estab-lished linkage between Tcp10b and Pacrg at 3.6 cM and between Pacrg and Mas1 at 2.3 cM with LOD scores of 19.4 and 21.8, respectively. These distances are concord-ant with those for both the Rattus and Mus genomes. We had also previously shown linkage between Tcp10b and
Mas1 using the deer mouse radiation hybrid panel [17].
We then genotyped the Mus Chr 10 marker Plagl1 to test for linkage to the Mus Ch17 markers and found Mas1 to be linked at a distance of 21.2 cM (LOD = 7.1). This link-age conservation is again consistent with the Rattus genome but not with Mus.
We next tested for linkage between the Mus Chr 17 and
Mus Chr 7 homology segments of Rattus Chr 1 and found
no linkage in Peromyscus between any Mus Chr 17 markers and the Mus Chr 7 marker Usp29, which is only 17.8 Mb away on Rattus Chr 1. We made no further efforts to extend the Mus Chr 7 linkage group, as Usp29 is only 5.93 Mb from the centromeric end of Mus Chr 7 and additional markers in this region were unlikely to yield a different result. We also tested for linkage between the Mus Chr 17 marker Mas1 and the Mus Chr 7 markers Usp29 and Myod1 on a PO × PO/BW backcross panel. This was to ensure that our negative linkage results were not a result of aberrant interspecific chromosomal recombination in the BW × BW/PO panel. Again, Mas1 did not link to either locus. The lack of linkage between Mus Chr 17 and Mus Chr 7 homology segments in the deer mouse genome consti-tuted the first example of a common breakpoint between the deer mouse and Mus genomes when compared to
Rat-tus.
Although uninformative for our comparative rearrange-ment analyses, we established linkage homology in the deer mouse for the large (~130 Mb) Mus Chr 7 section of
Rattus Chr 1 using five markers: Usp29, Q8C5Y2, Ube3a, Rab6ip1, and H19. Althoughthe RIKEN cDNA marker Q8C5Y2 has not been accurately mapped in either Rattus
or Mus, BLAST results indicated intervals between
Q8C5Y2 and Usp29 at 26.4 Mb for the Rattus genome and
37.3 Mb in the Mus genome. In support of our placement, the Mus Chr 7/Rattus Chr 1 marker Ube3a co-segregated with Q8C5Y2 in the deer mouse. Our data for these five
Mus Chr 7 markers showed high conservation of linkage
and gene order with both Rattus and Mus genomes (Figure 2) with LOD scores all well above the 3.0 threshold. Our results for the Mus Chr 7 region were also concordant with a previous study [19] from which we utilized two of the same markers, Usp29 and H19.
We also found genome homology between Rattus and the deer mouse genome by markers spanning the breakpoint between the Mus Chr 7 and Chr 19 regions of Rattus Chr 1. The Mus Chr 7 marker H19 is linked to the Mus Chr 19
marker Prdx5 at a distance of 6.5 cM (LOD = 12.2). Prdx5 is also linked to a second Mus Chr 19 marker Prpf19 at a distance 4.9 cM (LOD = 13.4 cM).
Overall, our data for Rattus Chr 1 loci show that the two deer mouse linkage groups span two Mus genome break-points but only one Rattus genome breakpoint, which shows a continued bias towards similarity with the Rattus genome. Our results also imply that the Mus genome has been more rearranged in this region.
Breakpoint Mapping of Rattus Chr 4 and Chr 6 Loci
To broaden the scope of the deer mouse map and help reduce bias resulting from any localized phenomenon such as segmental inversions, we acquired data for mark-ers from multiple Rattus chromosomes. Rattus Chrs 4 and 6 were priority candidates because of the simple break-point arrangements and well-conserved gene orders between Rattus and Mus.
Rattus Chr 4 is represented by the entirety of Mus Chr 6
and approximately 30 Mb of the centromeric end of Mus Chr 5. To test for a conserved organization in the deer mouse genome, we typed two markers from each side of the breakpoint on our backcross panel (Figure 3). We
Comparison of the organization of genes on Rattus Chr 4, and Mus Chrs 5 and 6, with the linkage of their orthologous genes in Peromyscus
Figure 3
Comparison of the organization of genes on Rattus Chr 4, and Mus Chrs 5 and 6, with the linkage of their orthologous genes in Peromyscus.
found the two Mus Chr 5 markers, Srpk2 and Sri, are linked to each other at 1.2 cM (LOD = 22.0) and the two
Mus Chr 6 markers, Ccdc132 and 1700016G05Rik, are
linked to each other at a distance of 7.6 cM (LOD = 14.8). Spanning the breakpoint, we found that Sri and Ccdc132 are linked to each other at a distance of 13.3 cM (LOD = 10.3). Overall, our results span about 30% of Rattus Chr 4 and show conservation of the Rattus gene order. However, the linkage between Sri and Srpk2 was shorter than expected and may be due to a recombination cold-spot, an interspecific inversion, or a deletion.
Our mapping of Rattus Chr 6 loci consisted of ten mark-ers: Sos1, Ppp1cb, Preb, Dnmt3a, Allc, 493504H06Rik, Pygl,
Clec14a, Pcnx, and 1700001K19Rik. These markers span Mus chromosomes 17, 5, and 12 and our results yielded
two separate linkage groups (Figure 4). The deer mouse linkage group homologous to the centromeric end of
Rat-tus Chr 6 consists of five loci and represents three different
chromosomes in Mus. This group is conserved in both synteny and gene order with the Rattus genome. From Mus Chr 17, Sos1 is linked to the Mus Chr 5 marker Ppp1cb at a distance of 11.0 cM (LOD = 12.6). Within the Mus Chr 5 segment, Ppp1cb is linked to Preb at a distance of 6.1 cM (LOD = 16.8). A second Mus breakpoint is spanned by the linkage between Preb and the Mus Chr 12 marker Dnmt3a at a distance of 5.2 cM (LOD = 16.4). Also from Mus Chr 12, Allc represents the terminal marker and links to
Dnmt3a at an interval of 16.5 cM (LOD = 7.6).
The five remaining markers from Mus Chr 12 form a sec-ond linkage group in Peromyscus. Although synteny with both Rattus Chr 6 and Mus Chr 12 is conserved, we discov-ered an inversion with respect to both Mus and Rattus involving markers Clec14a and Pygl (Figure 4). Defining this inversion, Pygl is linked to 493504H06Rik at a dis-tance of 4.2 cM (LOD = 9.2) while Clecl4a is linked to the more telomeric marker Pcnx at a distance of 18.2 cM (LOD = 6.3). We also found that Clec14a and Pygl have smaller distance interval at 1.3 cM (LOD = 21.2) than would have been expected from the physical intervals in
Mus (11.9 Mb) and Rattus (13.4 Mb). Forming the end of
the linkage group, Pcnx was linked to 1700001K19Rik at a distance of 25.3 cM (LOD = 3.9).
The spanning of two Mus genome breakpoints by the deer mouse linkage groups again indicates a more Rattus-like genome organization. However, the breakpoint between the two Peromyscus linkage groups flanked by the two Mus Chr 12 markers Allc and 493504H06Rik represents a unique rearrangement that differs from both the Rattus and Mus genomes. ZOO-FISH results from Mlynarski et al. (submitted, BMC Evolutionary Biology) also concur that Rattus Chr 6 is indeed represented by two separate chromosomes in the deer mouse.
Mapping Loci from Mus Chr 1/Rattus Chrs 5, 9, and 13
To avoid possible bias towards finding only Rattus genome similarity, we also selected markers to span Rattus synteny breakpoints in relation to the Mus genome. This involved markers that span approximately 89% of Mus Chr 1 but are located separately in Rattus on Chrs 5, 9, and 13 (Figure 5). With exception of the Rattus Chr 9 marker
Col9a1, we found linkage between all of the markers
within their Rattus chromosome homology groups but not between them, indicating a bias toward Rattus genome similarity.
For the Rattus Chr 5 region, we detected non-segregating linkage between Oprk and Tram in the deer mouse with a strong LOD score of 20.8. To further investigate Rattus genome homology, we employed a third Rattus Chr 5 marker, Ube2j1, which is located on Mus Chr 4. Consistent with Rattus genome organization, Ube2j1 linked strongly (LOD = 23.5) but without segregation to Oprk1 and Comparison of the organization of genes on Rattus Chr 6, and Mus Chrs 5, 12, and 17, with the linkage of their ortholo-gous genes in Peromyscus
Figure 4
Comparison of the organization of genes on Rattus Chr 6, and Mus Chrs 5, 12, and 17, with the linkage of their ortholo-gous genes in Peromyscus. The break in the continuity of the
Peromyscus linkage groups indicates a lack of detectable
Tram1, despite a distance 35.3 Mb in the Rattus genome
between Ube2j1 and Oprk1.
At the telomeric end of Mus Chr 1, we detected linkage between the Rattus Chr 13 markers Acbd3 and Glul at a dis-tance of 21.2 cM (LOD = 9.6) and between Glul and Bcl2 at 35.8 cM (LOD = 3.8) (Figure 5). However, we did not detect linkage between Bcl2 and the Mus Chr 9 marker
Fn1, as would be expected by Mus genome homology.
Amongst the Rattus Chr 9 markers, we found Col3a1 and
Fn1 were linked at a distance of 18.8 cM (LOD = 10.3).
However, Col3a1 is surprisingly not linked to Col9a1, which represents a deviation from the Rattus genome. To confirm these results, we also tested Mut, a marker that is closely linked to Col9a1 on Rattus Chr 9 (Figure 6). Mut is located 7.13 Mb from Col9a1 on Rattus Chr 9 but in Mus is located separately on Chr 17. Mut did not link to Col3a1 but did co-segregate with Col9a1 (LOD = 12.0), thus iden-tifying a linkage similarity between the Rattus and deer mouse genomes. The breakpoints present in the deer mouse and Mus maps for this region are offset and may represent breakpoint area re-usage and a rearrangement hotspot [13]. However, more detailed mapping using markers located between Col9a1 and Col3a1 on Rattus Chr 9 are needed to refine the breakpoint location. We discov-ered additional Rattus Chr 9 similarity using the marker
Lama, which represents a second and separate region of Mus Chr 17 than that of Mut (Figure 6). We found Lama1
and Fn1 are linked in the deer mouse at a distance of 32.7 cM (LOD = 4.7).
Comparison of the organization of genes on Rattus Chr 9, and Mus Chrs 1 and 17, with the linkage of their orthologous genes in Peromyscus
Figure 6
Comparison of the organization of genes on Rattus Chr 9, and Mus Chrs 1 and 17, with the linkage of their orthologous genes in Peromyscus. The break in the continuity of the
Pero-myscus linkage groups indicates a lack of detectable linkage
between the groups. Comparison of the organization of genes on Rattus Chrs 5, 9,
and 13, and Mus Chrs 1 and 4 with the linkage of their orthologous genes in Peromyscus
Figure 5
Comparison of the organization of genes on Rattus Chrs 5, 9, and 13, and Mus Chrs 1 and 4 with the linkage of their orthologous genes in Peromyscus. The break in the continuity of the Peromyscus linkage groups indicates a lack of detectable linkage between the groups.
Mapping Loci from Mus Chr 8/Rattus Chrs 16, 17, and 19
As another test of Peromyscus genome homology to Mus, we performed an analysis using six loci from Mus Chr 8 that form two linkage groups in the Rattus genome (Figure 7). We selected markers in each group that are less than 20.Mb apart in the Rattus genome to facilitate deer mouse linkage detection. Additionally, the two markers that flank the breakpoint, 9130404H06Rik and Elmod2, are about 16.0 Mb apart in Mus, which is well within the range of our mapping panel.
As with the Mus Chr 1 analysis, we found linkage with highly significant LOD scores but only within the individ-ual Rattus chromosomal groups, not between them. For the Rattus Chr 16 segment, Adam3 and Mtus1 are linked at distance of 8.4 cM (LOD = 14.8) and Mtus1 is linked to
Spata4 at a distance of 16.9 cM (LOD = 9.3). Spata4 is also
linked to the terminal marker 9130404D08Rik at a dis-tance of 7.0 cM (LOD = 16.4). The two markers from
Rat-tus Chr 19, Elmod2 and Pmfbp1, are linked 10.3 cM (LOD
= 12.5).
Based on suggestions from ZOO-FISH results (Mlynarski et al., submitted BMC Evolutionary Biology), we also examined an additional chromosomal segment for link-age. Representing Rattus Chr 17 and Mus Chr 2, Sec61a2 links to the Rattus Chr 19/Mus Chr 8 marker Pmfbp1 at a distance of 30.1 cM (LOD = 3.7). This linkage indicates a clear deviation from both the Rattus and Mus genomes by the deer mouse genome and highlights the benefit of per-forming cytogenetic analyses in tandem with meiotic link-age mapping.
Linkage Testing of Mus Chrs 17, 5, and 13 Loci
We performed additional tests for Mus genome similarity within the deer mouse using loci from Mus Chrs 17, 5, and 13 (Figures 8, 9, and 10). These results also came out neg-ative for Mus genome similarity. Mus chromosomes 17 and 5 are two of the most rearranged chromosomes in the
Mus genome compared to the Rattus genome. Mus Chr 17
and has seven different regions representing five different
Rattus chromosomes (Figure 8) and Mus Chr 5 has four
major regions representing four Rattus chromosomes and three very small segments representing three additional
Rattus chromosomes (Figure 9). Positive linkage results
for these highly rearranged chromosomes in the deer
Comparison of the organization of genes on Rattus Chrs 1, 6, 9, and 10, and Mus Chr 17 with the linkage of their ortholo-gous genes in Peromyscus
Figure 8
Comparison of the organization of genes on Rattus Chrs 1, 6, 9, and 10, and Mus Chr 17 with the linkage of their ortholo-gous genes in Peromyscus. The break in the continuity of the
Peromyscus linkage groups indicates a lack of detectable
link-age between the groups. Comparison of the organization of genes on Rattus Chrs 16,
17, and 19, and Mus Chrs 2 and 8, with the linkage of their orthologous genes in Peromyscus
Figure 7
Comparison of the organization of genes on Rattus Chrs 16, 17, and 19, and Mus Chrs 2 and 8, with the linkage of their orthologous genes in Peromyscus. The break in the continuity of the Peromyscus linkage groups indicates a lack of detectable linkage between the groups.
mouse would have been a strong indicator of Mus homol-ogy.
For Mus Chr 17, six markers (Tcp10b, Mas1, and Pacrg from Rattus Chr 1; Gbl from Rattus Chr 10; Lama1 from Rattus Chr 9; and Sos1 from Rattus Chr 6) were tested for linkage in all possible arrangements despite having already been assigned to other deer mouse linkage groups. No linkage was found other than that which already
existed amongst the Rattus Chr 1 markers Tcp10b, Pacrg, and Mas1 (Figure 8).
We conducted a similar test for several markers from Mus Chr 5 (Figure 9). Eleven markers representing five Rattus chromosomes were tested for linkage. As in the Mus Chr 17 analysis, linkage was found only between markers located on the same Rattus chromosomes.
Two Mus Chr 13 markers, Clptml1 and Spz, also failed to show linkage despite being only about 19.6 Mb apart in the Mus genome, thus further reinforcing the linkage group disparities between the deer mouse and Mus genomes. Clptml1 is located in Rattus Chr 1 and Spz1 is on
Rattus Chr 2 (Figure 10).
Conclusion
Genome Mapping and Genomic Evolution
Development and availability of multiple mapping tools is essential for accurate and timely exploration of any spe-cies' genome. Three methods have already been employed in mapping small portions of the deer mouse genome in the form of cytogenetics [14,20], meiotic segregation anal-ysis [17,21-25], and a whole-genome radiation hybrid cell panel [17]. These tools are most powerful when used in combination, as exemplified by Rowe et al. [2] for Mus and by Menotti et al. [26] for the cat.
Here we significantly expand the Peromyscus meiotic segre-gation mapping data using two P. maniculatus × P.
poliono-tus interspecific backcross panels and present the most
comprehensive comparative linkage mapping data for the deer mouse to date using Type I gene markers. In addition to providing an important genetic tool for Peromyscus Comparison of the organization of genes on Rattus Chrs 1 and 2, and Mus Chr 13, with the linkage of their orthologous genes in Peromyscus
Figure 10
Comparison of the organization of genes on Rattus Chrs 1 and 2, and Mus Chr 13, with the linkage of their orthologous genes in Peromyscus. The break in the continuity of the
Pero-myscus linkage groups indicates a lack of detectable linkage
between the groups.
Comparison of the organization of genes on Rattus Chrs 4, 6, 12, 14, and 19, and Mus Chr 5 with the linkage of their orthologous genes in Peromyscus
Figure 9
Comparison of the organization of genes on Rattus Chrs 4, 6, 12, 14, and 19, and Mus Chr 5 with the linkage of their orthologous genes in Peromyscus. The break in the continuity of the Peromyscus linkage groups indicates a lack of detectable linkage between the groups.
research, we tested whether the deer mouse genome dis-played organizational homology to that of Mus musculus,
Rattus norvegicus, or a combination of both. Our results
indicate a large degree of gene order and synteny conser-vation by the deer mouse genome with that of Rattus. Our analysis was done by establishing linkage over approximately 35% of the deer mouse genome using gene markers that predominantly spanned junctions of large-scale genome rearrangements between the Rattus and Mus genomes. While using the Rattus genome as the reference, we tested 13 Mus genome breakpoints. Ten of the 13 breakpoints spanned by the Rattus genome were similarly linked in the deer mouse genome. In contrast, only one of 12 Rattus genome breakpoints that we examined while using the Mus genome as a reference closely coincided with any linkage breakpoints that we found in deer mouse genome. These data demonstrate that the organization of the deer mouse and Rattus genomes are more similar to each other than either is to Mus.
There are three instances, however, where the deer mouse map differs from both the Rattus and Mus maps. Two examples are located between markers Allc and
493504H06Rik (Figure 4) and between markers Col9a1
and Col3a1 (Figure 6). Approximately 21 Mb separates the latter pair in both Rattus and Mus, so additional markers will need to be applied to the deer mouse panel to better pinpoint the location of this breakpoint. The third instance is the unique deer mouse linkage of Sec61a2 to
Pmfbp1. Collaborative efforts have also helped to inform,
as well as confirm, some of these data using additional tools such as ZOO-FISH analyses using flow-sorted whole chromosome probes (Mlynarski et al., submitted BMC Evolutionary Biology). The strong organizational similar-ity of the deer mouse genome with the Rattus genome rather than the more morphologically similar Mus
muscu-lus suggests that a significant amount of rearrangement
occurred in the Mus genome after the divergence of the cri-cetid and murid lineages. Concomitantly, our results sug-gest that the genomic organizations of Rattus and
Peromyscus are more representative of the ancestral
muroid genome than the Mus genome, which is in agree-ment with previous literature that indicated a higher rate of genome rearrangement for Mus [5,6]. Most eutherian genomes have 30 to 40 blocks of homology with the human genome while the Mus genome is extraordinary with approximately 200 homology blocks. However, the
Mus genome is not unique in having higher relative
rear-rangement rates, as the canine and gibbon genomes have approximately twice the average number of homology blocks [27].
Our results also show that genome rearrangement can act independently from other forms of genome evolution,
such as sequence mutation. Although rodent sequence mutation rates are higher compared to other mammals, such measurements of genome evolution show Mus and
Rattus shared a common ancestor significantly more
recently than either have with Peromyscus. Our data does not propose to change this phylogeny but rather merely highlights that DNA sequence variation and chromosome rearrangement are independent processes and greater understanding of both processes can provide different insights into the evolution of the structure and function of the eukaryotic genome.
Methods
Development of a P. maniculatus Backcross Panel
We chose interspecific backcross analysis in order to max-imize genetic polymorphism and for the ease of linkage analysis [28]. The two species used in the cross were the deer mouse (P. maniculatus bairdii; BW) and the old field mouse (P. polionotus subgriseus; PO) and were obtained from the Peromyscus Genetic Stock Center at the University of South Carolina [29]. We set up the initial crosses in only one direction, BW females × PO males, to generate interspecific hybrid F1's. The direction of this cross is essential, as the reciprocal cross results in lethal over-growth of the offspring [30].
We created two separate backcross panels, BX116 and BX2, for the linkage analysis. For the BX116 panel, we bred twelve hybrid (plt BW × PO) F1 animals with 12 unrelated plt BW animals to generate 116 backcross prog-eny. Backcrosses to BW can be performed using both female and male F1 hybrid animals, as both matings will give viable offspring. However, all but one of the matings used for this panel were F1 × BW (씸 × 씹).
We used a similar strategy for the BX2 panel but the plt BW stock was substituted with wild-type BW stock. The plt allele originated in a different subspecies of P. maniculatus than the BW stock to which it was crossed. This additional backcross panel was designed to circumvent intraspecific SNP variation and possible recombination problems due to chromosomal inversions that are known to exist within some P. maniculatus sub-species.
To create the BX2 panel, we crossed four F1 males from separate unrelated 씸 BW × 씹 PO matings to non-sibling BW females, which were generated from separate matings. This resulted in four unrelated backcross families. We obtained twenty-two 씸 BW × 씹 F1 offspring from each of three of these backcross matings and 20 offspring were obtained from the fourth for a total of 86 backcross ani-mals. These were grouped in a 96-well tray along with the eight parentals and a positive and a negative control. We employed this strategy to minimize variation within fam-ilies while maximizing information between famfam-ilies.
Similarly, the strategy of crossing F1 hybrid males with BW females minimized variation due to gender-based dif-ferences in recombination frequency.
We extracted genomic DNA from all backcross parents and progeny for the BX116 panel from 1.0 cm tail snips with the Qiagen DNEasy Tissue Kit using the manufactur-ers protocol (Qiagen, Inc.). Genomic DNA for the BX2 panel animals was extracted using a phenol/chloroform/ isoamyl alcohol extraction method to increase yields.
Marker Development
We obtained primer sequences for some Type I markers from published sets of orthologous gene markers. These are termed UMPS, CATS, and TOASTs [31-33]. Primer sequences for Il23a, Mas1, H19, Sos1, and Grb10 were developed or obtained from published Peromyscus data [34-36]. Trp53 primers were developed from P.
manicula-tus sequence and were kindly provided by Michael
McLachlan. We developed all other primers from P.
man-iculatus EST sequences (Weston Glenn et al., submitted
BMC Genomics). Deer mouse EST clones were used for marker design because of greater PCR amplification suc-cess (>80% versus ~60% for the published sets).
We designed all the markers to be ~400 bp–1500 bp and to span an intron to increase polymorphism detection. This was done by aligning deer mouse DNA sequences to
Mus musculus genomic sequences using cross-species
megaBLAST (NCBI). Some critical markers however, spanned larger introns and resulted in amplicons slightly larger than the ideal size parameters.
PCR cycling conditions for all Type I markers were opti-mized for P. maniculatus and P. polionotus DNA using a MJ Research PTC-200 DNA Engine gradient thermal cycler and are defined as follows: 1) Standard: 95°C for 14.5 min followed by 35 cycles of (95°C for 30 s, 48–65°C for 30 s, 72°C for 30 s per 0.5 kb), 72°C for 10 min, 4°C hold. 2) Touchdown65 (TD65): 95°C for 14.5 min fol-lowed by 20 cycles of (95°C for 30 s, 65°C for 30 s minus 0.5°C/cycle for 20 cycles, 72°C for 30 s per 0.5 kb) fol-lowed by 15 cycles of (95°C for 30 s, 55°C for 30 s, 72°C for 30 s per 0.5 kb), 72°C for 10 min, 4°C hold. If no product was obtained using Touchdown65, the starting annealing temperature was changed to 60°C or 55°C, with the final annealing temperature remaining 10°C lower than the starting temperature.
PCR was performed using 20 ng of genomic DNA in a 10 μl reaction containing 1 μl 10× Qiagen HotStar buffer (1.5 mM MgCl2), 200 μM each dNTP, 0.4 μM forward primer, 0.4 μM reverse primer, and 1 unit Qiagen HotStar Taq polymerase. Some difficult templates required the use of Qiagen Q-solution at either 1× or 0.5× strength. Four
markers, Sparc, Xbp1, Grb10, and Ugp2 required 2.0 mM MgCl2.
For all markers, 5 μL of each amplification product was visualized by gel electrophoresis. The remaining 5 μL por-tion of the PCR products was treated for sequencing with 5 units Exonuclease I and 0.75 units Shrimp Alkaline Phosphatase (SAP) and incubated at 37°C for 15 minutes followed by heat-inactivation at 80°C for 15 minutes. For sequencing reactions, 2.0μL of purified PCR product was direct sequenced with BigDye (v3.1) (ABI) on an ABI 3130 × l according to the manufacturer's protocol. Sequence identities were verified by cross-species megaB-LAST or BmegaB-LASTN search to the Mus musculus genome. Any predicted simple size polymorphisms between BW and PO were tested by gel electrophoresis using amplification products from BW, PO, and BW/PO mix (equal ratio) DNAs. Markers not showing size polymorphisms were further analyzed for species-specific RFLPs by sequence comparison using Sequencher software (Gene Codes Cor-poration), the TCAG program available as part of the Biol-ogy Workbench software utilities provided at the San Diego Supercomputer Center [37], or with the SNP-RFLP-ing program [38]. Candidate enzymes were chosen from those predicted by the software. RFLP tests for each marker and enzyme were conducted according to manu-facturer's protocols on 10 μL PCR products from a tem-plate test panel consisting of DNA from BW, PO, a BW/PO mix (equal ratio), and a negative using only TE. All RFLP products were analyzed by gel electrophoresis. Any essen-tial markers that could not be genotyped by either size polymorphism or RFLP were sequenced on all the back-cross animals and their parents.
PCR Typing of the Backcross Panel
We tested the backcross panel parental mice with each marker prior to use on the backcross panel. We typed then typed the markers on all possible backcross animals whose parents exhibited the expected genotype. On the BX116 panel, no fewer than 73 animals were used for data to establish linkage between any two markers with excep-tion of Gbl to Hba and Hba to Canx, of which both only used 39 animals due to the small usable data set for Hba. For the BX2 panel, no fewer than 60 animals were typed between any two markers with the exception of Mut and
Col9a1, for which only 40 animals could be genotyped in
common.
Data Analysis
We performed backcross linkage analysis using Map Man-ager QTX software [39]. A minimum LOD score of 3 was used to establish linkage. Ordering of markers typed on the backcross data was determined by subjecting the data to the "ripple test", which evaluated local permutations
and selected the optimal order based on minimum break-age. Once linkage and gene order was established with high degree of confidence, omitted or unavailable geno-types could sometimes be inferred by Map Manager, as double crossovers between closely linked markers are rare. The procedure of inferring genotypes did not change any gene orders but typically tightened linkages slightly and raised LOD scores.
Abbreviations
BLAST Basic Local Alignment Search Tool BW Peromyscus maniculatus bairdii
CATS Comparative Anchor Tag Sequences cDNA complementary DNA
Chr chromosome cM centimorgan
ddH20 distilled deionized water dNTP dinucleotide triphosphate
EDTA ethylenediaminetetraacetic acid-disodium salt EST expressed sequence tag
LOD logarithm of the odds (to the base 10) Mb megabase
mya million years ago NEB New England Biolabs PCR polymerase chain reaction
plt platinum coat-color mutation
PO Peromyscus polionotus subgriseus
RFLP restriction fragment length polymorphism SAP shrimp alkaline phosphatase
SNP single nucleotide polymorphism SSLP simple sequence length polymorphism TBE Tris-Borate EDTA
TE Tris-EDTA (10 mM Tris, 1 mM EDTA)
TLE Tris-low EDTA (10 mM Tris, 0.1 mM EDTA) TOAST traced orthologous amplified sequence tags UMPS universal mammalian primer sequence
ZOO-FISH cross-species fluorescence in-situ hybridiza-tion
Authors' contributions
CR was the lead researcher, conceived the study, partici-pated in its design and coordination, developed markers and assays, participated in the design of the backcross panel, performed linkage analysis, performed molecular genetic experiments, performed sequence alignments, and drafted the manuscript. AL developed markers and assays, performed molecular genetic experiments, and performed sequence alignments. JG developed markers and assays, participated in the design of the backcross panels, per-formed molecular genetic experiments, perper-formed sequence alignments, and edited the manuscript. PV developed markers and assays, performed linkage analy-ses, participated in the design of the study, and contrib-uted to and edited the manuscript. RO participated in the design and coordination of the study and helped to draft the manuscript. MD was the principle investigator on the project, participated in its design and coordination, per-formed sequence alignments, participated in the design of the backcross panels, and contributed in drafting the manuscript and figures. All authors read and approved the final manuscript.
Acknowledgements
This manuscript is dedicated to Dr. Wallace D. Dawson, a pioneer in
Pero-myscus research. Wally led the way in recognizing and exploiting the unique
potential offered by the genus to study the genetic underpinnings of mam-malian biology, including speciation, habitat adaptation, and behavior. Herein is presented a continuation of his initial work developing a
Peromy-scus linkage map. We would also like to thank Gabor Szalai, Michael Felder,
Travis Glenn, and Fernando Pardo-Manuel de Villena for their valuable comments and suggestions. Support for this work was provided by grants from the American Cancer Society (RSG-03-070-01-MGO), NSF (MCB-0517754) (PBV); UCONN Research Advisory Council, (RJO); and NSF (DEB-0344710) and NIH (P40-RR14279 and RO1-M069601), (MJD).
References
1. Steppan SJ, Adkins RM, Anderson J: Phylogeny and
divergence-date estimates of rapid radiations in muroid rodents based on multiple nuclear genes. Syst Biol 2004, 53:533-553.
2. Rowe LB, Barter ME, Kelmenson JA, Eppig JT: The comprehensive
mouse radiation hybrid map densely cross-referenced to the recomination map: a tool to support the sequence assem-blies. Genome Res 2003, 13:122-133.
3. Wilson DE, Reeder DAM: Mammal species of the world : a
tax-onomic and geographic reference. 2nd edition. Washington ,
Smithsonian Institution Press; 1993:xviii, 1206 p..
4. Adkins RM, Gelke EL, Rowe D, Honeycutt RL: Molecular
phylog-eny and divergence time estimates for major rodent groups: evidence from multiple genes. Mol Biol Evol 2001, 18(5):777-791.
5. O'Brien SJ, Menotti-Raymond M, Murphy WJ, Nash WG, Wienberg J, Stanyon R, Copeland NG, Jenkins NA, Womack JE, Marshall Graves
Publish with BioMed Central and every scientist can read your work free of charge "BioMed Central will be the most significant development for disseminating the results of biomedical researc h in our lifetime."
Sir Paul Nurse, Cancer Research UK Your research papers will be:
available free of charge to the entire biomedical community peer reviewed and published immediately upon acceptance cited in PubMed and archived on PubMed Central yours — you keep the copyright
Submit your manuscript here:
http://www.biomedcentral.com/info/publishing_adv.asp
BioMedcentral
JA: The promise of comparative genomics in mammals.
Sci-ence 1999, 286(5439):458-62, 479-81.
6. Cavagna P, Menotti A, Stanyon R: Genomic homology of the
domestic ferret with cats and humans. Mamm Genome 2000, 11(10):866-870.
7. Ruvinsky A, Graves JAM: Mammalian genomics. Wallingford, Oxfordshire, UK ; Cambridge, MA, USA , CABI Pub.; 2005:x, 600 p.. 8. Stanyon R, Yang F, Cavagna P, O'Brien PC, Bagga M, Ferguson-Smith MA, Wienberg J: Reciprocal chromosome painting shows that
genomic rearrangement between rat and mouse proceeds ten times faster than between humans and cats. Cytogenet Cell Genet 1999, 84(3-4):150-155.
9. Bourque G, Pevzner PA, Tesler G: Reconstructing the genomic
architecture of ancestral mammals: lessons from human, mouse, and rat genomes. Genome Res 2004, 14(4):507-516.
10. Murphy WJ Larkin D. M., Everts-van der Wind A., Bourque G., Tesler G., Auvil L., Beever J. E., Chowdary B. P. Galibert F., Gatzke L., Hitte C., Meyers S. N., Milan D., Ostrander E. A., Pape G., Parker H. G., Raudsepp T., Rogatcheva M. B., Schook L. B., Skow L. C., Welge M., Womack J. E., O'Brien S. J., Pevsner P. A., Lewin H. A.: Dynamics of
Mammalian Chromosome Evolution Inferred from Multi-species Comparative Maps. Science 2005, 309:613-617.
11. Murphy WJ, Bourque G, Tesler G, Pevzner P, O'Brien SJ:
Recon-structing the genomic architecture of mammalian ancestors using multispecies comparative maps. Hum Genomics 2003, 1(1):30-40.
12. Murphy WJ, Stanyon R, O'Brien SJ: Evolution of mammalian
genome organization inferred from comparative gene map-ping. Genome Biol 2001, 2(6):REVIEWS0005.
13. Pevzner P, Tesler G: Human and mouse genomic sequences
reveal extensive breakpoint reuse in mammalian evolution. Proc Natl Acad Sci U S A 2003, 100(13):7672-7677.
14. Dawson WD, Young SR, Wang Z, Liu LW, Greenbaum IF, Davis LM, Hall BK: Mus and Peromyscus chromosome homology
estab-lished by FISH with three mouse paint probes. Mamm Genome
1999, 10(7):730-733.
15. Twigger SN, Shimoyama M, Bromberg S, Kwitek AE, Jacob HJ: The
Rat Genome Database, update 2007--easing the path from disease to data and back again. Nucleic Acids Res 2007, 35(Data-base issue):D658-62.
16. Bult CJ, Eppig JT, Kadin JA, Richardson JE, Blake JA: The Mouse
Genome Database (MGD): mouse biology and model sys-tems. Nucleic Acids Res 2008, 36(Database issue):D724-8.
17. Ramsdell CM, Thames EL, Weston JL, Dewey MJ: Development of
a deer mouse whole-genome radiation hybrid panel and comparative mapping of Mus chromosome 11 loci. Mamm Genome 2006, 17(1):37-48.
18. Murphy WJ, Larkin DM, Everts-van der Wind A, Bourque G, Tesler G, Auvil L, Beever JE, Chowdhary BP, Galibert F, Gatzke L, Hitte C, Meyers SN, Milan D, Ostrander EA, Pape G, Parker HG, Raudsepp T, Rogatcheva MB, Schook LB, Skow LC, Welge M, Womack JE, O'Brien S J, Pevzner PA, Lewin HA: Dynamics of mammalian
chromo-some evolution inferred from multispecies comparative maps. Science 2005, 309(5734):613-617.
19. Loschiavo M, Nguyen QK, Duselis AR, Vrana PB: Mapping and
identification of candidate loci responsible for Peromyscus hybrid overgrowth. Mamm Genome 2007, 18(1):75-85.
20. Wang Z, Young SR, Liu L, Dawson WD: Assignment of Tp53 and
Tk1 to chromosome 13 in Peromyscus by fluorescence in situ hybridization. Cytogenet Cell Genet 1995, 69(1-2):97-100.
21. Bowen WW, Dawson WD: Genetic analysis of coat pattern
var-iation in oldfield mice (Peromyscus polionotus) of western Florida. Journal of Mammalogy 1977, 58:521-530.
22. Dawson WD: Protein polymorphisms in American deermice
(Peromyscus) and genetic linkage homology. Acta Theriologica
1982, 16:213-230.
23. Dawson WD, Huang LL, Felder MR, Shaffer JB: Linkage
relation-ships among eleven biochemical loci in Peromyscus. Biochem Genet 1983, 21(11-12):1101-1114.
24. Robinson R: Linkage in Peromyscus. J Hered 1964, 19:701-709. 25. Snyder LR: Evolutionary conservation of linkage groups:
addi-tional evidence from murid and cricetid rodents. Biochem Genet 1980, 18(3-4):209-220.
26. Menotti-Raymond M, David VA, Roelke ME, Chen ZQ, Menotti KA, Sun S, Schaffer AA, Tomlin JF, Agarwala R, O'Brien SJ, Murphy WJ:
Second-generation integrated genetic linkage/radiation
hybrid maps of the domestic cat (Felis catus). J Hered 2003, 94(1):95-106.
27. Ferguson-Smith MA, Trifonov V: Mammalian karyotype
evolu-tion. Nat Rev Genet 2007, 8(12):950-962.
28. Copeland NG, Jenkins NA: Development and applications of a
molecular genetic linkage map of the mouse genome. Trends Genet 1991, 7(4):113-118.
29. Peromyscus Genetic Stock Center [http://stkctr.biol.sc.edu/]
30. Dawson WD: Fertility and size inheritance in a Peromyscus
species cross. Evolution 1965, 19:44-55.
31. Venta PJ, Brouillette JA, Yuzbasiyan-Gurkan V, Brewer GJ:
Gene-specific universal mammalian sequence-tagged sites: appli-cation to the canine genome. Biochem Genet 1996, 34(7-8):321-341.
32. Lyons LA, Laughlin TF, Copeland NG, Jenkins NA, Womack JE, O'Brien SJ: Comparative anchor tagged sequences (CATS) for
integrative mapping of mammalian genomes. Nat Genet 1997, 15:47-56.
33. Jiang Z, Priat C, Galibert F: Traced orthologous amplified
sequence tags (TOASTS) and mammalian comparative maps. Mamm Genome 1998, 9:577-578.
34. Schountz T, Green R, Davenport B, Buniger A, Richens T, Root JJ, Davidson F, Calisher CH, Beaty BJ: Cloning and characterization
of deer mouse (Peromyscus maniculatus) cytokine and chemokine cDNAs. BMC Immunol 2004, 5:1.
35. Vrana PB, Fossella JA, Matteson P, del Rio T, O'Neill MJ, Tilghman SM:
Genetic and epigenetic incompatibilities underlie hybrid dys-genesis in Peromyscus. Nat Genet 2000, 25(1):120-124.
36. Vrana PB, Guan XJ, Ingram RS, Tilghman SM: Genomic imprinting
is disrupted in interspecific Peromyscus hybrids [see com-ments] [published erratum appears in Nat Genet 1999 Feb;21(2):241]. Nat Genet 1998, 20(4):362-365.
37. Biology Workbench [http://workbench.sdsc.edu]
38. Chang HW, Yang CH, Chang PL, Cheng YH, Chuang LY:
SNP-RFLPing: restriction enzyme mining for SNPs in genomes. BMC Genomics 2006, 7:30.
39. Manly KF, Cudmore RH Jr., Meer JM: Map Manager QTX,
cross-platform software for genetic mapping. Mamm Genome 2001, 12(12):930-932.
40. Duselis AR, Wiley CD, O'Neill MJ, Vrana PB: Genetic evidence for
a maternal effect locus controlling genomic imprinting and growth. Genesis 2005, 43(4):155-165.