DEVELOPMENT OF ROAD ACCIDENT REPORTING
COMPUTERIZED SYSTEM IN THAILAND
Sattrawut PONBOON Yordphol TANABORIBOON
Research Associate Professor
School of Civil Engineering School of Civil Engineering Asian Institute of Technology Asian Institute of Technology P.O. Box 4, Klong Luang P.O. Box 4, Klong Luang Pathumthani, Thailand Pathumthani, Thailand
Fax: +66-2-5245509 Fax: +66-2-5245509
E-mail: [email protected] E-mail: [email protected]
Abstract: The accident reporting computerized system was developed in this study. Prior to
develop this accident computer package, this study examines the accident situation in Thailand in two parts with two scales. The accident reporting was analyzed with a macro scale, represents accident situation for a whole country, and an intermediate scale, referred to community scale. By reviewing natures of data, tasks, and related issues, the computerized system was developed as a supplementary tool for assess the accident situation in Thailand. The accident under-reporting, accident reported matching, and accident during holiday festivals can be performed to present more precisely about the accident situation in Thailand.
Key Words: Accident during festival, Accident under-reporting, Accident rate, Thailand
1. INTRODUCTION
In Thailand, road safety has been handled by many organizations, including both public and private sectors. The sectors that have taken care of accident data normally provide the valuable information to decision maker in order to support them establish the strategies, safety campaigns, safety programs, the action plans, or any countermeasures for road safety. The data available from routine accident statistics, however, do not provide a comprehensive guide. Conversely, some of them are misused that let the situation become worse.
The accident reporting system was developed in this paper to understand more about the natures of data, tasks, issues, and the output of the system. There are three parts including accident under-reporting, accident rate, and accident during festival. Each part, the potential problems were highlighted. For accident under-reporting and accident during festival, the community case study was analyzed to review the issues more precisely.
2. THE SYSTEM FRAMEWORK
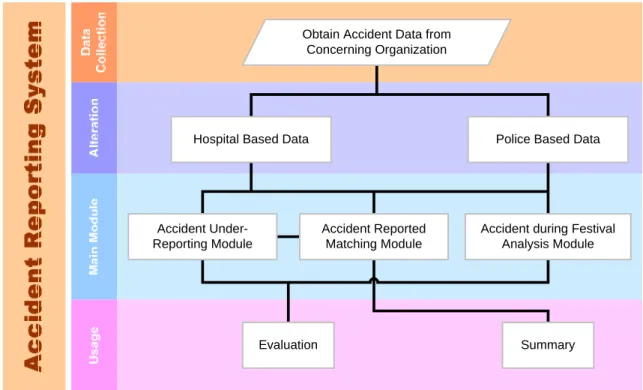
The main purpose of the accident reporting system is to support the road safety program in order to evaluate and summarize the accident data from concerning organizations. The framework of the system is shown in Figure 1.
Obtain Accident Data from Concerning Organization
Hospital Based Data Police Based Data
Accident Reported Matching Module
Accident during Festival Analysis Module Accident
Under-Reporting Module
Summary Evaluation
Figure 1. The Framework of Accident Reporting System
Data Collection and Alteration
Due to lack of accident data format, the compatible format was developed to achieve the consistency of all accident data format from different organizations. This study obtained data from two organizations, hospital and police. The hospital recorded with Injury Surveillance or IS form (Ministry of Public Health, 2002b) as a patient-based, while police recorded with the descriptive format as an accident-based.
Main Module and Usage
In this study, the user-friendly computer package was developed which consisted of 3 main modules namely: Accident Under-Reporting Module, Accident Reported Matching Module, and Accident During Festival Module. The first module, the Accident Under-Reporting Module was developed to examine the under-reporting issue in Thailand. The second module, Accident Reported Matching Module, is a tool to match accident records from different sources, e.g. police, hospital, etc. It can check whether the victim is the same person among different sources. Thus, the actual number of victims or the actual statistic could be reported. Other than the two modules, the Accident During Festival Module was developed to evaluate the road accidents situation during the holiday periods. By inputting any holiday period, the module can separate and analyze the accident situation among festival and non-festival periods.
3. ACCIDENT UNDER-REPORTING
Two of the major well-known accident sources in Thailand are police and hospital reports. The process for reporting is different somehow. Normally, police report the accident as an active manner, while hospital take care them as a passive manner, but not all of accident cases were reported by both of them. For example, when an accident occurs with a single-vehicle cause like vehicle overturned, vehicle lost control and run off the roadway, etc., the victims tend not to report their own mistake to the police. On the contrary, an accident was reported
by only police, not hospital, because there was no one injured. Therefore, the less number of reporting is cause accident under-reporting. The followings describe the nature of accident under-reporting in Thailand as a national level and in Khon Kaen as a community level to further highlight the under-reporting issue.
3.1The Accident Under-Reporting for the Whole Country
Table 1 shows a comparison of number of fatalities between police and hospital records during 1995-2002. From these statistics, there were fluctuations among them. In 1995, 1997, 1998, and 1999, the police records were higher, while hospital records were higher in the remaining periods. The trend of under-reporting is difficultly to decide. Generally, police has a prevalence to report the accident when a fatality took place, or every road fatality accidents. Having mentioned this fact, it must be noted that fatalities accidents mean those victims who were killed at the accident scene. This may support that police records should be higher. While one may say it was hardly to report by police when the victims died after the days of accident, since there is still no definition of fatality in Thailand. Some countries may only include deaths at the scene, whereas others will stipulate deaths within 30 days. To analyze more explicitly, the community study in Khon Kaen represented more detail about accident under-reporting by using the developed Accident Under-Reporting Module.
Table 1. The Number of Fatalities reported by Police and Hospital during 1995-2002
Year Police Hospital Percent Reported
by Police
Percent Different as Police Based
1995 16,727 14,479 116 % 13 %
1996 14,405 16,268 89 % -13 %
1997 13,836 12,832 108 % 7 %
1998 12,234 7,839 156 % 36 %
1999 12,040 11,315 106 % 6 %
2000 11,988 12,936 93 % -8 %
2001 11,652 12,722 92 % -9 %
2002 13,116 13,290 99 % -1 %
Source: The Royal Thai Police and Ministry of Public Health
3.2Accident Under-Reporting in the Community, Khon Kaen Case Study
This section elaborates the road accident under reporting situation in Khon Kaen Municipality. By visiting the hospitals and a police station in the study area, data were collected from two main sources, Khon Kaen Regional Hospital and Khon Kaen Police Station. Due to the availability of accident data, the study only focused on Khon Kaen Municipality area. For police data, road accident information were manually collected from accident reports. The police data contain the following information: time and date of accident, location of occurrence, road users and modes of transportation involved, names and degree of severities of victims, etc. For the hospital, data were retrieved directly from the trauma accident database system. After matching, several records were disregarded and removed since they were not complete. Eventually, a three-month period (September – November 2002) was selected as a survey period.
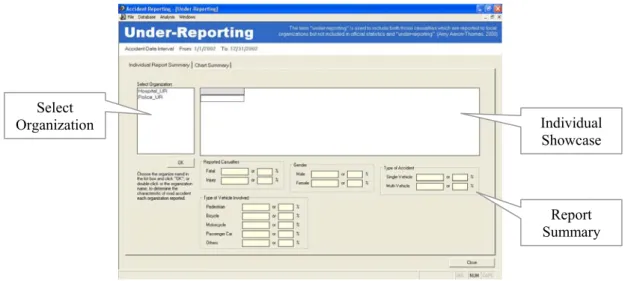
Accident Under-Reporting Module
Figure 2. Accident Under-Reporting Module
The organization names are shown in “Select Organization” list box. Users can choose the organization and click “OK” to analyze. The result of this frame consists of two parts as presented in Figure 3. The “Individual Report Summary” is shown both accident record and its statistic. Another result is shown in “Chart Summary”. It presents the chart summary. Users can click on “Select Accident Attributes” list box to illustrate the percentages of accident under-reporting as chart summary.
* Actual names and surnames are disclosed
Figure 3. The Individual Summary of Each Organization
and Percentage of Accident Under-Reporting Chart relevant to Accident Attributes
Reported Casualties
The compared numbers of casualties from both Khon Kaen Police Station and the selected Khon Kaen Regional Hospital are shown in Table 2. Typically, accident injuries are divided into two categories, serious injury and slight injury. The police, however, did not clearly classify road accident injuries. Thus, the road accident casualties in Khon Kaen can be classified to only fatality and injury.
Table 2. Reported Road Casualties in Khon Kaen, 2002
Police Hospital Percent Reported by Police
Fatal 17 8 213 %
Injury 19 617 3 %
Total 36 625 6 %
As can be clearly seen from Table 2, the accident under reporting is very high for the injuries showing that the police reported only 3 percent of the hospital records. On the other hand, the
Select
Organization Individual
Showcase
Report Summary
fatalities are reported by the police as much as twice of those appeared in the hospital records. The reason for this is probably only one hospital records was used for the comparison while in the study area; there are a total of 5 hospitals but only one police station.
To see the extent of under-reporting worldwide, data from the other countries were compared. The percentages of all casualties, injuries, and fatalities that reported by police, among developed countries and developing countries, were presented as shown in Table 3. As can be seen, police reported all of fatality in developed countries, while police reported much higher fatalities in developing countries. On the contrary, police reported less injury cases than hospital, except in Harare, Zimbabwe that traffic regulations forbid to move vehicle until the police arrive (Thomas, 2000). Thus, it can be stated that police have the tendency to pay more attention to fatal accidents than those injuries cases.
Table 3. Comparison of Percent Reported by Police
City (Country), Year All
Casualties
Injury (Serious, Slight)
Fatality
California (U.S.A.), 1963 49 % 93 % 100 %
Reading (U.K.), 1974-1976 72 % (79 %, 66 %) 100 % Oxfordshire (U.K.), 1983-1984 61 % (66 %, 55 %) 100 %
Dhaka (Bangladesh), 1999 6 % 4 % 200 %
Khon Kaen (Thailand), 2002 6 % 3 % 213 %
Hanoi (Vietnam), 1998 29 % 17 % 775 %
Bangalore (India), 1998 53 % 48 % 302 %
Harare (Zimbabwe), 1999 149 % 140 % 2,175 % Source: James (1991) and Thomas (2000)
Type of Accidents
Generally, when an accident occurs with a single-vehicle cause like vehicle overturned, vehicle lost control and run off the roadway, etc., the victims will likely not report their own mistake to the police. This could result in a potentially high under reporting of single-vehicle accidents reported by the police. Khon Kaen is no exception as can be seen from Figure 4 that the police under reported on single vehicle casualties by approximately 81 percent which is very high comparing with only 6 percent in Great Britain (James, 1991).
30%
70%
6%
94%
0% 10% 20% 30% 40% 50% 60% 70% 80% 90% 100%
Single-vehicle Multi-vehicle
Pe
rc
e
n
ta
ge
Police Hospital
3.3Individual Accident Casualty Record Matching
Since the hospital data were collected only from the Khon Kaen Regional Hospital’s data. It is assumed that those casualties who were not admitted to Khon Kaen Regional Hospital would be treated in other hospitals or considered non-hospital treated as presented in Figure 5. Each individual case obtained from both the police’s and Khon Kaen Regional Hospital’s data was then compared based on each victim’s name and time/date of accident occurrence to ensure the exact matching between the two sources of data.
Figure 5. Assumption Diagram for Matched Case Source: Thomas (2000)
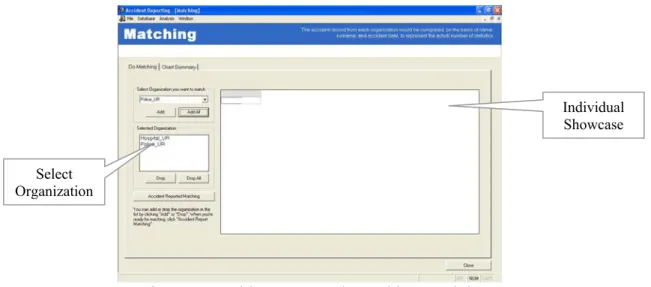
Accident Reported Matching Module
Figure 6 shows the Accident Reported Matching window. Users are required to choose the interested data from “Select Organization you want to match” combo box. After the organization names are already added in the list box, click “Accident Reported Matching” to do the matching. During this process, the system compares the name, surname, and accident date for each person. The first organization data in the list is the main central of comparison. The next organization’s record is compared individually. If all three compared fields are the same, the system will check the severity of person. There are three cases of the severity comparison. The first, if a person was recorded as “Fatality” from both sources, it will record as “Fatality”. The second, if a person was recorded as “Injury” from both sources, it will record as “Injury”. The last, if they recorded differently, one recorded as “Fatality” and another recorded as “Injury”, it will record as “Fatality” automatically.
Figure 6. Accident Reported Matching Module
Select Organization
Individual Showcase
After the matching was completed, the summary is shown similarly to accident under-reporting module. Figure 7 illustrates the result of matching both individual record and statistic summary. It can show total record, statistic table, and summary chart.
* Actual names and surnames are disclosed
Figure 7. The Record Summary of Accident Reported Matching and the Summary Statistic of Accident Reported Matching Module
As mentioned earlier, the data between September-November 2002 are selected because of the completeness. Therefore, out of all 36 accident casualties reported by the police, only 18 cases could be exactly matched with the hospital data. In fact, this accounted for only 3 percent of all the hospital casualty data (18 out 625). Moreover, it was also found that 3 casualty cases were recorded differently by the police and the hospital. One of these 3 cases was recorded as “injured” in the police report but recorded as “fatality” in hospital report whereas the remaining two were recorded oppositely. The conflicting reports for the former case could imply that in such accident, the victim could still be alive at the accident scene when the police was there, but might died afterwards, after being hospitalized. However, for the latter cases, it is beyond the scope of this study to conclude who made mistake in reporting.
Table 4. Accident Reported Matching
No.
Casualties matching 18 Severities matching 15 Severities not matching 3
To overcome the under reporting controversy, it is recommended that, for the non-matching cases, the police and hospital reports be combined. At the same time, it should be ensured that the matching cases between the two sources are not double counted. Then, the final figure of total accidents in Khon Kaen case study would be 643 casualties altogether as shown in Table 5, instead of the previous record of 661 casualties.
Table 5. Matching Summary
Fatalities Injuries Casualties
Police Reported only 11 7 18
Hospital Reported only 3 604 607
Matched 7 11 18
Total 21 622 643
In conclusion, the question of which organization should be responsible for the under reporting is not as important as how the under reporting problem can be minimized. It is
known that problem of discrepancies in accident statistics among different concerned agencies must be solved but it is easier said than done as each organization still focuses on its own interests. Therefore, one has to pay attention about nature of accident data from different sources before using it.
4. ACCIDENT RATE
Even number of under-reporting was minimized; the correct accident situation still can not be shown. When the accident situations were compared, only the number of road fatalities alone does not reflect the objective of comparison. An accident rate, therefore, has been contributed for a comparison basis.
In Thailand, a population-based rate is commonly used, including area population and number of registered vehicle. Figures 8 show the relationship between number of fatalities-population and number of fatalities-number of registered vehicle. However, it must be noted that these values are static and do not depend on vehicle usage or the total amount of travel. As can be seen from Figure 8, the number of population and registered vehicle increased continuously until 2002, while the number of fatalities starts to decrease since 1995.
0 2,000 4,000 6,000 8,000 10,000 12,000 14,000 16,000 18,000
1989 1990 1991 1992 1993 1994 1995 1996 1997 1998 1999 2000 2001 2002
F a ta lit ie s 54,000 55,000 56,000 57,000 58,000 59,000 60,000 61,000 62,000 63,000 P o p u la ti on (1 ,000 ) Population No. of Fatalities
0 2,000 4,000 6,000 8,000 10,000 12,000 14,000 16,000 18,000
1989 1990 1991 1992 1993 1994 1995 1996 1997 1998 1999 2000 2001 2002
Fatal iti es -2,500 5,000 7,500 10,000 12,500 15,000 17,500 20,000 22,500 25,000 R egis tere d Vehi cles (1, 000)
No. of Registered Vehicles No. of Fatalities
Figure 8. Relationships between Number of Fatalities-Population and Number of Fatalities-Number of Registered Vehicle
Source: The Royal Thai Police, Bank of Thailand, Ministry of Land Transport
One of the astonishing factors that has the distinction against both of them is fuel consumption. The statistics in Table 6 show percent share of transportation sectors from Petroleum product consumption during 1998-2002.
Table 6. Percent Share of Petroleum Product Consumption by Economic Sector
Year Economic Sector
1998 1999 2000 2001 2002
1. Agriculture 8.40 9.00 9.21 9.62 9.77 2. Mining 0.10 0.21 0.04 0.05 0.05 3. Manufacturing 11.84 12.21 13.29 13.19 13.42 4. Electricity 12.55 10.73 7.04 2.29 1.96 5. Construction 0.83 0.73 0.48 0.43 0.47 6. Residential and Commercial 5.94 6.30 7.30 7.91 7.60
7. Transportation 60.34 60.81 62.64 66.51 66.74
Total 100.00 100.00 100.00 100.00 100.00 Source: DED and oil traders in pursuance of section 7
Accident statistics also revealed that road transport share 78.60 percents of all types of transportation as shown in Table 7. The relationship between number of fatalities and road transport fuel consumption, therefore, are developed as shown in Figure 9.
Table 7. Share of Energy Demand in the Transportation Sector in Thailand, 2002
Transport Mode Share (percent)
Land Transport 79.1
Road 78.6
Rail 0.5
Water Transport 4.6
Air Transport 16.3
Source: Energy Policy and Planning, Ministry of Energy
0 2,000 4,000 6,000 8,000 10,000 12,000 14,000 16,000 18,000
1989 1990 1991 1992 1993 1994 1995 1996 1997 1998 1999 2000 2001 2002
F a ta lit ies 7,000 9,000 11,000 13,000 15,000 17,000 19,000 21,000 23,000 25,000 27,000 F u el Con s u m p tio n ( m illio n-lit er) Road Transport Fuel Consumption No. of Fatalities
Figure 9. Relationships between Number of Fatalities and Road Transport Fuel Consumption Source: The Royal Thai Police and Ministry of Commerce
However, it does not mean the typical indicator of accident rate must be replaced by fuel consumption based. To consider the relationship among them, the comparison was developed to determine how different they are. The based rates are 50,000 Population, 10,000 Registered Vehicles, and 10 million-liter of Fuel Consumption. The absolute numbers of based rate are created for its comparison basis only.
4 6 8 10 12 14
1989 1990 1991 1992 1993 1994 1995 1996 1997 1998 1999 2000 2001 2002
F a ta lity Ra te Fatalities per 50,000 Population Fatalities per
10 million-liter of Fuel Consumption Fatalities per
10,000 Registered Vehicles
From Figure 10, it showed that the accident rate is sensitive. By using different types of accident rate can lead the different outcomes. While population-based and registered vehicle-based rate were entirely decreased from 1995 to 2001, the fuel consumption-vehicle-based rate started to increase since 1999 which following the country’s trend to begin its economic recovery periods. Tanaboriboon (2004) also presented that after the fuel consumption had been compared with the others, the parameter of vehicle registration and population in the country can not explained properly the accident situation in Thailand. As a result, it is recommended to use fuel consumption as one additional indicator of accident rate.
5. ACCIDENT DURING FESTIVAL
A New Year holiday and Songkran festival (Thai traditional New Year) are the major holidays that encourage a million of travelers who travel to/from their hometown and doing the activities during these holiday periods. Unfortunately, number of road accidents, fatalities, and injuries, are raised up dramatically. The following sections describe the situations and characteristics of accidents during these festivals in Thailand. Moreover, the situation and characteristics of non-festival period are also compared as a community case study in Khon Kaen.
5.1The Accident during Festival for the Whole Country
In Thailand, the trends of accident represented by average number of fatalities during 1998-2002 are presented as shown in Figure 11. It reveals that number of fatalities composed of two peaks in January and April. For the other months, number of fatalities dropped down spreading like a foot of a hill.
750 800 850 900 950 1,000 1,050 1,100 1,150 1,200 1,250
Aug Sep Oct Nov Dec Jan Feb Mar Apr May Jun Jul
Numb
er of Fata
liti
es
Number of Fatalities
Figure 11. Average Number of Fatalities and Injuries for the Whole Country during 1998-2002
Moreover, number of fatalities and injuries tend to increase every year. Table 8 shows that the number of fatalities and injuries were increasing continuously for the past three years, especially in New Year 2002 that were increased up to 28.85 percent and 44.22 percent for fatalities and injuries, respectively.
Table 8. The Accident Situation during Holiday Festivals
Festival Year Fatalities Injuries
2001 (28 Dec 2000 – 3 Jan 2001) 454 23,786 2002 (27 Dec 2001 – 2 Jan 2002) 585 34,303
New Year
2003 (27 Dec 2002 – 2 Jan 2003) 606 35,286 2001 (12 Apr 2001 – 17 Apr 2001) 530 32,014 2002 (12 Apr 2002 – 17 Apr 2002) 544 33,898
Songkran
2003 (11 Apr 2003 – 16 Apr 2003) 559 37,718
Source: Ministry of Public Health
Considering the daily occurrence of accidents during the two holiday festivals periods: 27 December – 2 January for New Year Holidays and 11 April – 16 April for Songkran Holidays and the rest of the year or non-festival period, it was known that the daily fatalities during New Year and Songkran festivals rose up to 84 and 95 persons per day, respectively as shown in Figure 12. They increased 147 percents and 179 percents comparing with an average of 34 persons per day of non-festival period. Similarly, daily injuries of New Year and Songkran holidays increased to 4,900 and 5,650 persons, or 98 percents and 128 percents comparing with an average of 2,468 persons per day during the non-festival period.
84 95 0 10 20 30 40 50 60 70 80 90 100
Aug Sep Oct Nov Dec Jan Feb Mar Apr May Jun Jul
D a ily F a ta lit ie s Festival Period Non-Festival Period 4,900 5,650 0 1,000 2,000 3,000 4,000 5,000 6,000
Aug Sep Oct Nov Dec Jan Feb Mar Apr May Jun Jul
D a ily In ju rie s Festival Period Non-Festival Period
Figure 12. Daily Fatalities and injuries after Festival Period was separated
5.2Accident Situations during Festival in the Community, Khon Kaen Case Study
Considering this serious effect of the holiday festivals in Thailand, this paper intends to further scrutinize accident situations during holidays by using Khon Kaen Province as a case study. Also, the computer package was specially developed to cater the analysis. One year accident data recorded in Khon Kaen between the period of 1 August 2001 to 31 July 2002 was used which non-festival period covers 352 days, while the holiday periods cover 7 days for New Year Holiday (27 December – 2 January) and 6 days for Songkran Holidays (11 April – 16 April).
Accident During Festival Module
The user interface design of the module is shown in Figure 13. The input part composes of the organization name in “Select Organization” combo box, and “Festival period” frame that allowed users to input up to 5 festival periods. Users are required to input date begin, date end, and name of festival in the text box.
Figure 13. Accident During Festival Module
After required input data was completed, users can click “Analyze Accident during Festival” to perform the analysis. During the process, the system separates every record that belongs to each festival. After all festival periods were separated, the remaining represent non-festival period. Both festival and non-festival could be analyze as the same method with the other modules. Finally, the results are presented as shown in Figure 14.
Figure 14. The Statistic Summary of Accident During Festival Module
The results are divided into two parts. The percent column represents the distribution of the percentage of victims for each characteristic, while on person per day column represents the magnitude of each period. In “Chart Summary” tab, both results are depicted as a summary chart as displayed in Figure 15. The accident attribute list box is located on the left side. Users can switch between the percentage summary and daily number of victims summary by clicking the option button in the upper part of the list box.
Select Organization
Festival Periods
Report Summary
Figure 15. The Charts Summary of Accident During Festival Module
Although the package was designed to analyze several indicators to compare accident situations during holiday periods and typical days, this paper only presented an example case of alcohol drinking. As can be seen from Figure 16 that during the two festivals (New Year Festival and Songkran Festival), drunk drivers were increased by 11 percent and 7 percent, respectively. Obviously, the Thais celebrate their holiday festivals by drinking and drive carelessly. These findings can be used as a guideline for concerned agencies that alcohol is one of the significant contributing factors in road accidents in Khon Kaen during the holiday periods.
-20 40 60 80
Drunk Non-Drunk Unknown
Percent
New Year Festival Songkran Festival Non-Festival
Figure 16. Percentage of Victims by Alcohol Using of New Year and Songkran, and Non-Festival Period
6.
Conclusion
The accident reporting computerized system is developed in this study as a supplementary tool to overcome the problem of lacking of quality accident data. The problems including accident under-reporting, accident rate, and accident during festival were analyzed in details. The under-reporting issue, it was known that the under-reporting problem is highly pronounced especially for injured victims. Results revealed that police reports only 3 percent of all injuries occurred in Khon Kaen while fatalities are reported up to 213 percent more than that of hospital’s records.
For accident rate, new accident indicator is based on the fuel consumption. Accident trends are used to verify the application of this proposed indicator together with other widely used population-based rates which are population and number of registered vehicles. It was known that this proposed indicator follows the same trends as of fatality rates but in contrary with population and number of registered vehicles. Nevertheless, number of registered vehicles can be regarded as a static variable. Thus, this study believes that this proposed indicator can be used to assess accident situation in Thailand.
Other than the two mentioned computer modules, this paper also develops a special package to help analyze the accident situations during holiday festivals. Citing some findings obtained from Khon Kaen’s IS data which revealed that numbers of accident victims with alcohol are increased by 11 percent during New Year festival and 7 percent during Songkarn festival. These findings can be used as a guideline for concerned agencies that alcohol is one of the significant contributing factors in road accidents in Khon Kaen during the holiday periods.
REFERENCES
James, H.F. (1991) Under-reporting of road traffic accidents, Road User Safety Division,
Transport and Road Research Laboratory.
Ministry of Public Health (2002a) Information of Accidents and Disaster, Injury and
Alcohol Related Problems Prevention and Control Section, Bureau of Non-Communicable Diseases, Department of Disease Control.
Ministry of Public Health (2002b) Injury Surveillance Coding Manual, Non-communicable
Section, Epidemiology Division, Permanent Secretary Office.
Tanaboriboon, Y. (2004) The Status of Road Safety in Thailand, ADB-Asian Regional Safety Program, Country Report: CR09.
Thomas, A.A. (2000) Under-reporting of road traffic casualties in low income countries,