303
MAPPING DIFFERENTIAL ELEMENTAL ACCUMULATION IN FISH TISSUES:
IMPORTANCE OF FISH TISSUE SAMPLING STANDARDIZATION
Katarina Jovičić3,*, Saša Janković2, Željka Višnjić-Jeftić1, Stefan Skorić1, Vesna Đikanović3, Mirjana Lenhardt3,
Aleksandar Hegediš1,4, Jasmina Krpo-Ćetković4 and Ivan Jarić1,5
1Institute for Multidisciplinary Research, University of Belgrade, Kneza Višeslava 1, 11030 Belgrade, Serbia
2Institute of Meat Hygiene and Technology, Kaćanskog 13, 11000 Belgrade, Serbia
3Institute for Biological Research “Siniša Stanković”, University of Belgrade, Bulevar Despota Stefana 142, 11060 Belgrade, Serbia
4Faculty of Biology, University of Belgrade, Studentski trg 16, 11000 Belgrade, Serbia
5Leibniz-Institute of Freshwater Ecology and Inland Fisheries, Müggelseedamm 310, 12587 Berlin, Germany
*Corresponding author: [email protected]; [email protected]
Received: June 29, 2015; Accepted: September 30, 2015; Published online: March 8, 2016
Abstract: The concentrations of As, Cd, Co, Cr, Cu, Fe, Hg, Mn, Ni, Pb, Se and Zn in the muscle, gills, liver and intestine of the wels catfish (Silurus glanis) from the Danube River were analyzed by inductively coupled plasma mass spectrometry (ICP-MS). The aim of the study was to determine whether in complex muscle/skin, gill filament/gill arch, proximal/distal liver and proximal/median/distal intestine samples, particular components differ in concentrations of the analyzed elements. Results indicated that there were no differences in the accumulation of different elements between the proximal and distal liver segments and between the proximal and median intestine sections. Conversely, elemental accumulation patterns in muscle and skin differed significantly. Significant differences were also observed between the gill arch and filaments, as well as between the distal and the two upper intestine sections. Findings indicated the importance of detailed reporting of tissue sampling, i.e. whether the skin was included in the muscle sample, as well as if the gill arch and filaments were analyzed together. Due to a potential bias that can be produced by different muscle/skin or gill arch/filament ratios included in the sample, we strongly recommend that they should not be analyzed together. Results of the present study might be of interest to the scientific community and stakeholders involved in aquatic ecosystem monitoring programs.
Key words:metal; Danube River; wels catfish; Silurus glanis; ICP-MS
INTRODUCTION
Metals are considered to be critical contaminants of the aquatic environment [1]. Fish are among the aquatic organisms most susceptible to water and sediment pol-lution [2]. At the same time, as species positioned at the top of the food chain, they can accumulate high metal levels [3]. The presence of metals in fish tissues is therefore of considerable importance to environmental and food safety, as well as for public health [4]. Metal pollution in fish has become a worldwide concern, and numerous studies and monitoring programs for metal accumulation in fish have been conducted [5-7].
Studies related to metal pollution in fish have been mainly focused on muscle tissue as the main fish part consumed by humans, as well as on the gills, liver, kidneys, and intestine, which represent either major accumulation centers in fish or the main metal uptake routes [5,8,9].
informa-tion on the fish tissue-sampling procedure. As much as 77% of papers failed to report whether the skin was separated from the muscle tissue, or if both tissues were assessed together. A minority of authors either emphasized that they removed the skin from the mus-cle or that they assessed each tissue separately, while a single author reported that muscle and skin were assessed together. As stated by Crafford and Avenant-Oldewage [10], authors either include or remove the skin from the muscle sample, although they often fail to report which approach was employed. Furthermore, only 5% of the authors reported that they separated the gill arch and the filaments, while a single author stated that both gill segments were combined in a sample. None of the authors specified which part of the liver was included in the sample. Only a single author pro-vided details on the intestine section that was sampled. In the present study, we assessed elemental con-centrations in different segments of muscle, gills, liver, and intestine of the wels catfish (Silurus glanis) from the Danube River in order to determine pos-sible differences between them. Such information could indicate the importance of sampling procedure standardization and reporting in studies dealing with elemental accumulation in fish. This issue has not re-ceived proper attention so far, and the results of the present study might therefore be of interest to both the scientific community and the stakeholders involved in aquatic ecosystem monitoring programs.
MATERIALS AND METHODS Sample collection
Wels catfish specimens (n=13) were collected by professional fishermen during March 2013 from the Danube River (1169 river km) in the vicinity of the city of Belgrade, Serbia (44º 49’ 54.48” N, 20º 27’ 23.68” E). The same sample was previously used to assess elemental accumulation in different tissues of the studied species [11]. Specimens were killed with a quick blow to the head, measured for their total body length (cm) and total body weight (g), checked for their sex and maturity by inspection of the gonads,
and subsequently dissected. Samples of the muscle (right dorsal muscle), skin, gill filaments, gill arch, liver and intestine were collected. Each liver sample was separated into two sections, proximal and distal. Given that the intestine of catfish species is clearly differentiated into three principal regions − proximal, median and distal [12], samples from each region were sectioned. All samples were washed with distilled wa-ter and stored at -20°C prior to analysis.
Sample preparation and analysis
The samples were freeze-dried using a Christ rota-ry vacuum concentrator, model GAMMA 1-16LSC (Osterode am Harz, Germany). Analytical portions of approximately 0.3 g (dry weight) were accurately weighed and subsequently processed in a micro-wave digestion system. Samples were mineralized by adding 6 mL of 65% HNO3 and 4 mL of 30% H2O2 (Merck, Darmstadt, Germany). Microwave assisted digestion was performed in a SpeedwaveTM MWS3+
oven (Berghof, GmbH, Eningen, Germany). The fol-lowing temperature program was used (default food program): 5 min at 160°C; 15 min at 190°C; 20 min at 100°C. After cooling, digested samples were trans-ferred into 100-mL polypropylene volumetric flasks and diluted to volume with ultrapure water. In order to assess the possible presence of trace elements in reagents or carry-over effects of digestion vessels, five reagent blank samples were prepared as well, one per each session, according to the described procedure. These samples were analyzed in each analytical batch.
Analysis was performed by inductively coupled plasma mass spectrometry (ICP-MS) using the instru-ment “iCap Q” (Thermo Scientific, Bremen, Germany), equipped with a collision cell and operating in kinetic energy discrimination (KED) mode. The following isotopes were measured: chromium (52Cr), manganese
(55Mn), iron (57Fe), cobalt (59Co), nickel (60Ni), copper
(63Cu), zinc (66Zn), arsenic (75As), selenium (77Se),
cad-mium (111Cd), and lead (208Pb). Basic operating
condi-tions of the instrument are shown in Table 1.
Scientific Tune B) in order to optimize measurements and to minimize possible interferences. For quantitative analysis of the samples, a five-point calibration curve (including zero) was constructed for each isotope in the concentration range of 0.1-2.0 μg/L for 75As, 111Cd and 208Pb, and 0.1-2.0 mg/L for 52Cr, 55Mn, 57Fe, 59Co, 60Ni, 63Cu, 66Zn and 77Se. An additional line of the peristaltic
pump was used for an online introduction of a multi-element internal standard (6Li, 45Sc – 10 ng/mL; 71Ga, 89Y, 209Bi – 2 ng/mL), covering a wide mass range.
Con-centrations of each measured isotope were corrected for response factors of both higher and lower mass internal standards using the interpolation method.
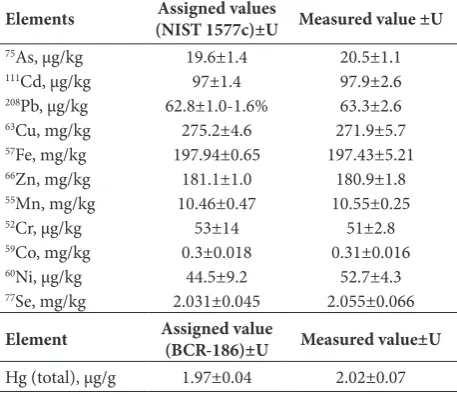
The quality of the analytical process with respect to accuracy and precision was assessed by analysis of the standard reference material SRM 1577c (NIST,
Gaithersburg, MD, USA). Reference material was prepared in a random manner during microwave digestion of each sample batch and run at the begin-ning, in the middle and at the end of each sample list. Measured concentrations were within the range of the certified values for all isotopes (Table 2).
Mercury (Hg) was measured using cold vapor tech-nique by atomic absorption spectrometer SpectrAA 220 (Varian, Palo Alto, USA) with a VGA 77 hydride system and SnCl2 in HCl as a reductant. Calibration was performed in five points; standard concentration range was 0.5-15.0 ng/mL. Absorption was measured at 257.3 nm. The quality of the analytical process was controlled using BCR-186 certified reference material (IRMM, Geel, Belgium). Reference material prepara-tion and analysis were conducted in the same manner as described previously. Obtained Hg concentrations corresponded to the certified value (Table 2). All con-centrations were expressed as µg g-1 dry weight (dw).
Statistical analysis
The statistical analysis included comparisons of metal and trace element concentrations between skin and muscle, gill arch and filaments, proximal and dis-tal liver sections, and the three intestine sections (proximal, median and distal). The normality of dis-tribution of the analyzed samples was tested by the Kolmogorov-Smirnov test. Since the variables lacked normality of distribution, nonparametric tests were applied. Groups were compared by the Mann-Whit-ney U test (p<0.05).
RESULTS
The average body length and weight of the analyzed wels catfish specimens were 64.2±4.5 cm (55.5-69.0 cm) and 1773±327 g (1190-2390 g), respectively. All specimens were immature, with males representing the majority of specimens (85%).
Elemental accumulation in the muscle and the skin significantly differed (p<0.05) for the majority of elements (Table 3). Significantly higher As, Co, Cu,
Table 1. Operating conditions for ICP-MS.
RF power 1550 W
Cooling gas flow 14 L/min
Nebulizer flow 1 L/min
Collision gas flow 1 mL/min
Operating mode KED
Dwell time 10 ms (Cr, Mn, Fe, Co, Ni, Cu, Zn, Se)100 ms (As, Cd, Pb) Sampling cone Platinum, 1 mm orifice diameter
Skimmer cone Platinum, 0.75 mm orifice diameter
Table 2. Assigned and measured concentrations of the SRM 1577c and BCR-186 reference material used for quality control. Values are given with the standard uncertainties and with the 95% con-fidence interval.
Elements (NIST 1577c)±U Measured value ±UAssigned values 75As, µg/kg 19.6±1.4 20.5±1.1 111Cd, µg/kg 97±1.4 97.9±2.6 208Pb, µg/kg 62.8±1.0-1.6% 63.3±2.6
63Cu, mg/kg 275.2±4.6 271.9±5.7 57Fe, mg/kg 197.94±0.65 197.43±5.21 66Zn, mg/kg 181.1±1.0 180.9±1.8
55Mn, mg/kg 10.46±0.47 10.55±0.25
52Cr, µg/kg 53±14 51±2.8
59Co, mg/kg 0.3±0.018 0.31±0.016
60Ni, µg/kg 44.5±9.2 52.7±4.3 77Se, mg/kg 2.031±0.045 2.055±0.066
Element Assigned value (BCR-186)±U Measured value±U
Fe, Mn and Zn concentrations were detected in the skin, while the muscle had significantly higher Hg concentrations. There were no differences between the two tissues regarding Cr, Cd, Ni, Pb and Se con-centrations.
The gill filaments and gill arch also differed sig-nificantly (p<0.05) for most of the studied elements (Table 4). Gill filaments had significantly higher Cd,
Co, Cr, Cu, Fe, Se and Hg concentrations and sig-nificantly lower Mn concentrations than the gill arch. There were no differences with regard to As, Ni, Pb and Zn between the two gill segments.
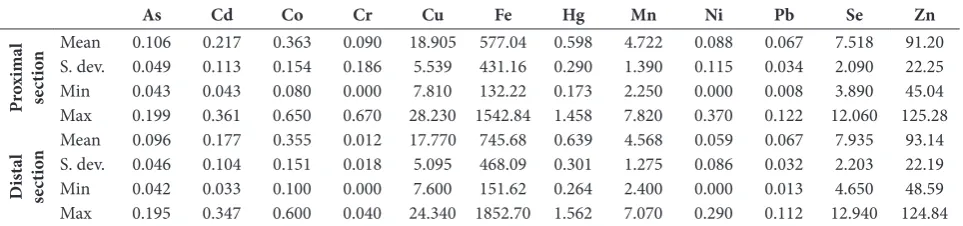
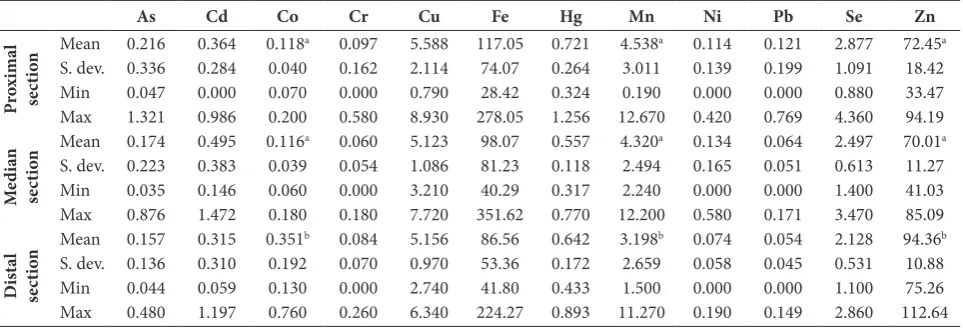
There were no differences (p>0.05) between el-emental concentrations in the two studied liver sec-tions (Table 5). The proximal and median intestine segments had the same elemental accumulation levels,
Table 3. Metal and trace element concentrations in muscle and skin of the wels catfish (mean, standard deviation, minimum and maxi-mum values). Concentrations are expressed as μg g-1 dry weight.
As Cd Co Cr Cu Fe Hg Mn Ni Pb Se Zn
M
us
cl
e MeanS. dev. 0.1310.097a 0.0040.007 0.0180.024a 0.1380.325 0.9490.656a 19.4615.08a 1.5980.536a 0.6740.401a 0.2110.120 0.0120.006 0.9050.333 19.6210.20a
Min 0.040 0.000 0.000 0.000 0.210 7.29 0.656 0.400 0.000 0.000 0.340 10.28 Max 0.394 0.024 0.090 1.190 1.980 63.62 2.841 1.910 0.680 0.035 1.420 40.03
Sk
in
Mean 0.360b 0.005 0.038b 0.154 1.902b 25.86b 0.657b 0.872b 0.244 0.009 0.866 58.95b
S. dev. 0.322 0.006 0.010 0.206 0.736 8.81 0.185 0.233 0.286 0.012 0.405 11.72 Min 0.055 0.000 0.020 0.000 0.990 17.09 0.274 0.470 0.000 0.000 0.370 42.69 Max 1.062 0.019 0.060 0.580 3.010 44.36 0.949 1.240 1.020 0.040 1.620 79.19 a, b The value with a different letter in the same column is different (Mann-Whitney U test, p<0.05)
Table 4. Metal and trace element concentrations in gill filaments and gill arch of the wels catfish (mean, standard deviation, minimum and maximum values). Concentrations are expressed as μg g-1 dry weight.
As Cd Co Cr Cu Fe Hg Mn Ni Pb Se Zn
G
ill
fil
ame
nts Mean 0.088 0.036
a 0.135a 0.271a 4.462a 162.98a 0.328a 14.982a 0.166 0.236 2.122a 80.42
S. dev. 0.024 0.014 0.059 0.116 1.784 38.31 0.082 10.357 0.161 0.188 0.528 20.84 Min 0.045 0.021 0.060 0.110 2.580 125.60 0.221 5.990 0.000 0.100 1.250 63.15 Max 0.129 0.074 0.240 0.510 8.640 258.27 0.490 44.060 0.450 0.788 3.120 138.71
G
ill a
rch Mean 0.117 0.005
b 0.054b 0.090b 0.412b 43.98b 0.071b 34.666b 0.211 0.387 0.715b 69.81
S. dev. 0.097 0.004 0.019 0.117 0.194 19.70 0.054 20.245 0.312 0.407 0.275 5.33 Min 0.036 0.000 0.030 0.002 0.150 23.16 0.034 15.920 0.000 0.192 0.280 60.72 Max 0.386 0.013 0.100 0.450 0.760 77.82 0.216 84.230 0.860 1.718 1.240 79.18 a, b The value with a different letter in the same column is different (Mann-Whitney U test, p<0.05)
Table 5. Metal and trace element concentrations in two liver sections (proximal and distal) of the wels catfish (mean, standard deviation, minimum and maximum values). Concentrations are expressed as μg g-1 dry weight.
As Cd Co Cr Cu Fe Hg Mn Ni Pb Se Zn
Pr
oxima
l
se
ct
io
n MeanS. dev. 0.0490.106 0.1130.217 0.1540.363 0.0900.186 18.905 577.045.539 431.16 0.2900.598 4.7221.390 0.0880.115 0.0670.034 7.5182.090 91.2022.25
Min 0.043 0.043 0.080 0.000 7.810 132.22 0.173 2.250 0.000 0.008 3.890 45.04 Max 0.199 0.361 0.650 0.670 28.230 1542.84 1.458 7.820 0.370 0.122 12.060 125.28
Dis
ta
l
se
ct
io
n MeanS. dev. 0.0460.096 0.1040.177 0.1510.355 0.0120.018 17.770 745.685.095 468.09 0.3010.639 4.5681.275 0.0590.086 0.0670.032 7.9352.203 93.1422.19
while they both had significantly higher Co and Zn concentrations and lower Mn concentrations than the posterior segment (Table 6).
DISCUSSION
No differences in elemental accumulation were ob-served between the two studied liver segments, as well as between the two upper intestine sections. On the other hand, the muscle and skin significantly differed in their elemental accumulation patterns. Significant differences were also observed between the gill arch and the filaments, as well as between the distal and two upper intestine sections.
Higher accumulation of As, Co, Cu, Fe, Mn and Zn in the skin than in the muscle was also observed by other authors [9,13-15]. Higher concentrations in the skin could be the result of metal complexion with the mucus [14]. Metal ions from water are able to bind to the mucus layer present on the body surface, which can lead to a higher uptake and absorption in the skin [16]. This is particularly the case with fishes without scales, such as wels catfish, where the mucus layer serves as a shield against permeation of environmental chemicals [17,18]. On the other hand, the muscle has a weak accumulation potential and often represents the tissue with the lowest elemental concentrations in fish [6,19,20]. Uysal et al. [21] observed a lack of
clear accumulation patterns between the two tissues, since different species had maximum concentrations in either muscle or skin. In the present study, higher Hg concentrations were detected in the muscle (Table 3), while Storelli et al. [9] did not observe any differ-ences between these two tissues. According to Fu et al. [22], skin is not an active tissue for Hg bioaccumula-tion. The inclusion of skin in the sample can actually reduce resulting concentrations detected in the muscle sample [23], and consequently present a false finding of the acceptable metal levels in fish meat. Other au-thors also found differences between the two tissues as regards Cd, Cr, Ni, Pb and Se accumulation [9,10-15,21], which was not observed in the present study. Removal of skin from the muscle sample for metal analyses is commonly recommended by fish sampling protocols [23-25].
Potential differences between the gill arch and filaments with regard to elemental accumulation have been rarely assessed. Crafford and Avenant-Oldewage [10] reported higher Ni and Pb accumulation in the gill arch, which was not observed in the present study. However, bony tissues are considered to be a major Pb accumulation center, where it accumulates due to its similarity to calcium [26,27]. Our results indicated a higher Mn concentration in the gill arch, while most of the other studied elements had lower concentra-tions than those found in the gill filaments (Table 4).
Table 6. Metal and trace element concentrations in three intestine sections (proximal, median, and distal) of the wels catfish (mean, standard deviation, minimum and maximum values). Concentrations are expressed as μg g-1 dry weight.
As Cd Co Cr Cu Fe Hg Mn Ni Pb Se Zn
Pr
oxima
l
se
ct
io
n MeanS. dev. 0.3360.216 0.2840.364 0.1180.040a 0.0970.162 5.5882.114 117.0574.07 0.2640.721 4.5383.011a 0.1390.114 0.1990.121 1.0912.877 72.4518.42a
Min 0.047 0.000 0.070 0.000 0.790 28.42 0.324 0.190 0.000 0.000 0.880 33.47 Max 1.321 0.986 0.200 0.580 8.930 278.05 1.256 12.670 0.420 0.769 4.360 94.19
M
edi
an
se
ct
io
n MeanS. dev. 0.2230.174 0.3830.495 0.1160.039a 0.0600.054 5.1231.086 98.0781.23 0.1180.557 4.3202.494a 0.1650.134 0.0510.064 0.6132.497 70.0111.27a
Min 0.035 0.146 0.060 0.000 3.210 40.29 0.317 2.240 0.000 0.000 1.400 41.03 Max 0.876 1.472 0.180 0.180 7.720 351.62 0.770 12.200 0.580 0.171 3.470 85.09
Dis
ta
l
se
ct
io
n MeanS. dev. 0.1360.157 0.3100.315 0.3510.192b 0.0840.070 5.1560.970 86.5653.36 0.1720.642 3.1982.659b 0.0580.074 0.0450.054 0.5312.128 94.3610.88b
Mn tends to accumulate at the highest levels in bony tissues and it also represents a normal constituent of vertebrate skeletal tissues [26,27]. Higher Cd, Co, Cr, Cu, Fe, Hg and Se accumulation levels in the gill filaments are probably a result of the direct uptake from water, since gills represent the main accumula-tion route of waterborne polluaccumula-tion [8,9]. Some metals also tend to accumulate at higher concentrations in gills due to their slow excretion rate [28].
Our findings indicated that there were no dif-ferences in elemental accumulation between the two studied liver sections (Table 5). To our knowledge, this issue was not assessed in any of the previous studies. Assessment of metal accumulation in the intestine indicated that Co, Mn and Zn concentrations in the distal section differed from those in the two upper intestine sections, while there were no differences observed between the latter two. The observed dif-ferential accumulation among the studied intestine sections could be caused by differences in their ac-tivity. According to the literature survey, the present study was the first to address this issue.
Findings of the present study emphasize the ne-cessity of a detailed reporting of how fish tissue is sampled. It is especially important to report whether the skin was included with the muscle sample, as well as if the gill arch and filaments were analyzed together. Moreover, information on the exact intestine section sampled should also be provided, especially if the study is focused on the elements for which dif-ferences in accumulation level have been observed in the present study. On the other hand, our findings indicate that such information is not necessary when the liver is used for analysis.
It is important to note that a potential bias can oc-cur if different ratios of muscle and skin are included in a sample, and the same holds true for the gill arch and filaments. Therefore, we strongly recommend that the skin should not be analyzed together with the muscle, nor the gill arch with the gill filaments. We believe that the presented findings will be of im-portance to a wider scientific community, particularly regarding implications for human consumption when
assessing metal levels in edible fish, as well as implica-tions for biological monitoring practices.
Acknowledgments: This study was supported by the Ministry of Education, Science, and Technological Development of the Repub-lic of Serbia, Project No. TR37009 and Project No. 173045, as well as by the Secretariat for Environmental Protection of the City of Belgrade, Project No. 4011-110. The authors would like to thank Dr. Mirjana Mihajlović for her help during the sample lyophiliza-tion and Žarko Radovanović for collecting the fish.
REFERENCES
1. Alkan N, Alkan A, Gedik K, Fisher A. Assessment of metal concentrations in commercially important fish species in Black Sea. Toxico Ind Health. 2016;32(3):447-56.
2. Alibabić V, Vahčić N, Bajramović M. Bioaccumulation of metals in fish of Salmonidae family and the impact on fish meat quality. Environ Monit Assess. 2007;131:349-64. 3. Yilmaz F, Özdemir N, Demirak A, Tuna AL. Heavy metal
levels in two fish species Leuscius cephalus and Lepomis gib-bosus. Food Chem. 2007;100:830-5.
4. Azevedo JS, Sarkis JES, Hortellani MA, Ladle RJ. Are catfish (Arridae) effective bioindicators for Pb, Cd, Hg, Cu and Zn. Water Air Soil Pollut. 2012;223:3911-22.
5. Begum A, Mustafa AI, Amin MN, Chowdhury TR, Quraishi SB, Banu N. Levels of heavy metals in tissues of shingi fish (Heteropneustes fossilis) from Buriganga River, Bangladesh. Environ Monit Assess. 2013;185:5461-9.
6. Erdoğrul Ö, Erbilir F. Heavy metal and trace elements in various fish samples from Sir Dam Lake, Kahramanmaraş, Turkey. Environ Monit Assess. 2007;130:373-9.
7. Zhuang P, Li Z, McBride MB, Zou B, Wang G. Health risk assessment for consumption of fish originating from ponds near Dabaoshan mine, South China. Environ Sci Pollut Res. 2013;20:5844-54.
8. Golovanova IL. Effects of heavy metals on the physiological and biochemical status of fishes and aquatic invertebrates. Inland Water Biol. 2008;1:93-101.
9. Storelli MM, Barone G, Storelli A, Marcotrigiano GO. Trace metals in tissues of Mugilids (Mugil auratus, Mugil capito, and Mugil labrosus) from the Mediterranean Sea. Bull Envi-ron Contam Tox. 2006;77:43-50.
concentra-tions in wels catfish (Silurus glanis) from the Danube River by ICP-MS. Environ Sci Pollut Res. 2015;22:3820-7. 12. Bosi G, Shinn AP, Simoni E, Arrighi S, Domeneghini C. A
comparative immunohistochemical study on a galanin-like peptide in the neuroendocrine system of the alimentary canal of three species of siluriform catfishes. J Fish Biol. 2006;68:86-100.
13. Al-Yousuf MH, El-Shahawi MS, Al-Ghais SM. Trace met-als in liver, skin and muscle of Lethrinus lentjan fish spe-cies in relation to body length and sex. Sci Tot Environ. 2000;256:87-94.
14. Al-Weher SM. Levels of heavy metal Cd, Cu and Zn in three fish species collected from the Northern Jordan Valley, Jor-dan. Jordan J Biol Sci. 2008;1:41-6.
15. Schenone NF, Avigliano E, Goessler W, Cirelli AF. Toxic metals, trace and major elements determined by ICPMS in tissues of Parapimelodus valenciennis and Prochilodus lineatus from Chascomus Lake, Argentina. Microchem J. 2014;112:127-31.
16. Tao S, Li H, Lui C, Lam KC. Fish uptake of inorganic and mucus complexes of lead. Ecotoxicol Environ Safety. 2000;46:174-80. 17. Ferreira J, Schoonbee H, Smit G. The uptake of the
anaes-thetic benzocaine hydrochloride by the gills and the skin of three freshwater fish species. J Fish Biol. 1984;25:35-41. 18. [18] ose J, Hutcheson MS, West CR, Pancorbo O, Hulme
K, Cooperman A, Decesare G, Isaac R, Screpetis A. Fish mercury distribution in Massachusetts, USA lakes. Environ Toxicol Chem. 1999;18:1370-9.
19. Bervoets L, Blust R. Metal concentrations in water, sediment and gudgeon (Gobio gobio) from a pollution gradient: relation-ship with fish condition factor. Environ Pollut. 2003;126:9-19. 20. Lenhardt M, Jarić I, Višnjić-Jeftić Ž, Skorić S, Gačić Z, Pucar
M, Hegediš A. Concentrations of 17 elements in muscle, gills, liver and gonads of five economically important fish
species from the Danube River. Knowl Manag Aquat Ecosyst. 2012;407:1-10.
21. Uysal K, Köse E, Bülbül M, Dönmez M, Erdoğan Y, Koyun M, Ömeroğlu Ç, Özmal F. The comparison of heavy metal accumulation ratios of some fish species in Enne Dame Lake (Kütahya/Turkey). Environ Monit Assess. 2009;157:355-62. 22. Fu Z, Wu F, Amarasiriwardena D, Mo C, Liu B, Zhu J, Deng
Q, Liao H. Antimony, arsenic and mercury in the aquatic environment and fish in a large antimony mining area in Hunan, China. Sci Total Environ. 2010;408:3403-10. 23. EPA. Guidance for assessing chemical contaminant data for
use in fish advisories. Vol. 1, Fish sampling and analysis. 3rd
ed. Washington: Environmental Protection Agency. 2000. 24. Sharma CM, Rosseland BO, Almvik M, Eklo OM.
Bioaccu-mulation of organochlorine pollutants in the fish community in Lake Årungen, Norway. Environ Pollut. 2009;157:2452-8. 25. UNEP. Sampling of selected marine organisms and sample preparation for trace metal analysis. Geneva: Regional Seas Programme Activity Centre, UNEP; 1984. 19 p. (Reference method for marine pollution studies; no. 7; rev. 2).
26. Castro-González MI, Méndez-Armenta M. Heavy metals: implications associated to fish consumption. Environ Toxicol Phar. 2008;26:263-71.
27. Seymore T, Du Preez HH, Van Vuren JHJ. Manganese, lead and strontium bioaccumulation in the tissues of the yel-lowfish, Barbus marequensis from the lower Olifants River, Eastern Transvaal. Water SA. 1995;21:159-72.